Monthly Mean Salinity#
Plots of monthly mean surface salinity are shown in this section.
Differences between the USGS river-forced CIOFS model (left) and the watershed model-forced CIOFS model (right) are stark in both winter and summer. The differences are less widespread in the winter (Fig. 4) as compared with the summer (Fig. 5).
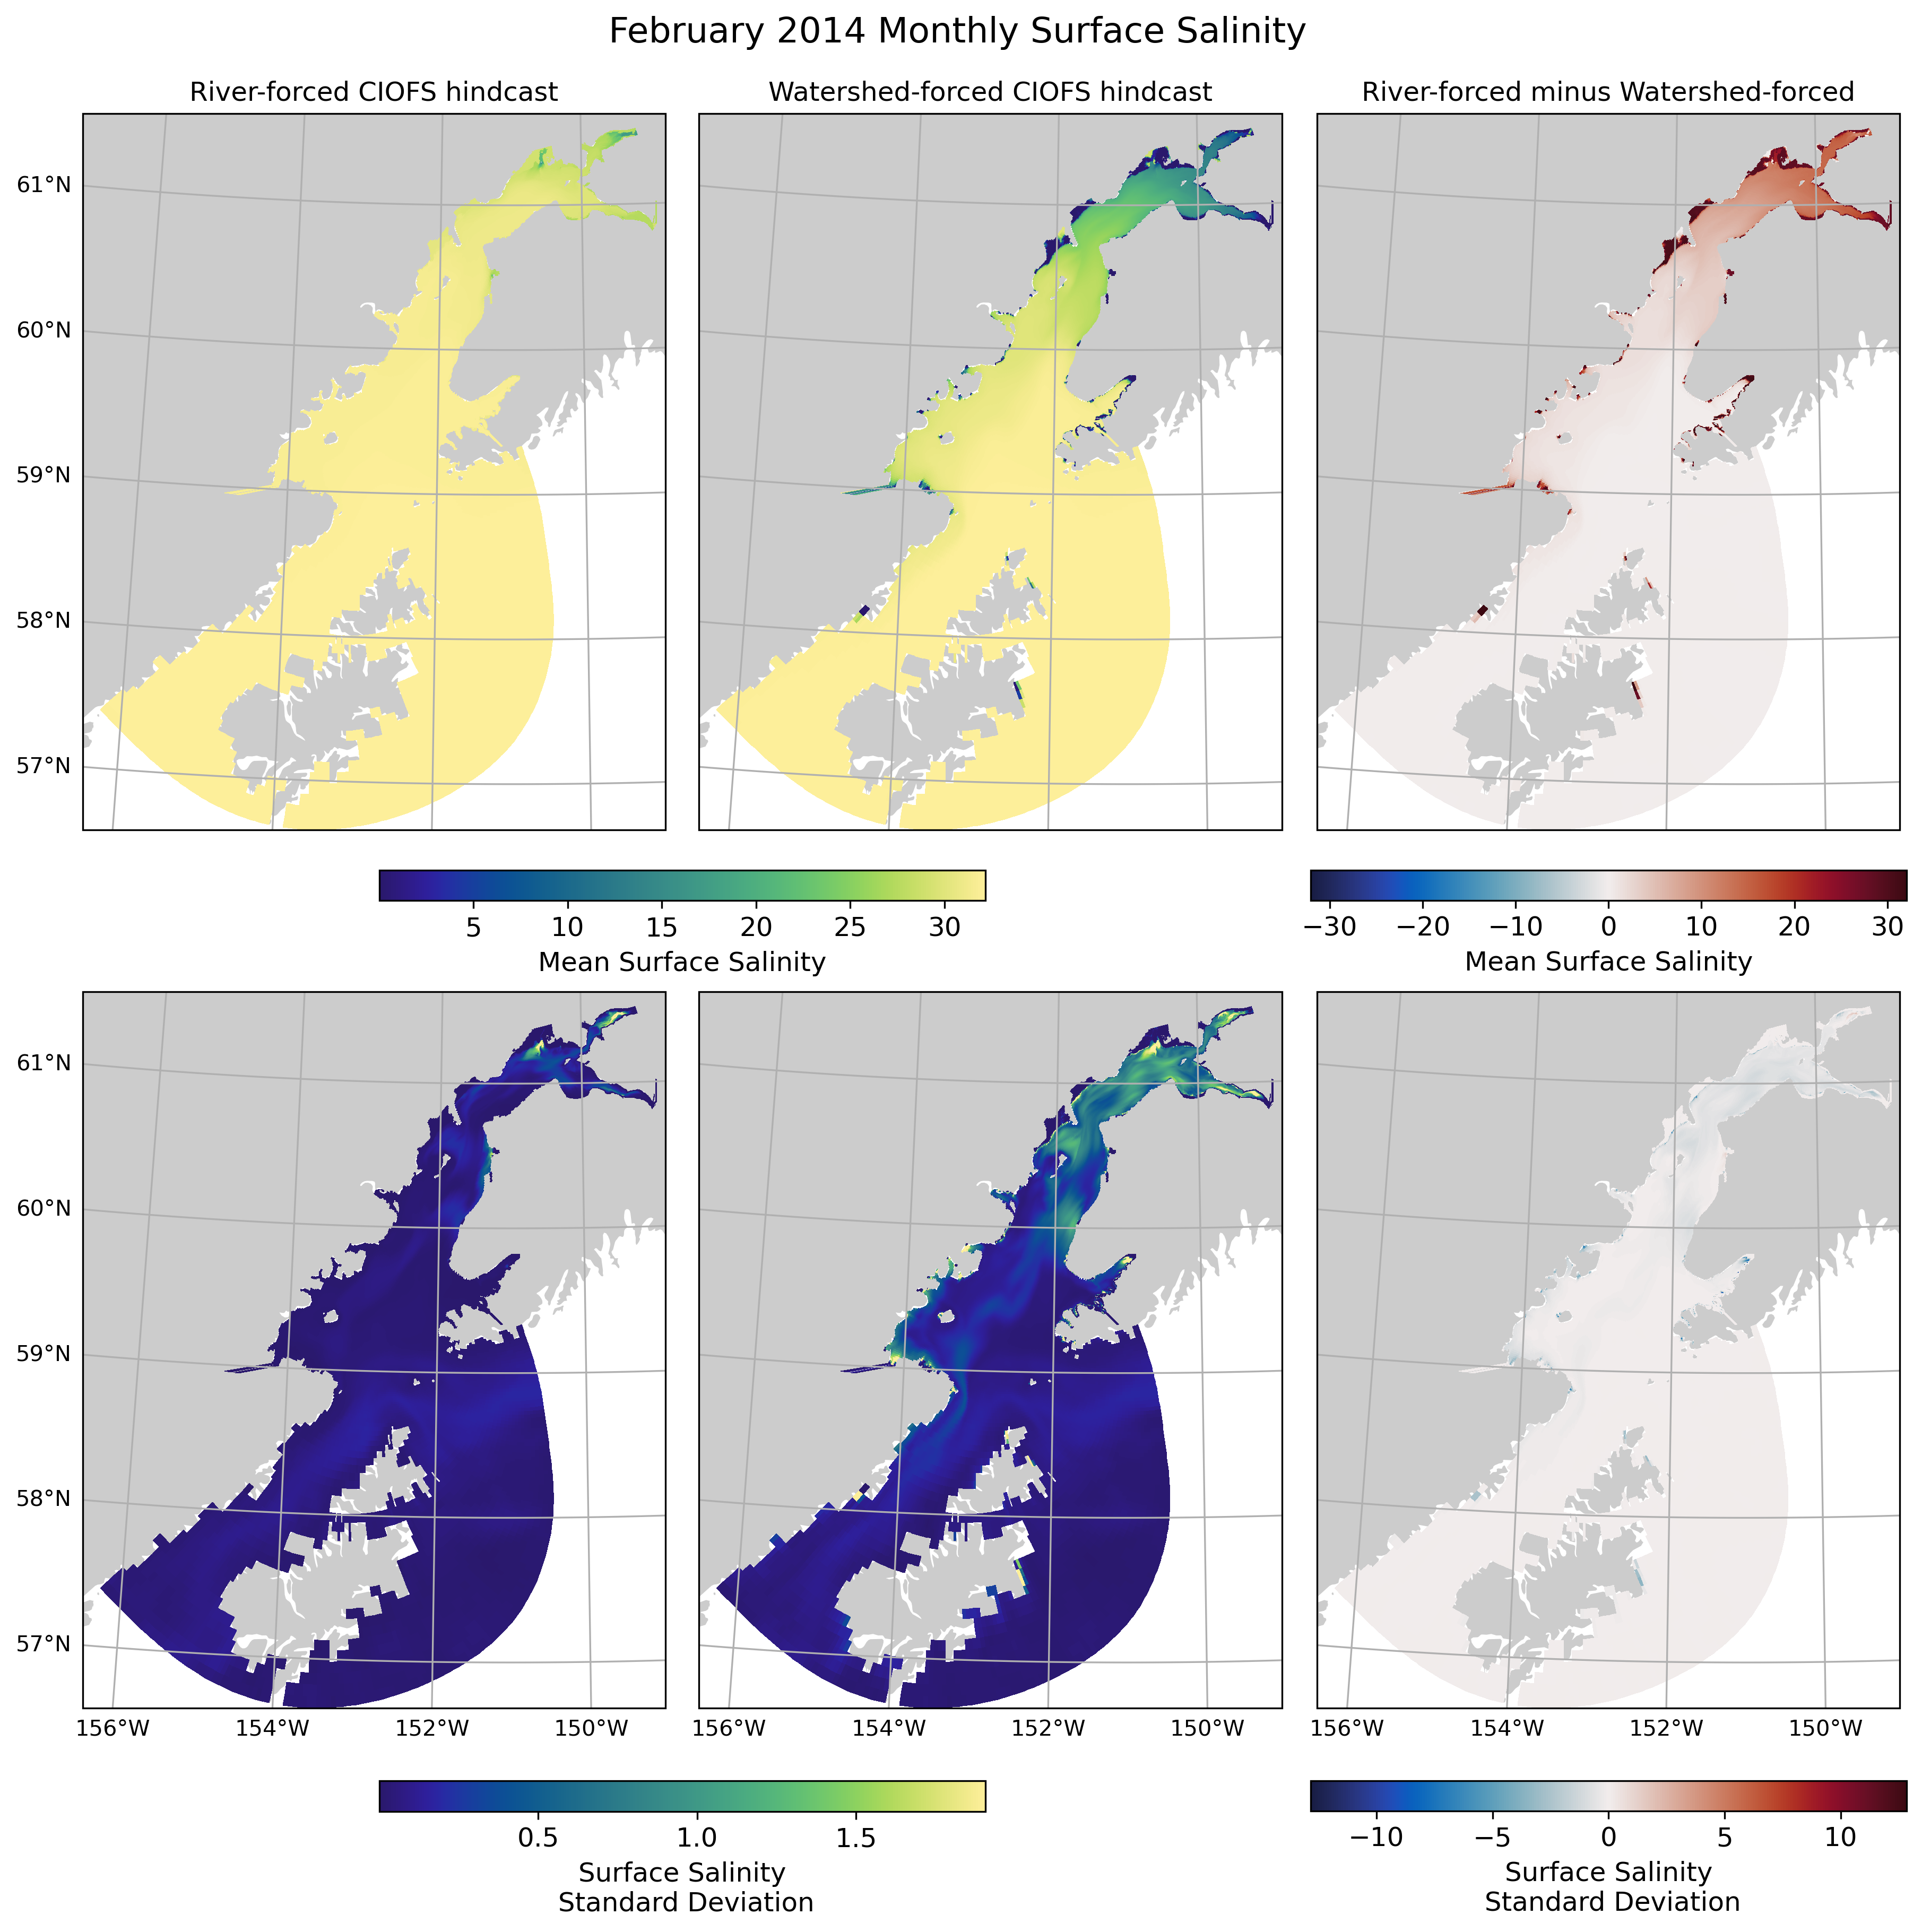
Fig. 4 Mean surface salinity between the USGS river-forced CIOFS model (left) and watershed model-forced CIOFS model (right) in February 2014.#
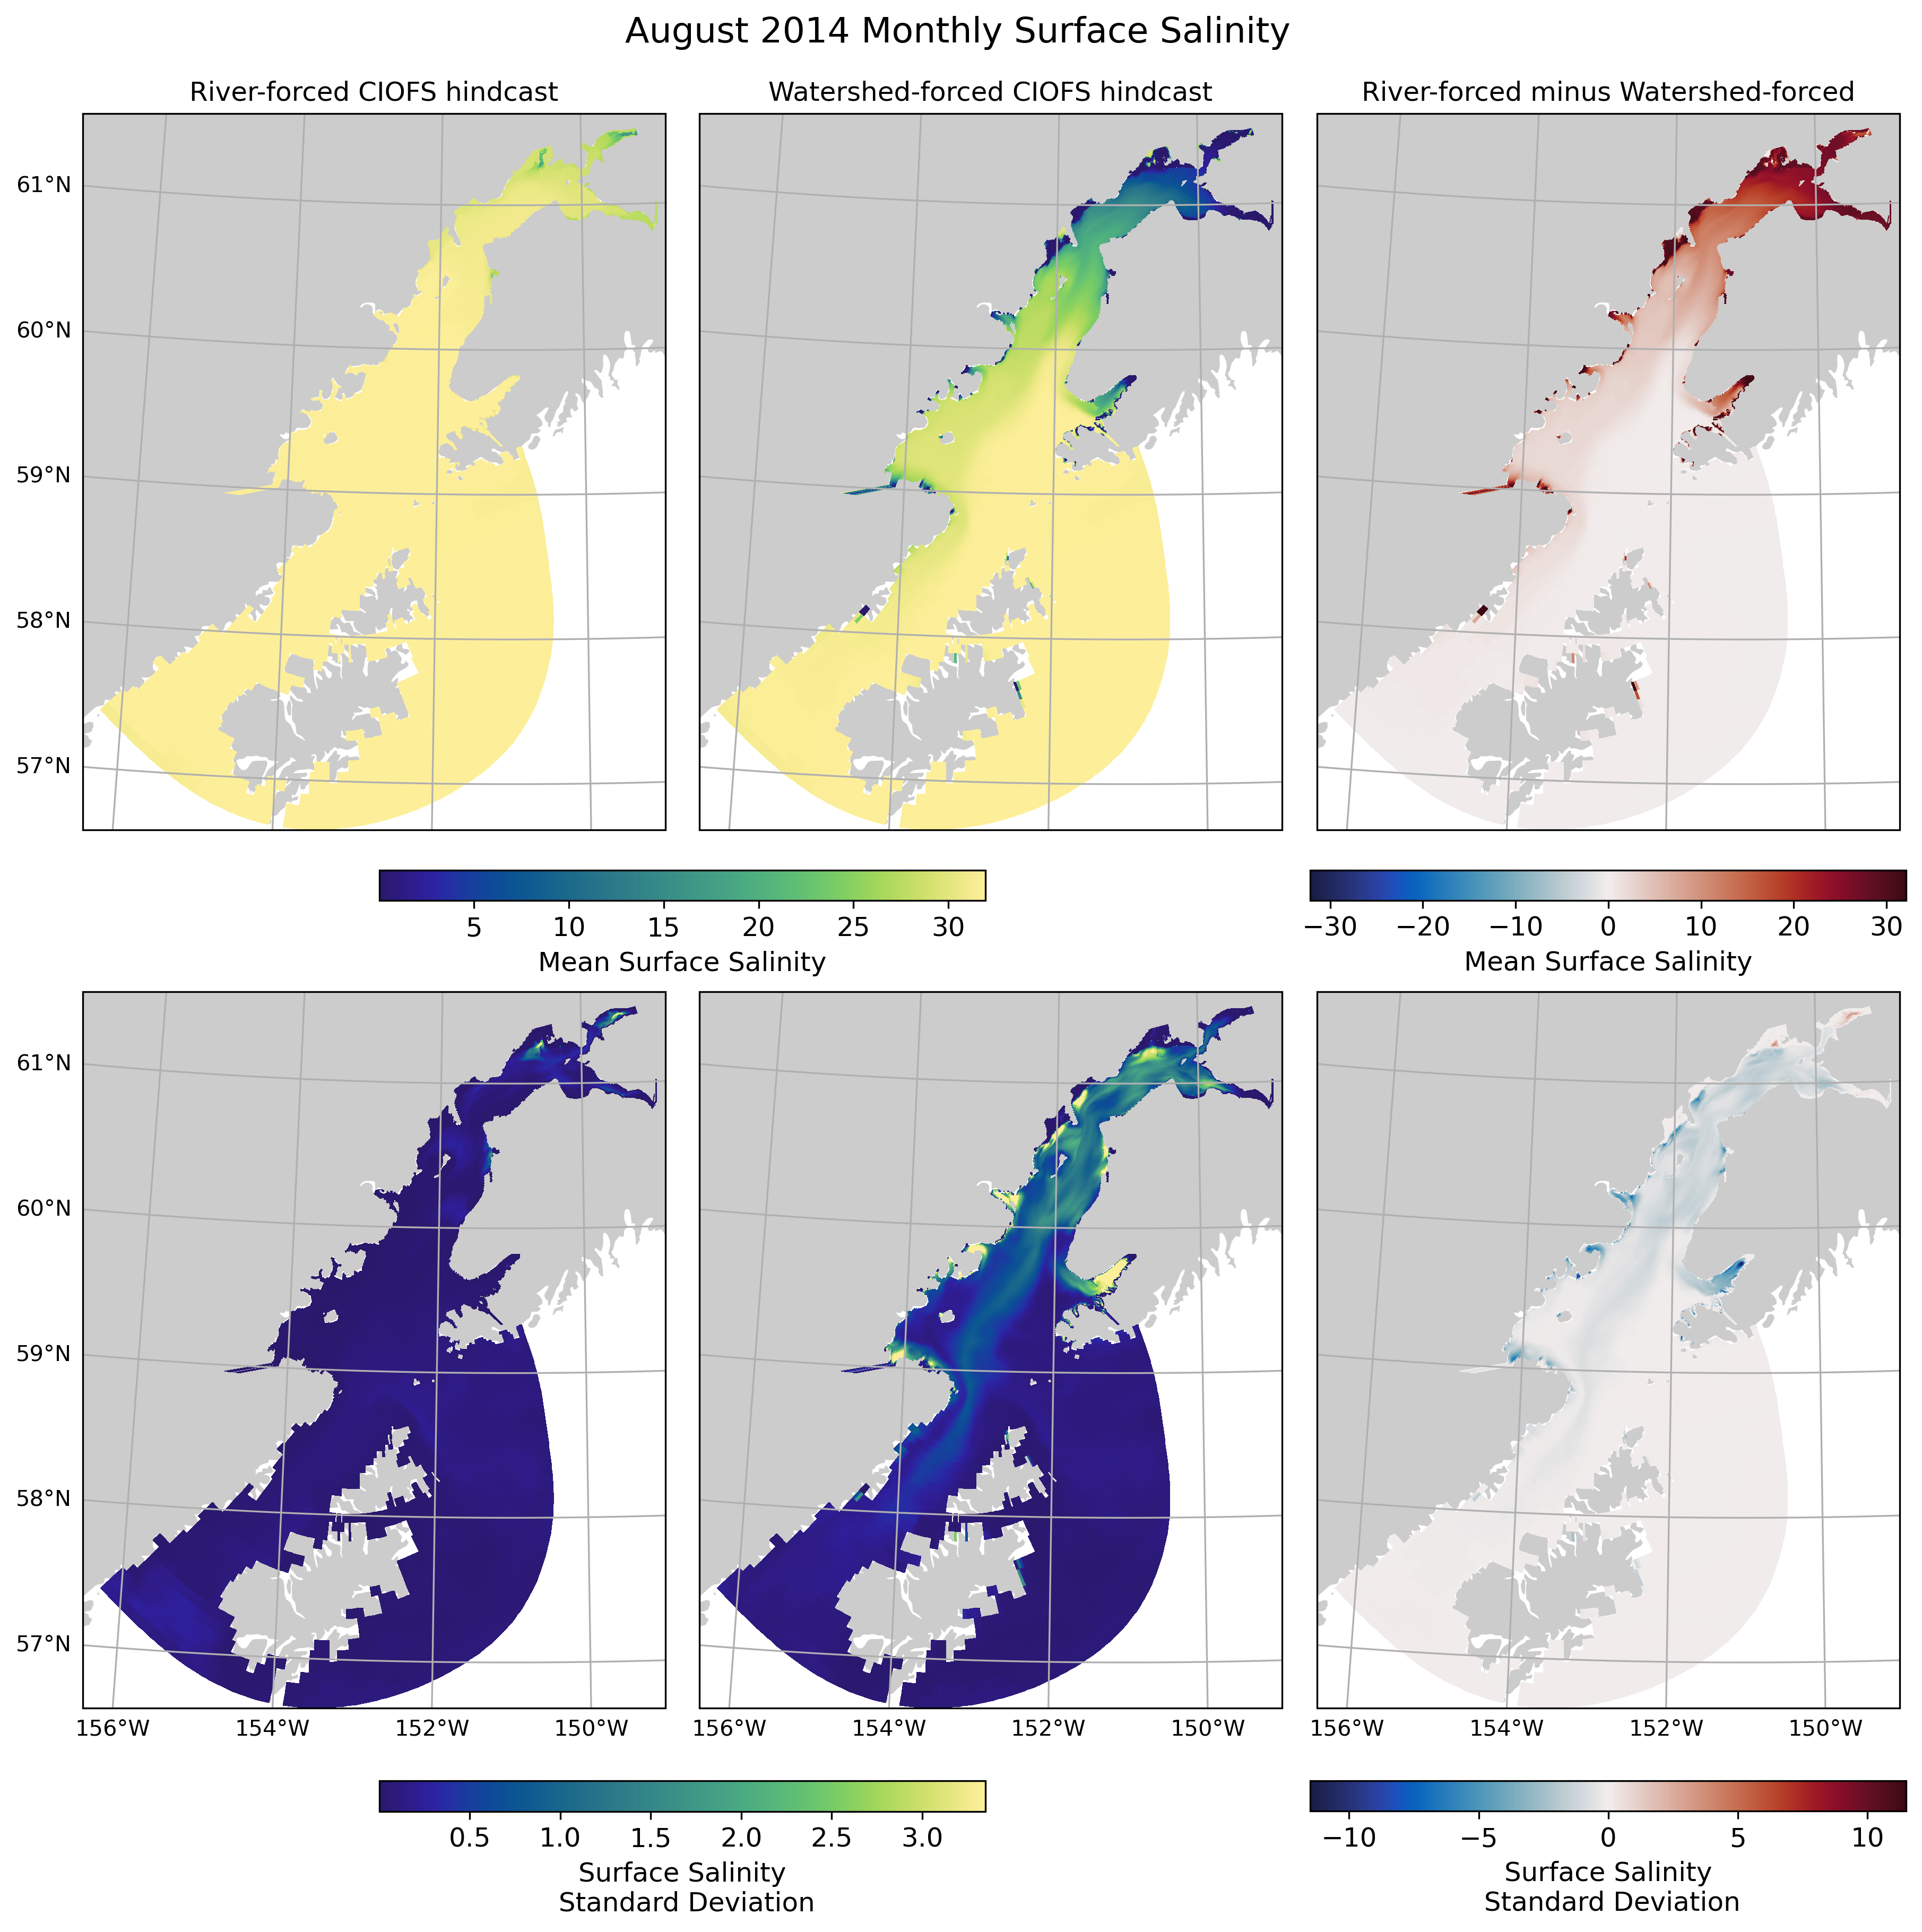
Fig. 5 Mean surface salinity between the USGS river-forced CIOFS model (left) and watershed model-forced CIOFS model (right) in August 2014.#