Moorings (NOAA): across Cook Inlet#
moorings_noaa
See the original full dataset description page in the original report for more information or the new catalog page.
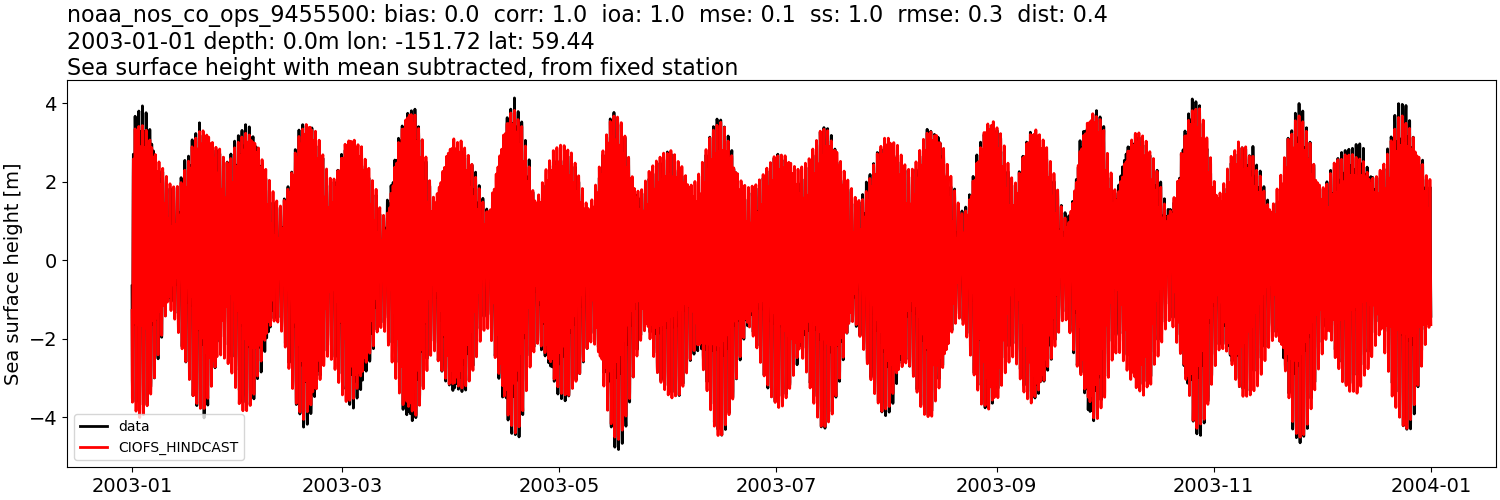
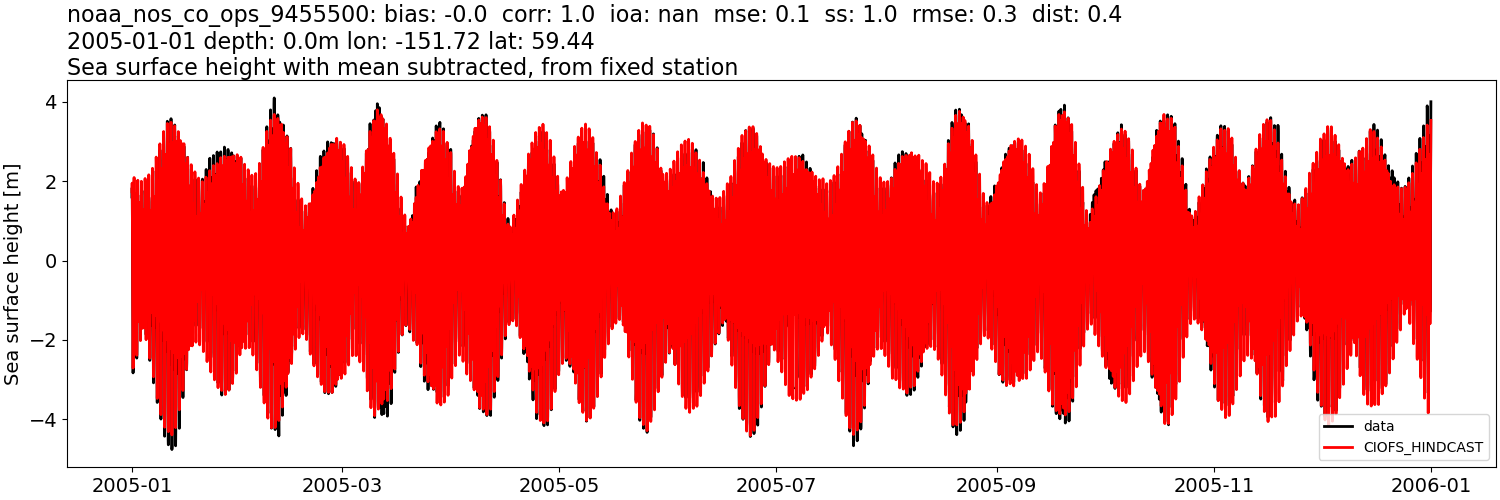
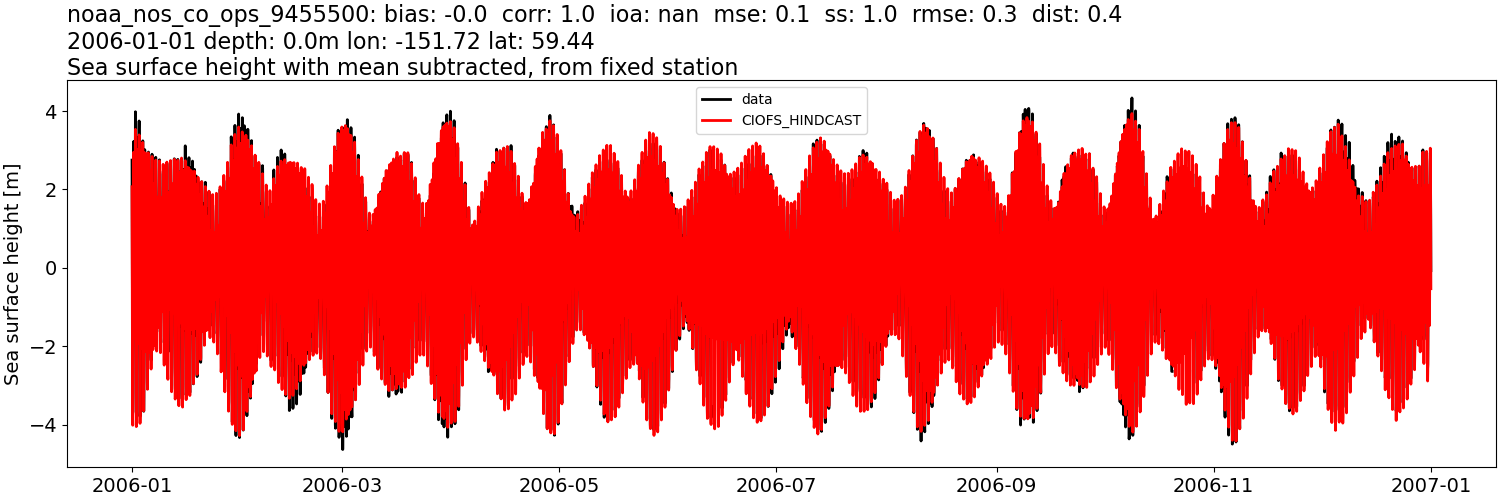
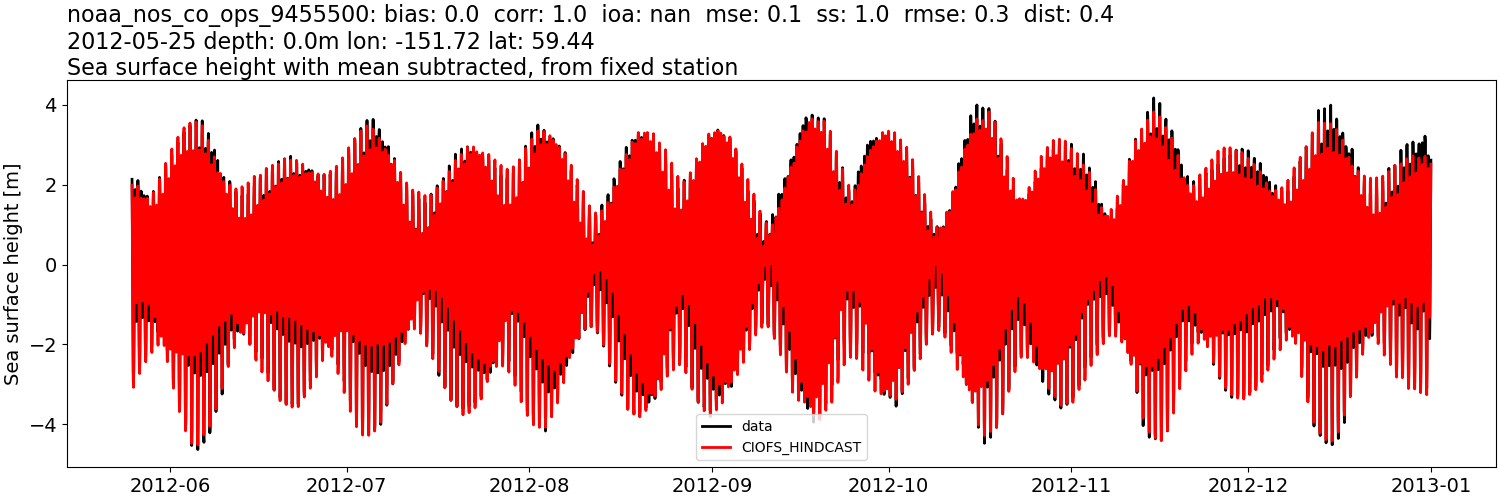
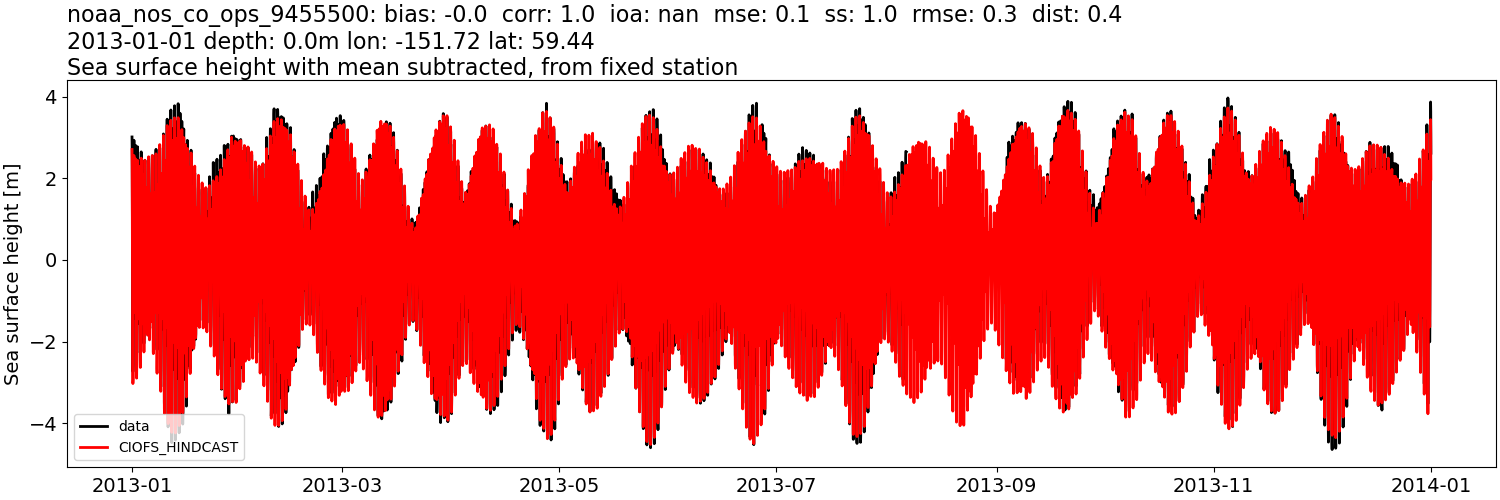
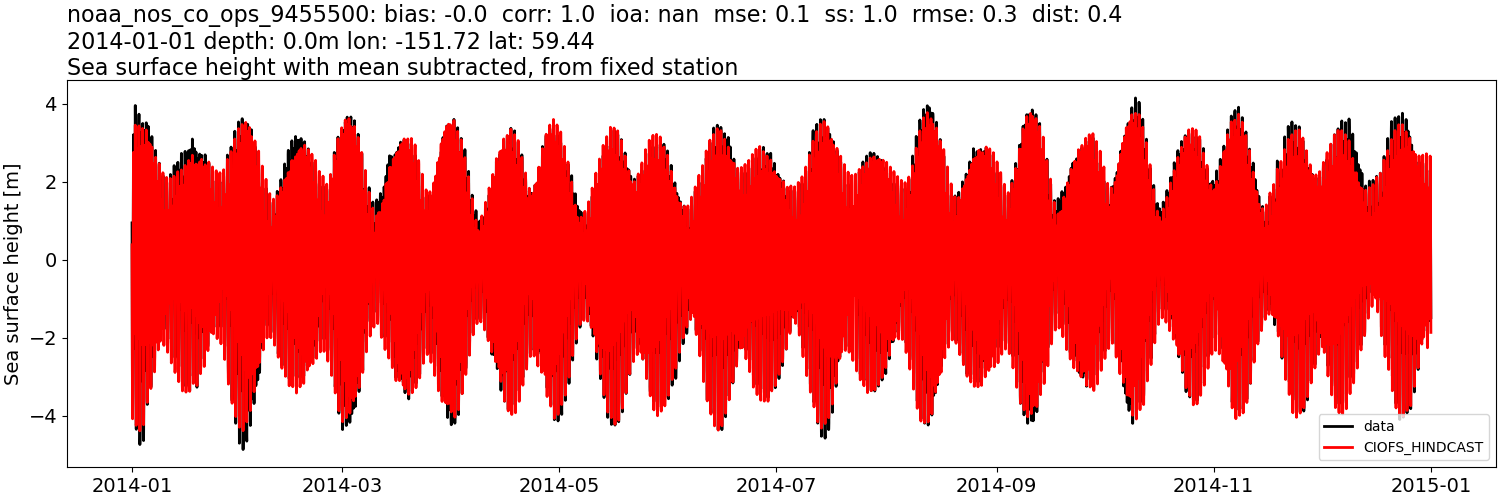
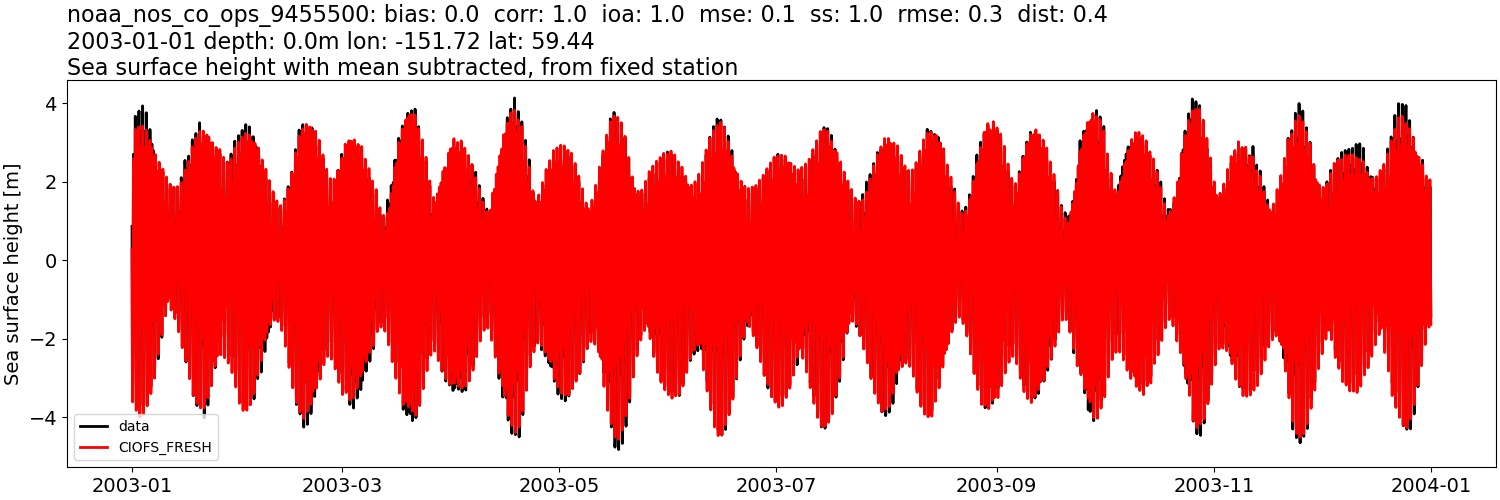
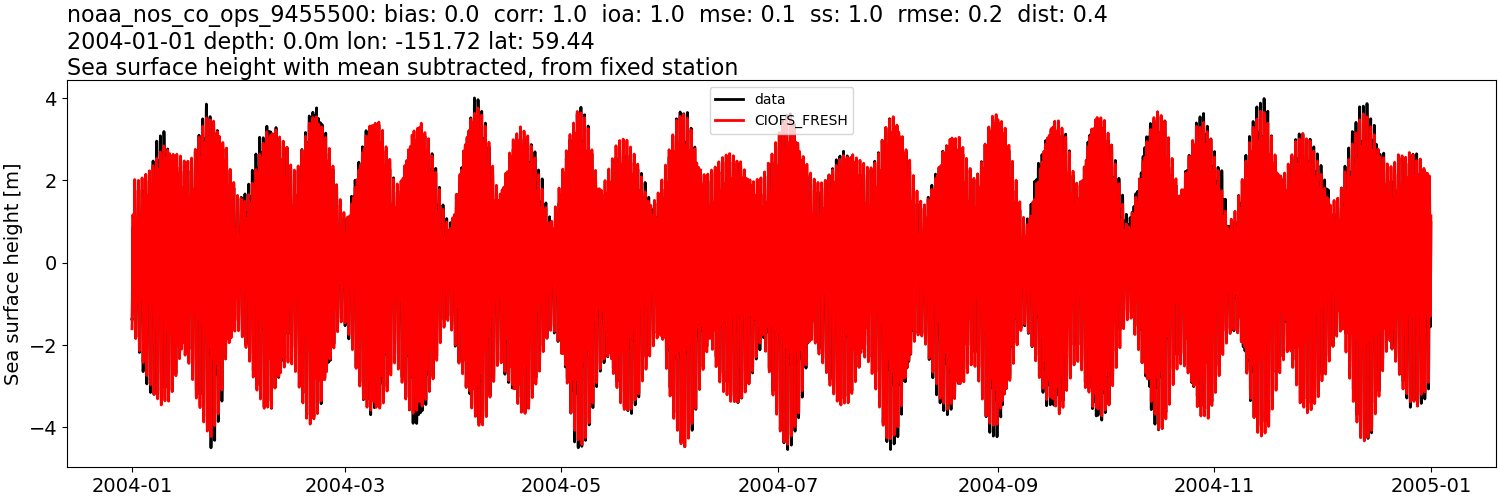
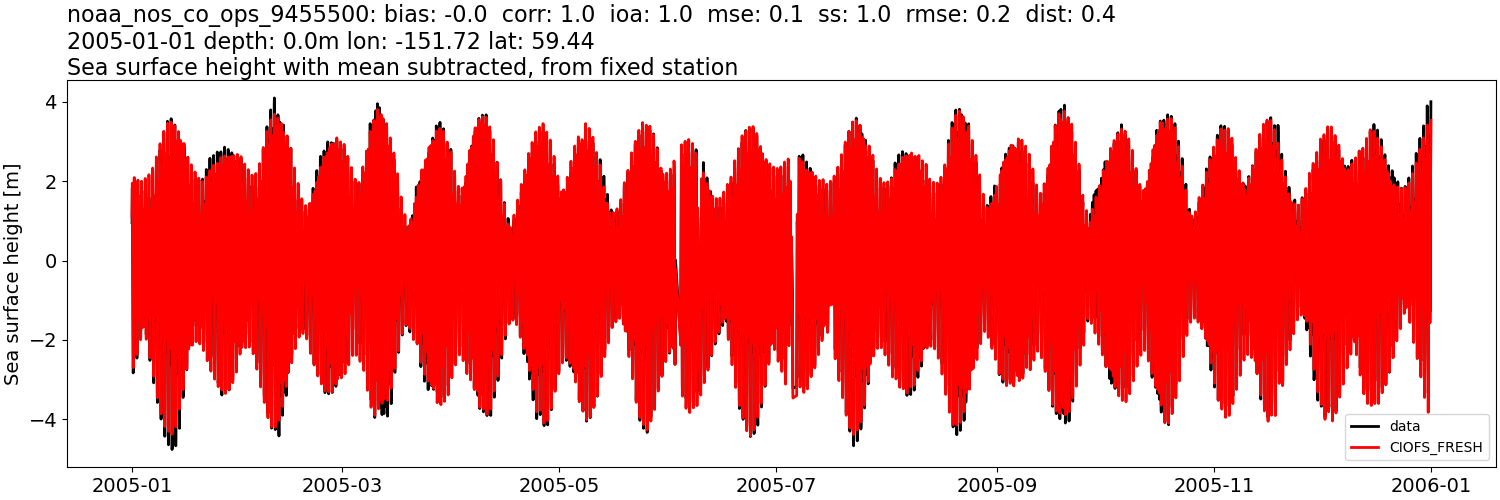
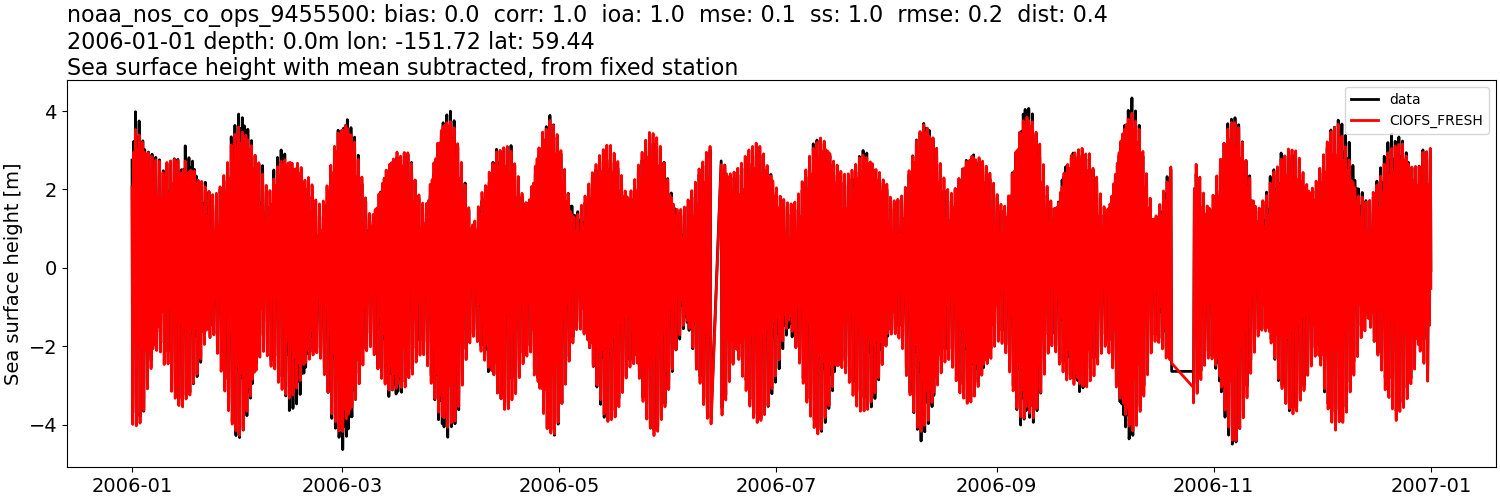
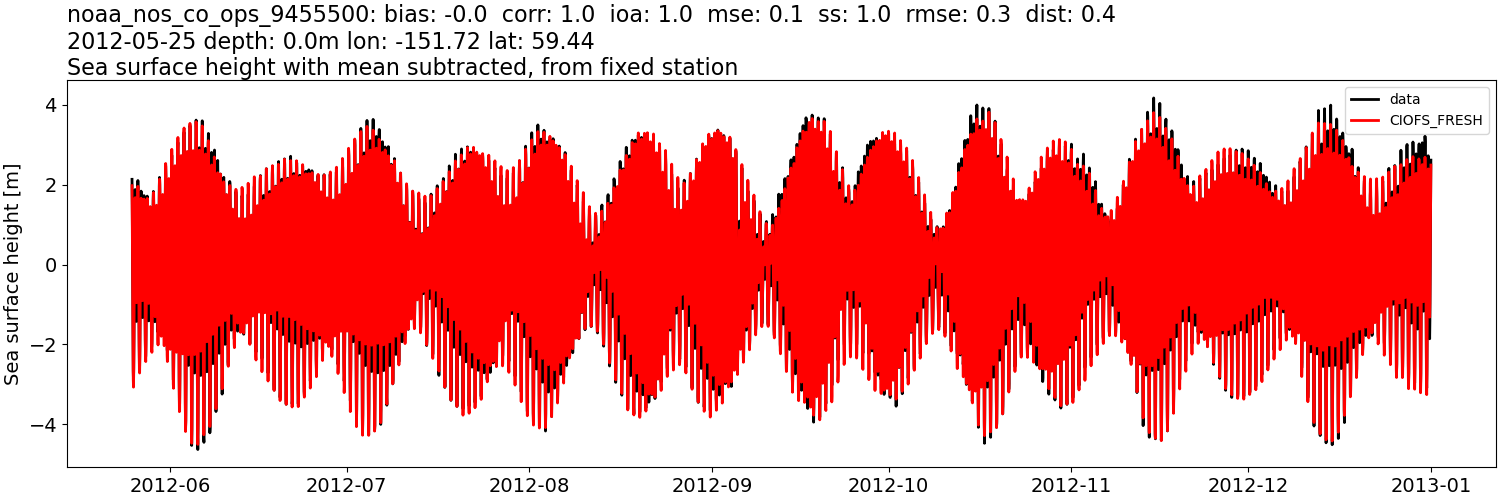
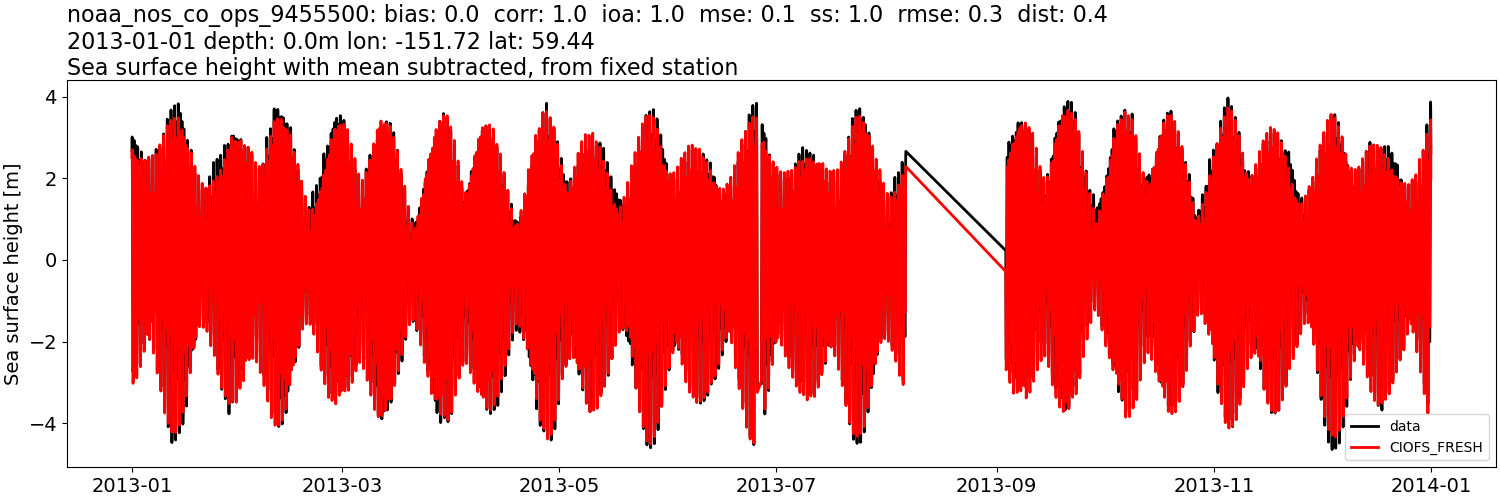
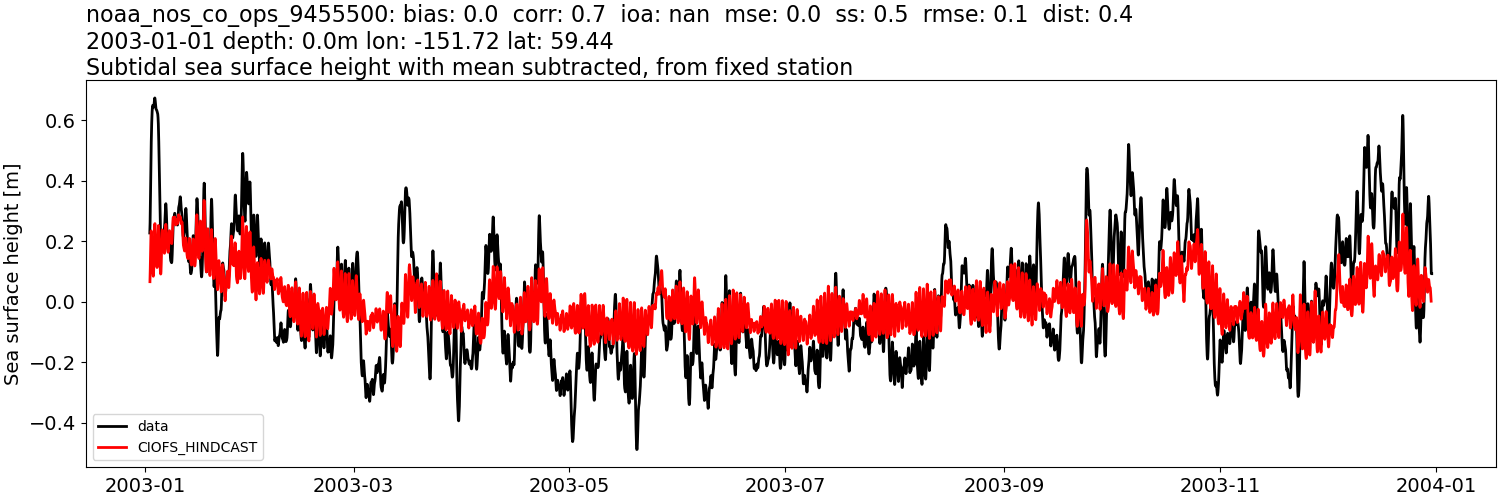
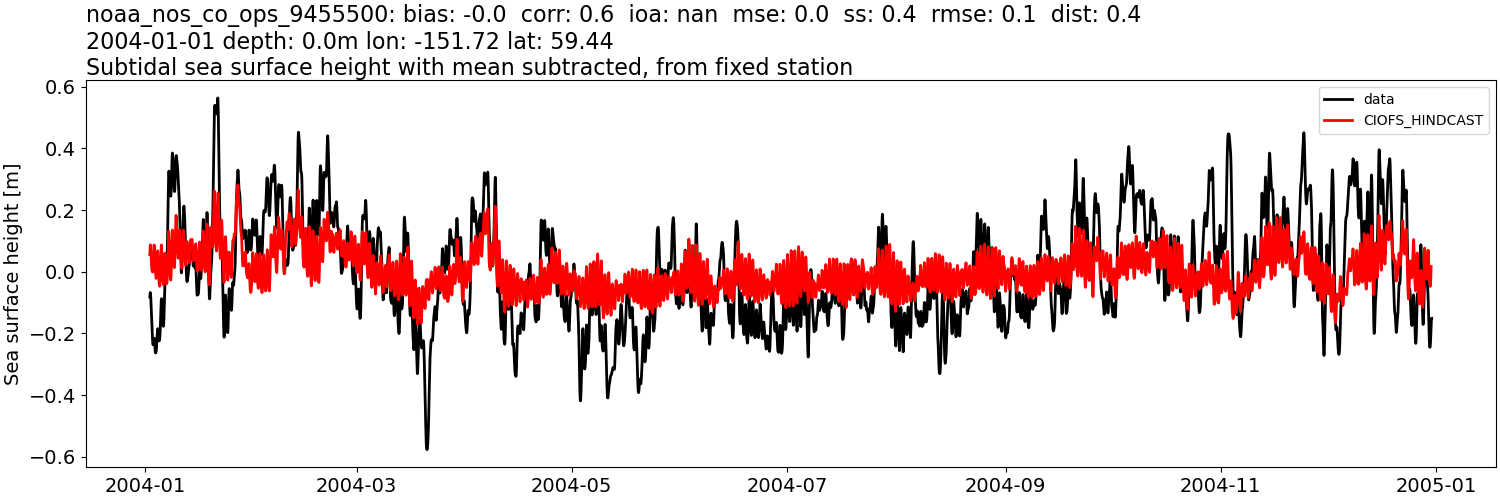
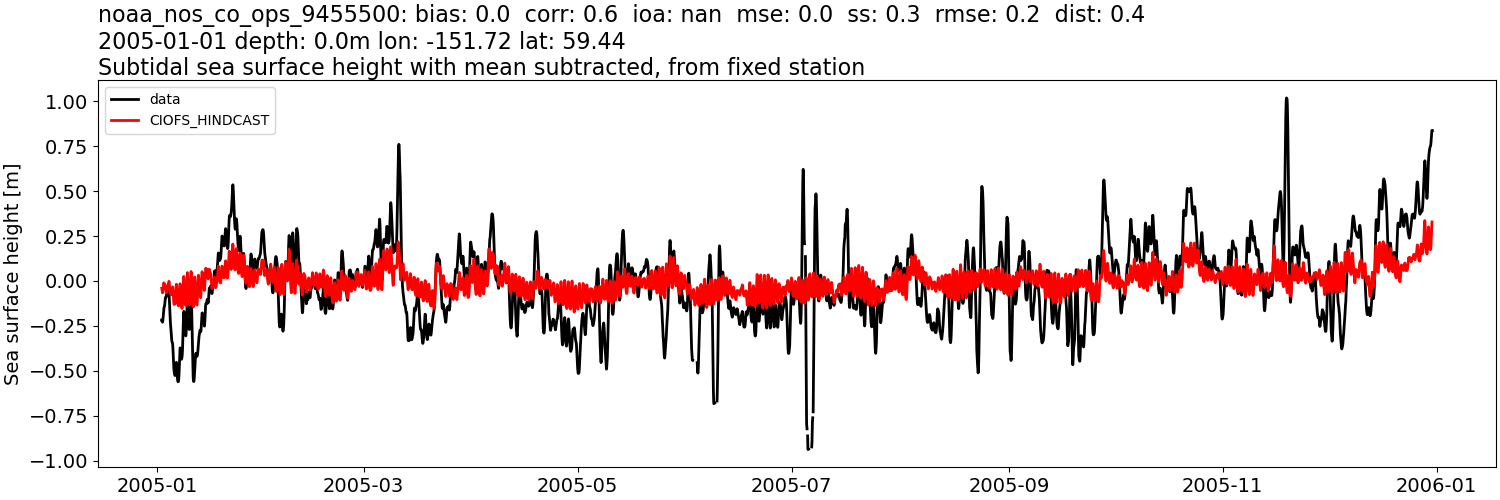
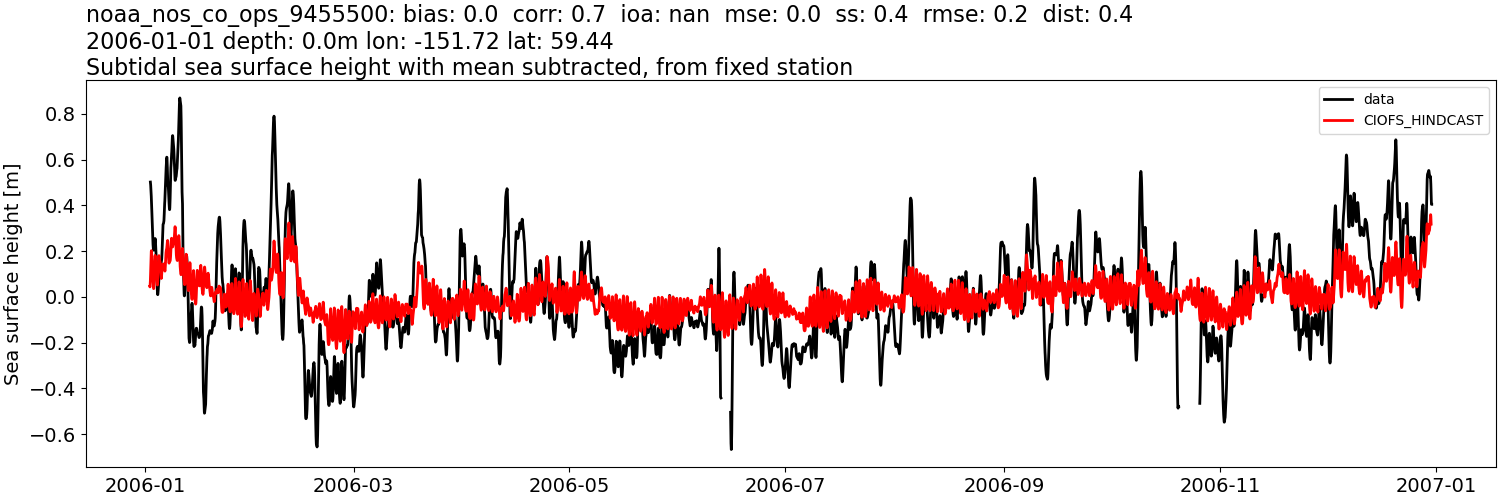
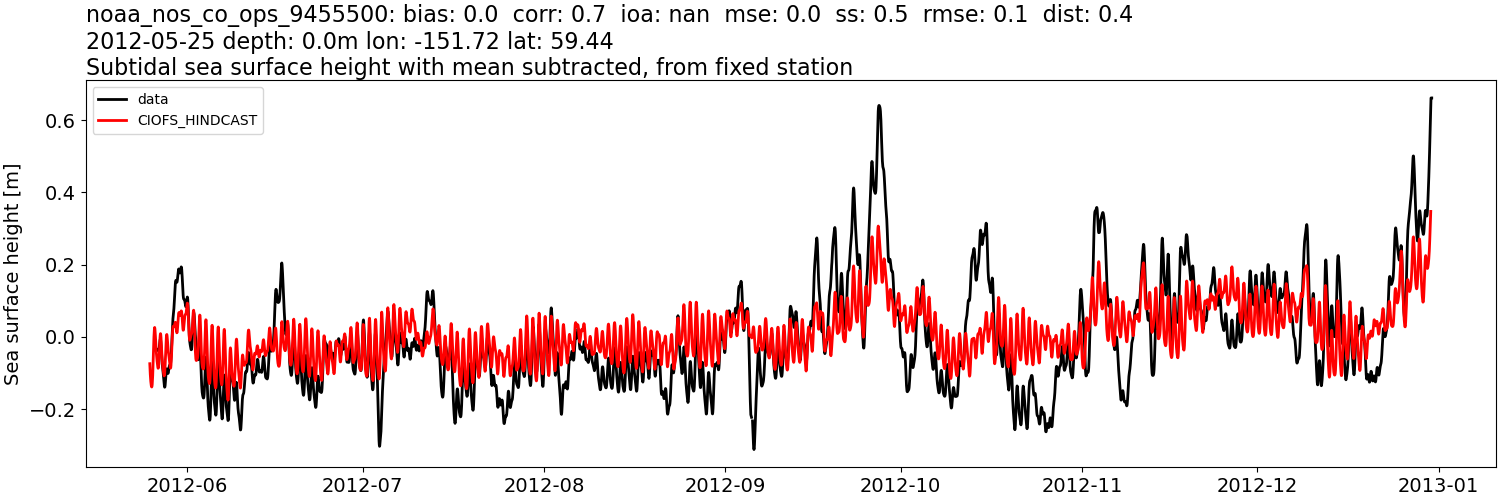
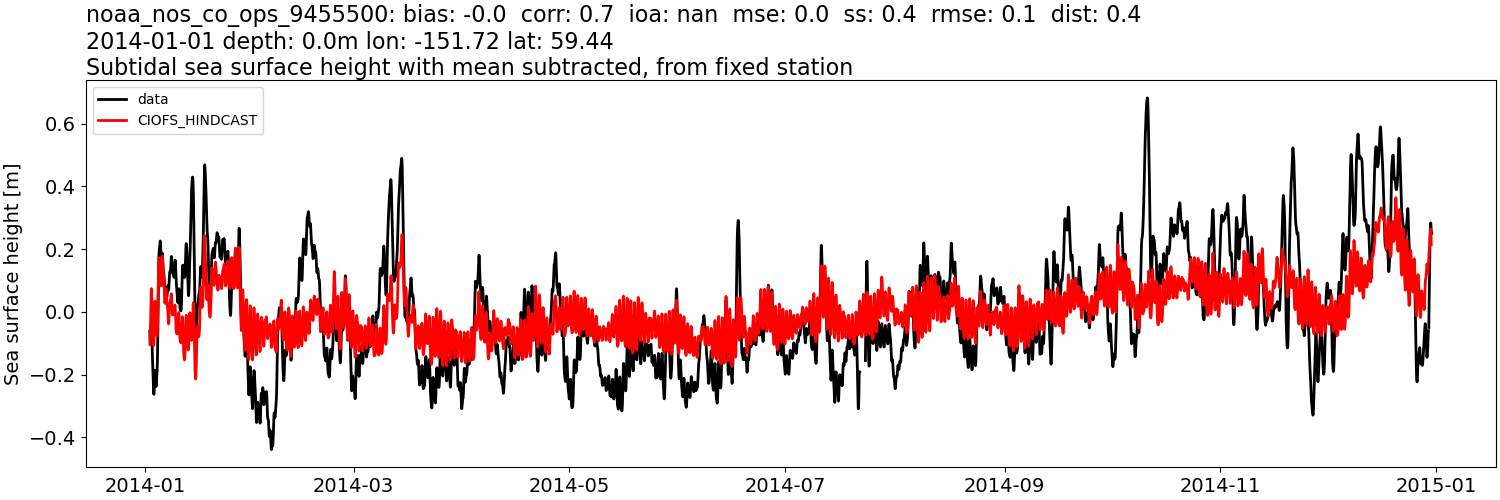
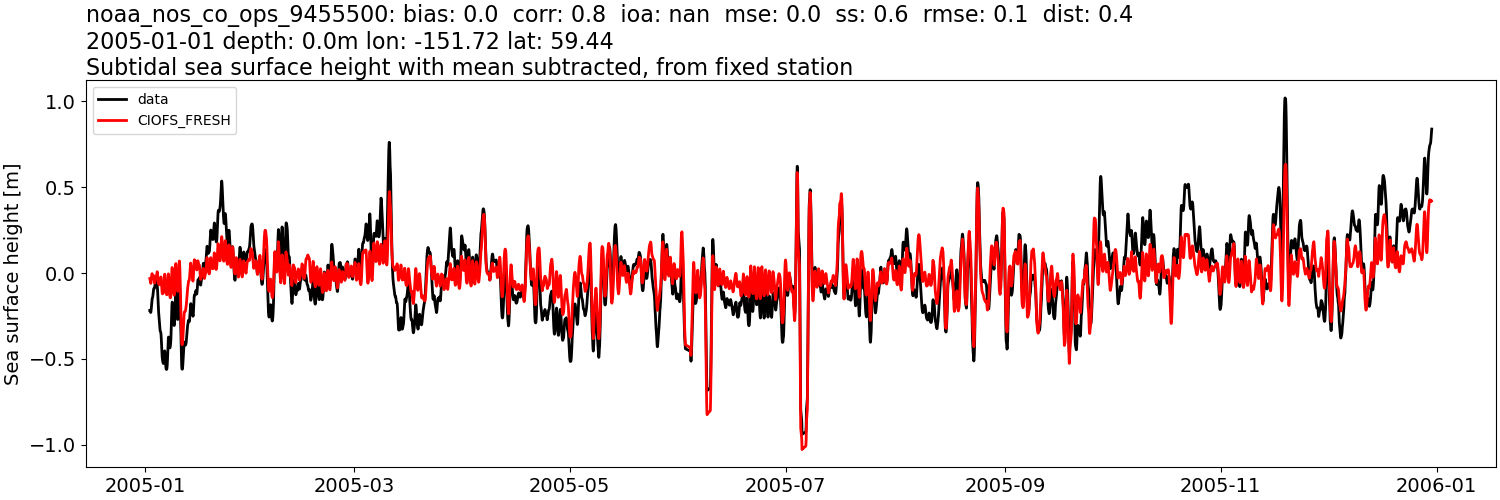
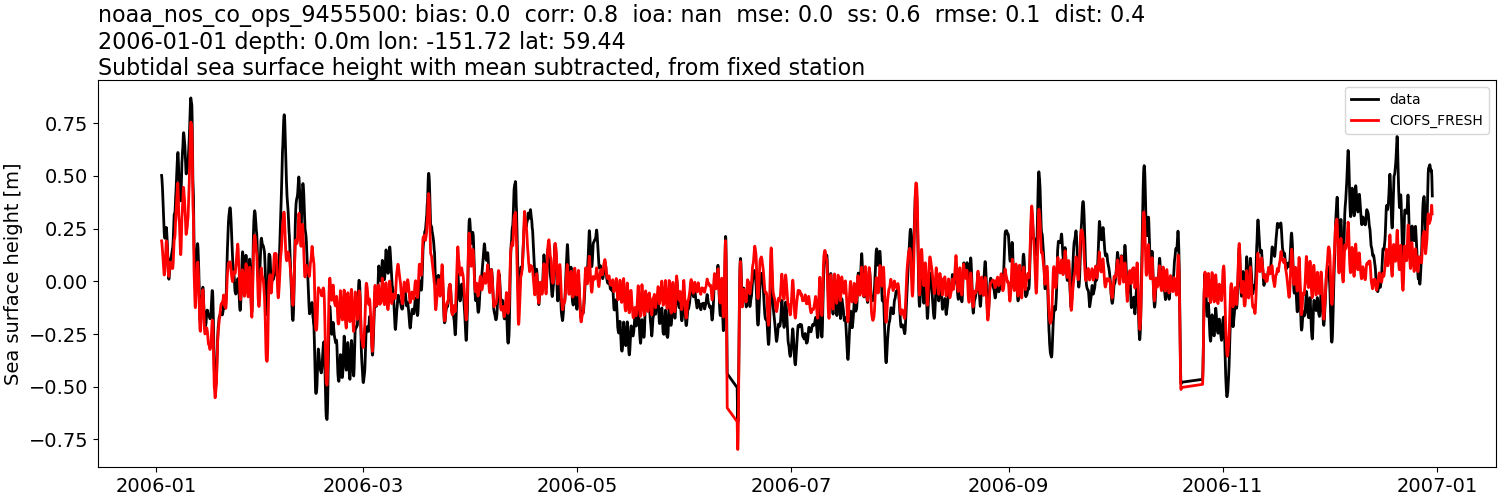
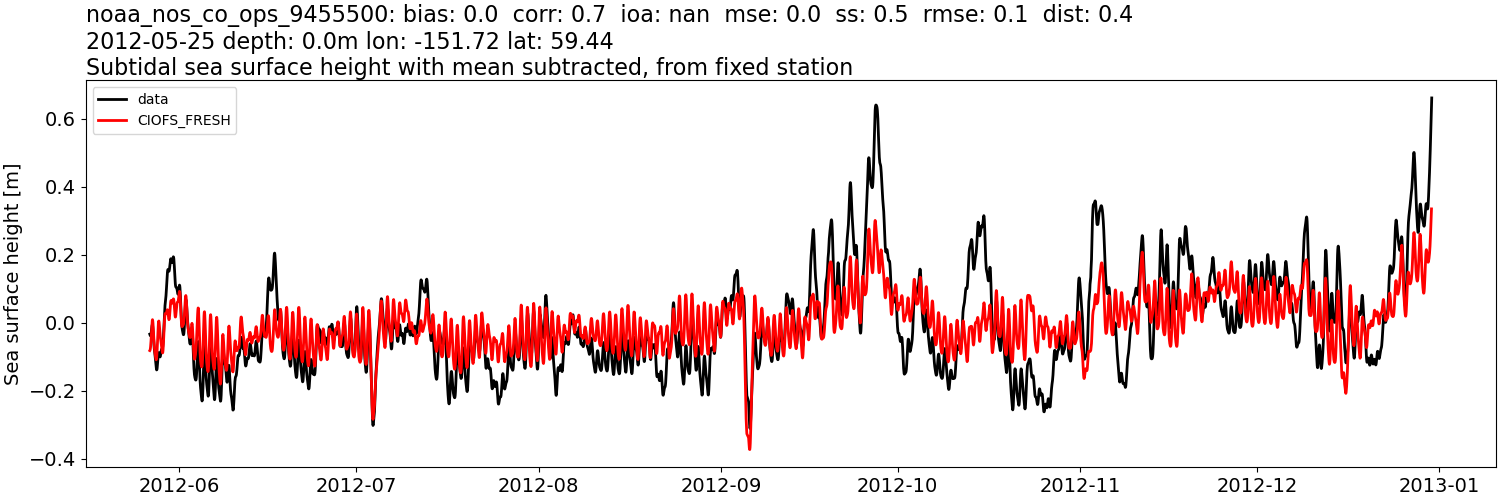
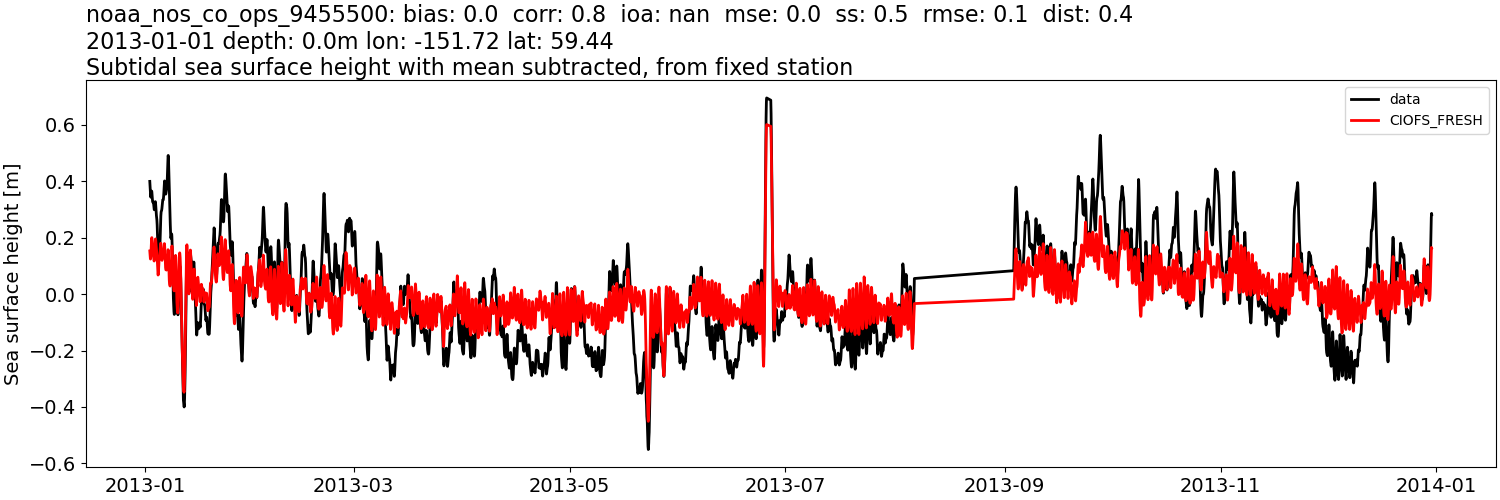
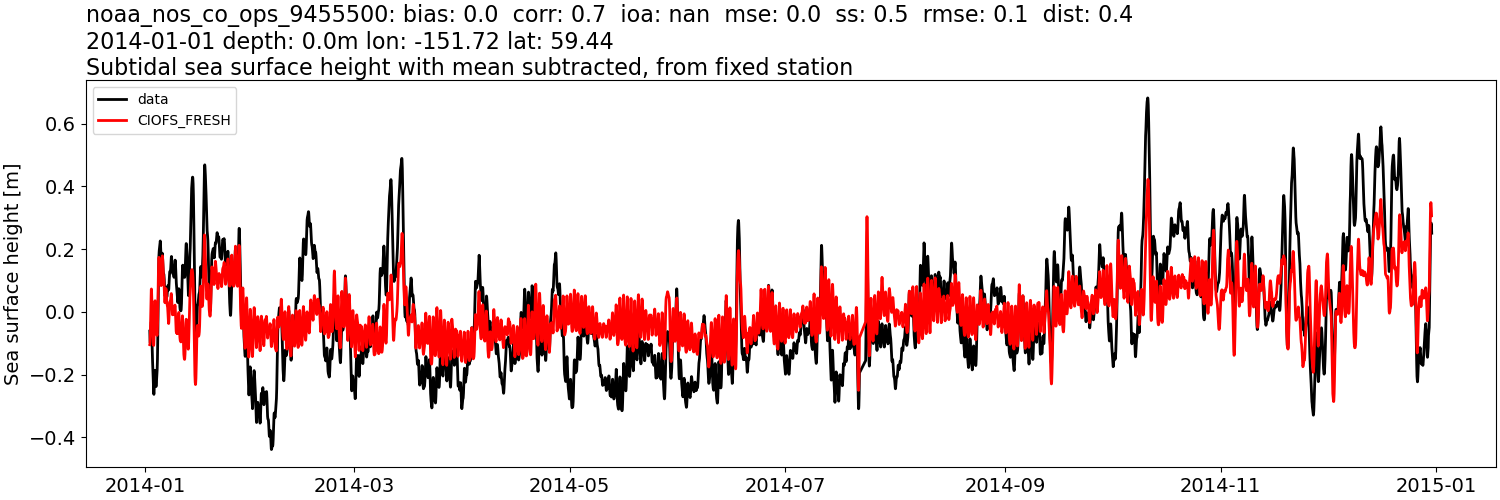
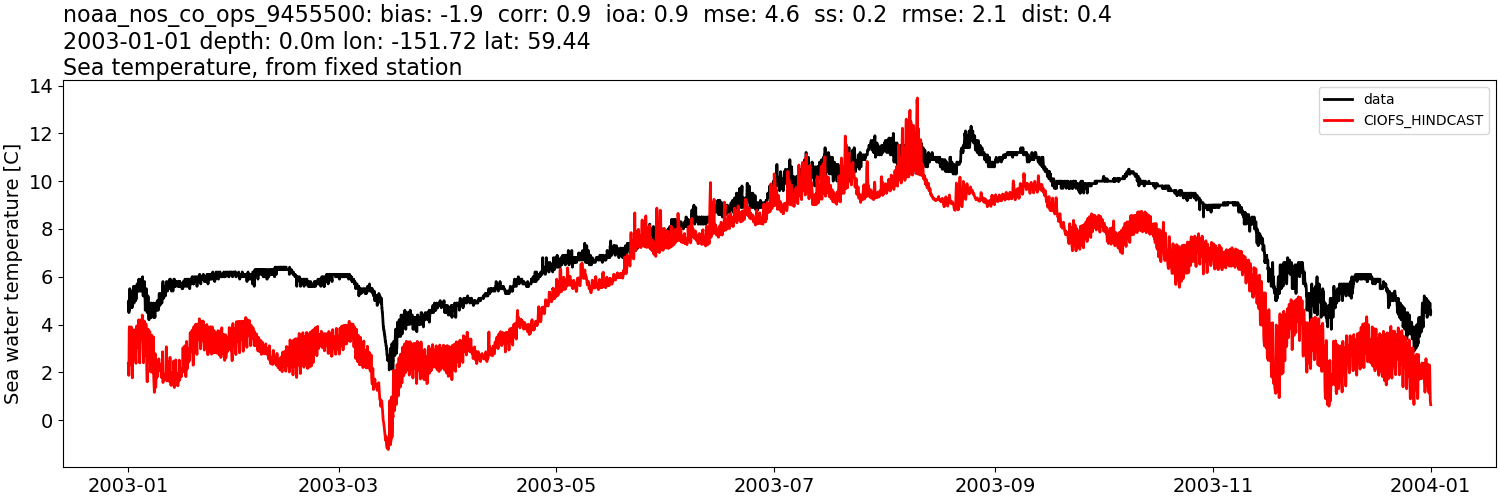
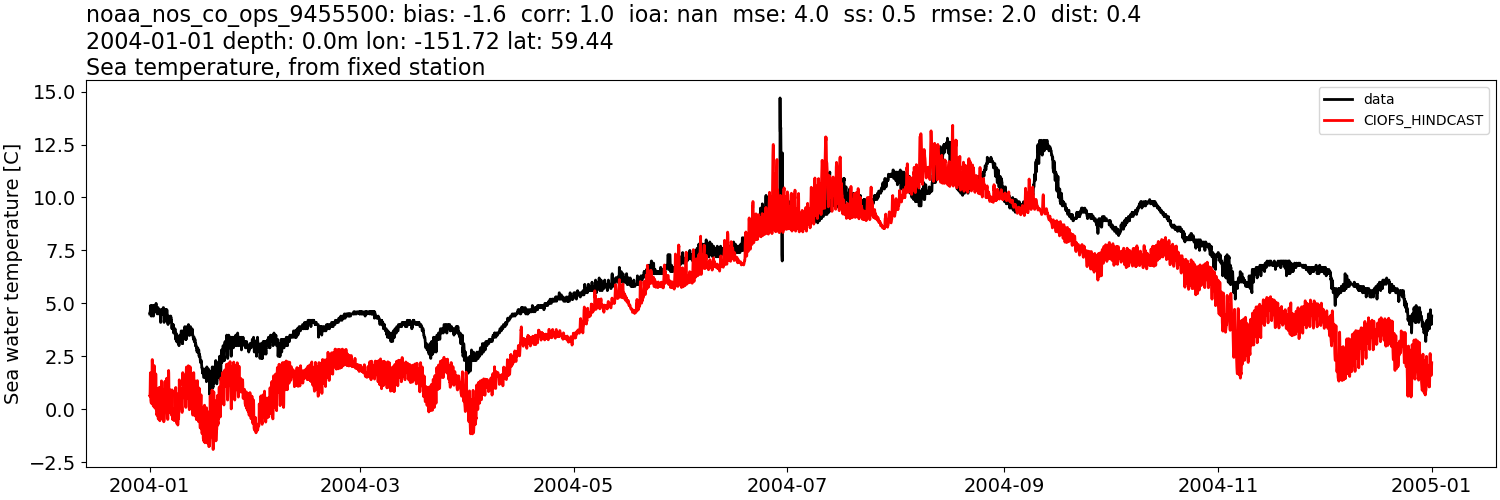
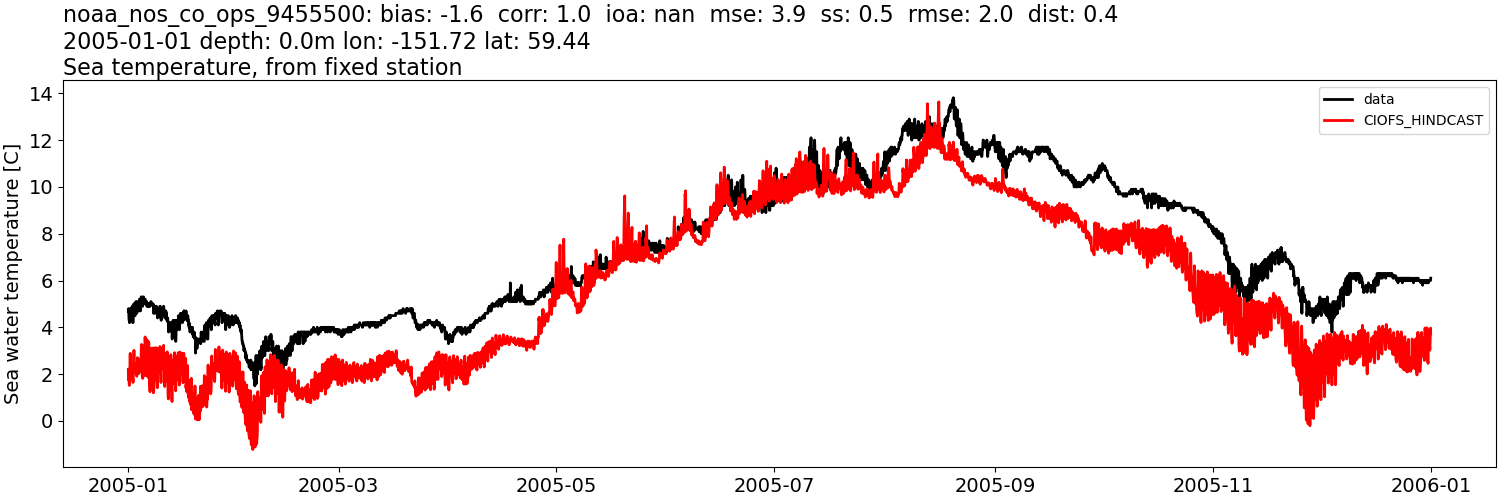
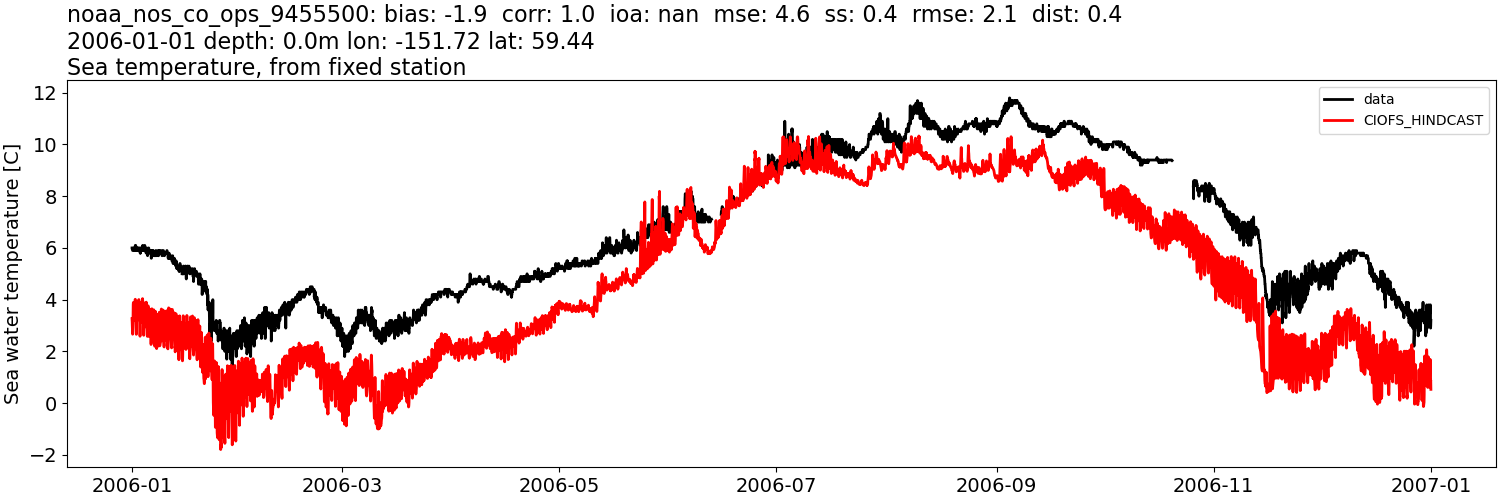
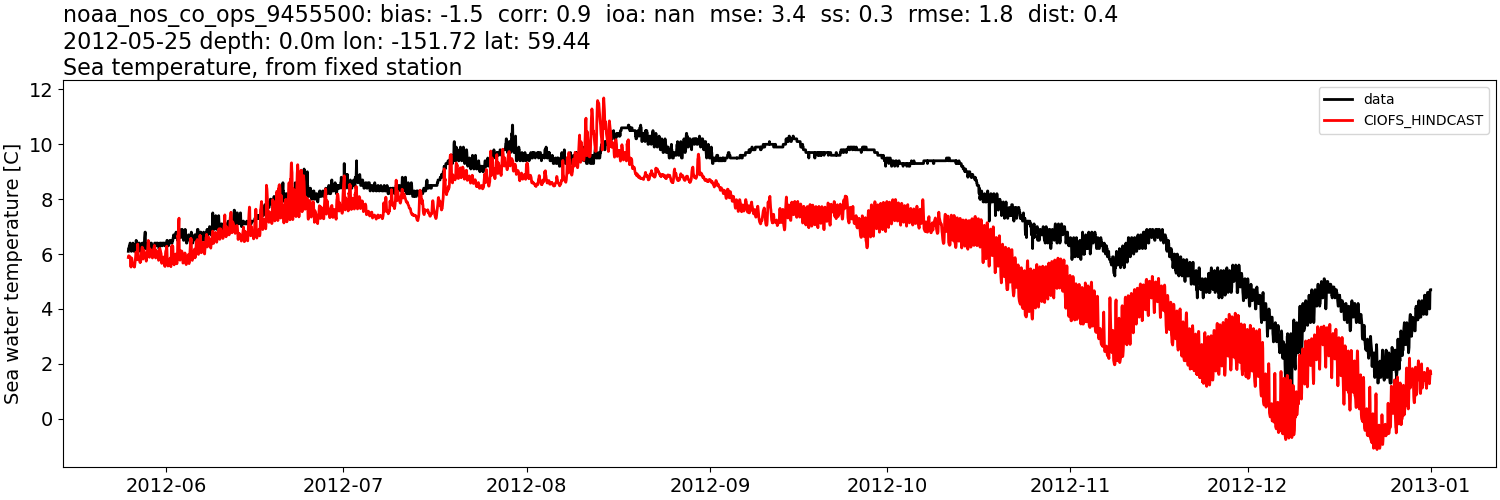
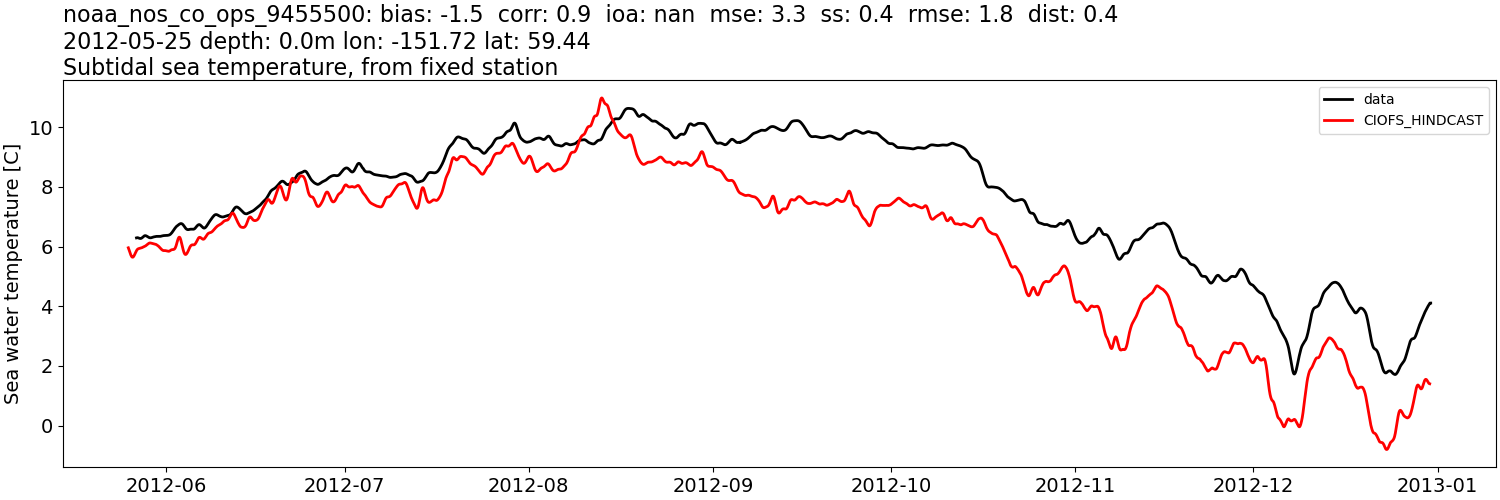
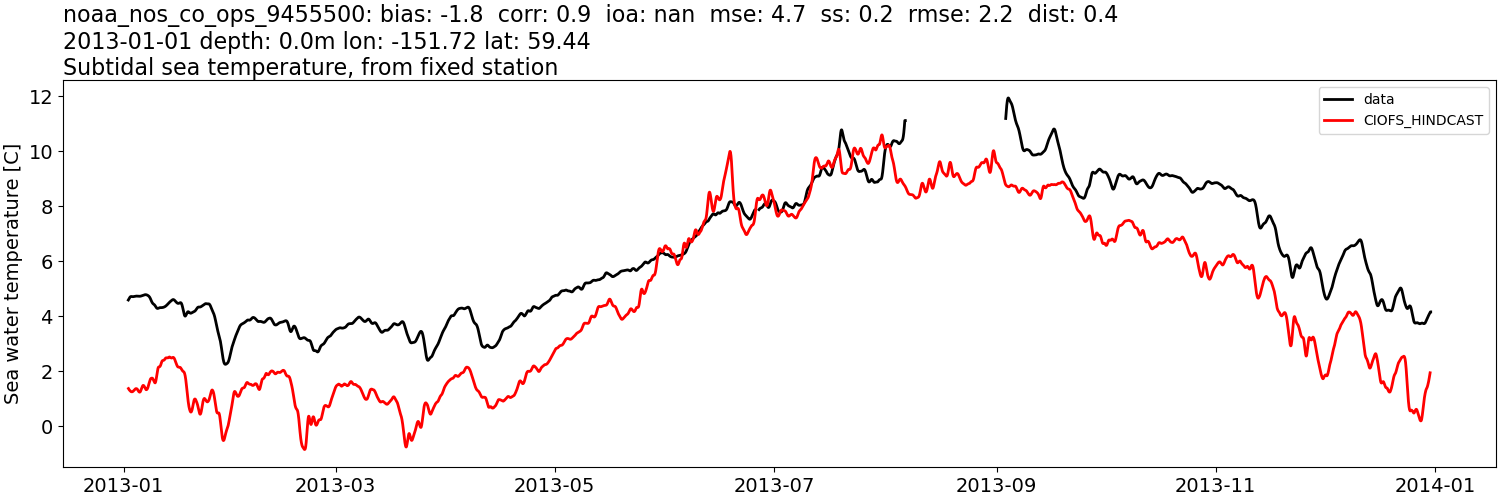
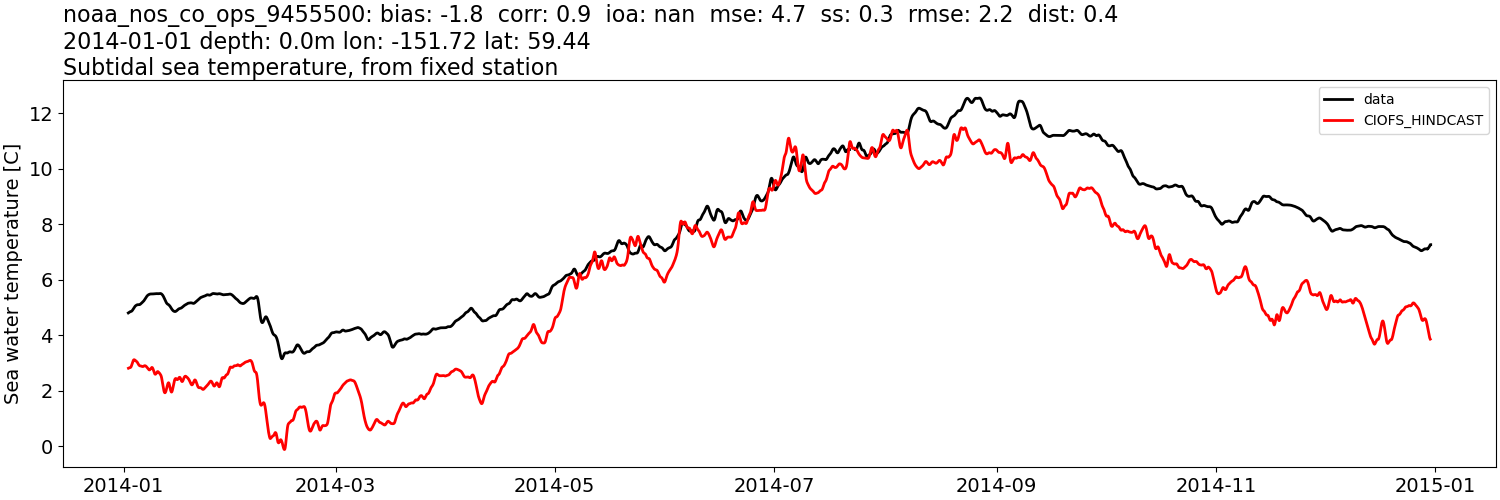
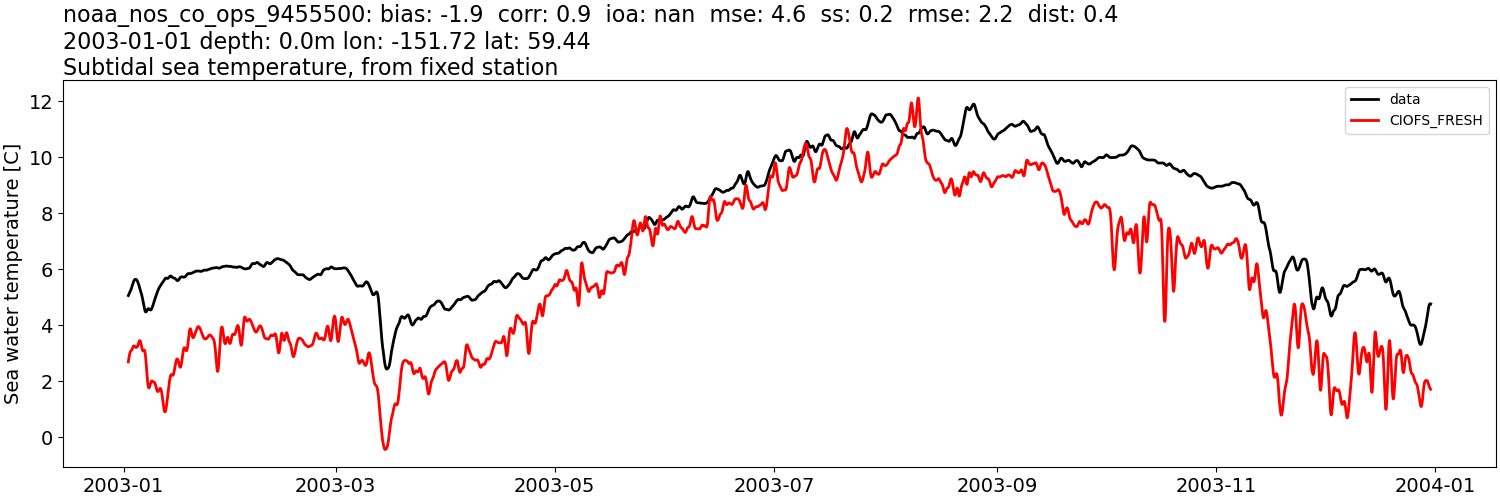
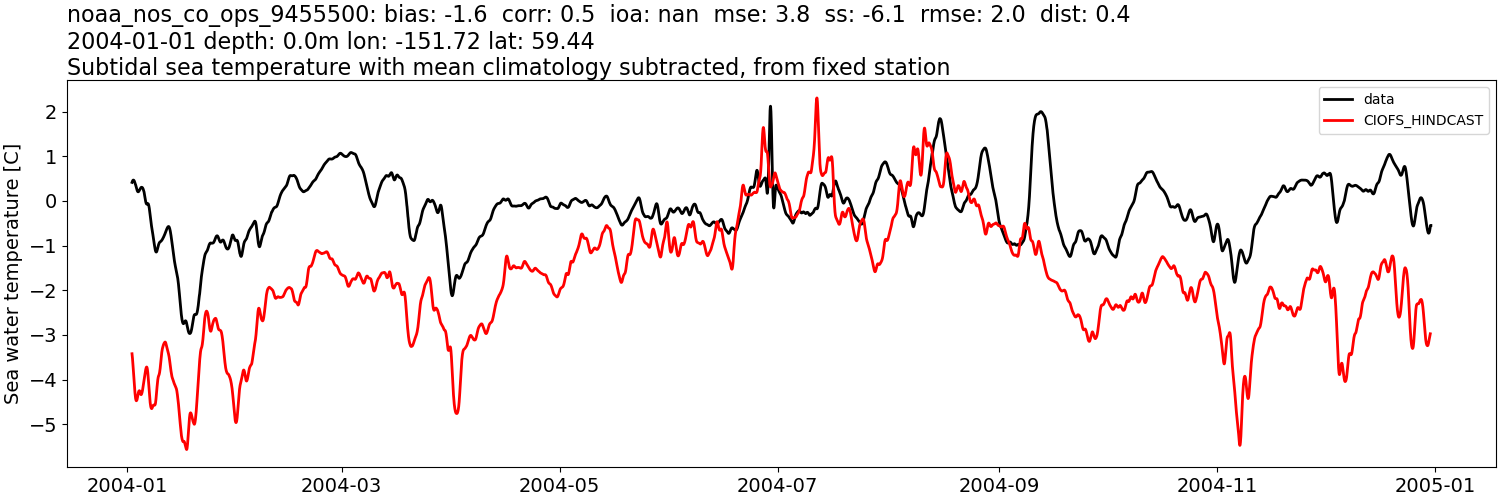
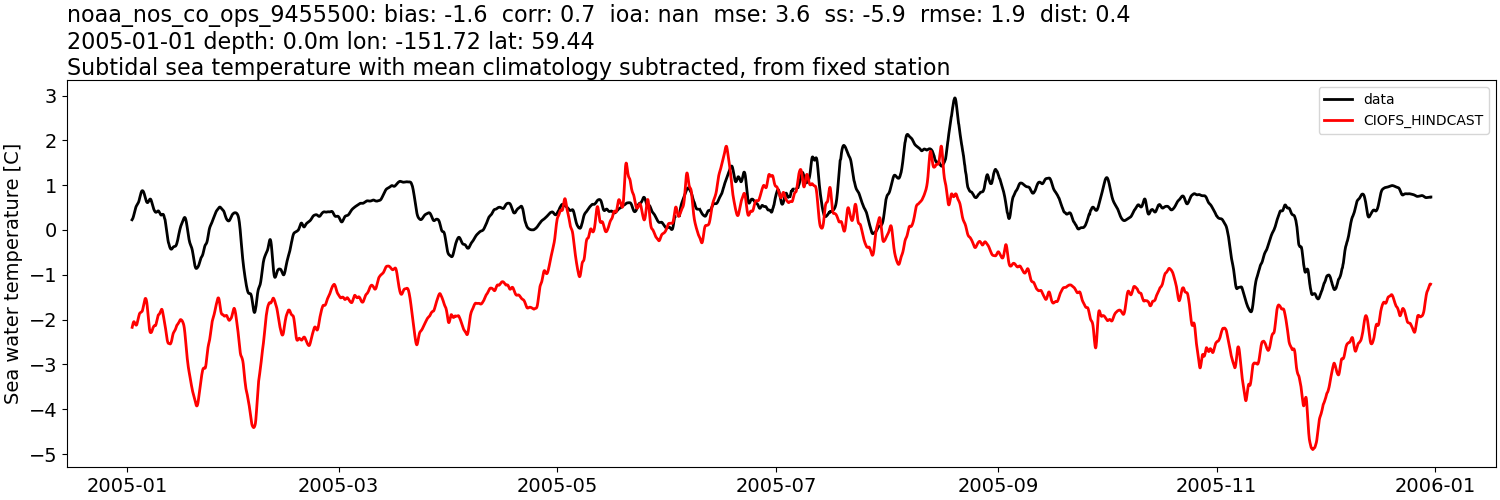
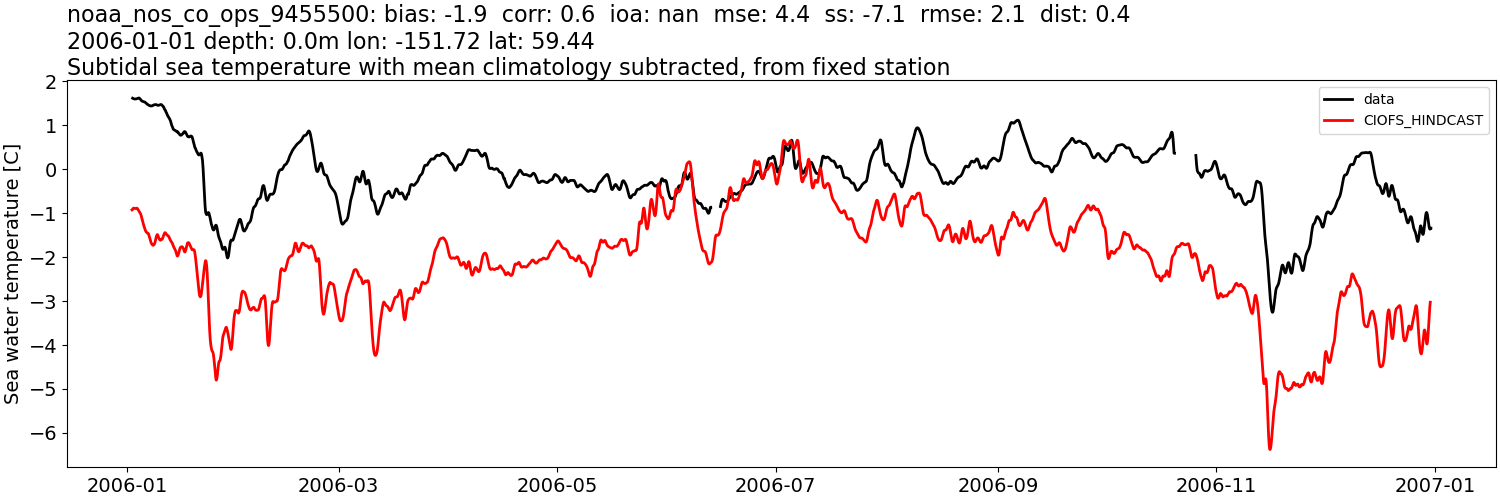
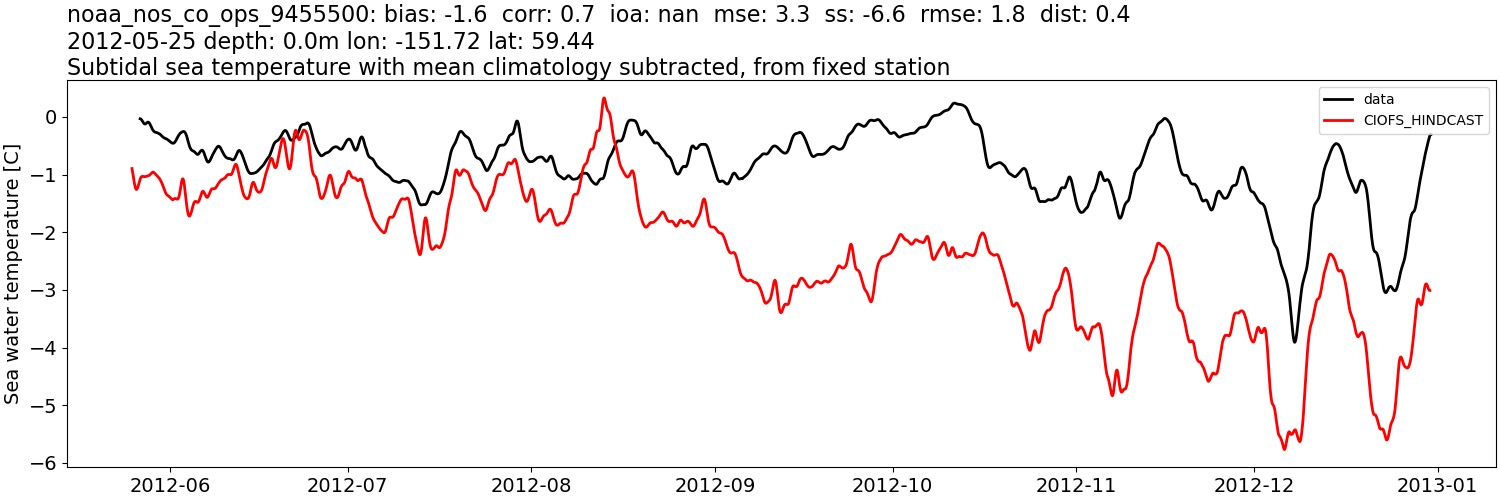
noaa_nos_co_ops_9455500#
Sea surface height: mean subtracted#
CIOFS_HINDCAST#
Comparison plots by year
2003
2004

2005
2006
2012
2013
2014
CIOFS_FRESH#
Comparison plots by year
2003
2004
2005
2006
2012
2013
2014

Sea surface height: mean subtracted, then tidally-filtered#
CIOFS_HINDCAST#
Comparison plots by year
2003
2004
2005
2006
2012
2013

2014
CIOFS_FRESH#
Comparison plots by year
2003

2004

2005
2006
2012
2013
2014
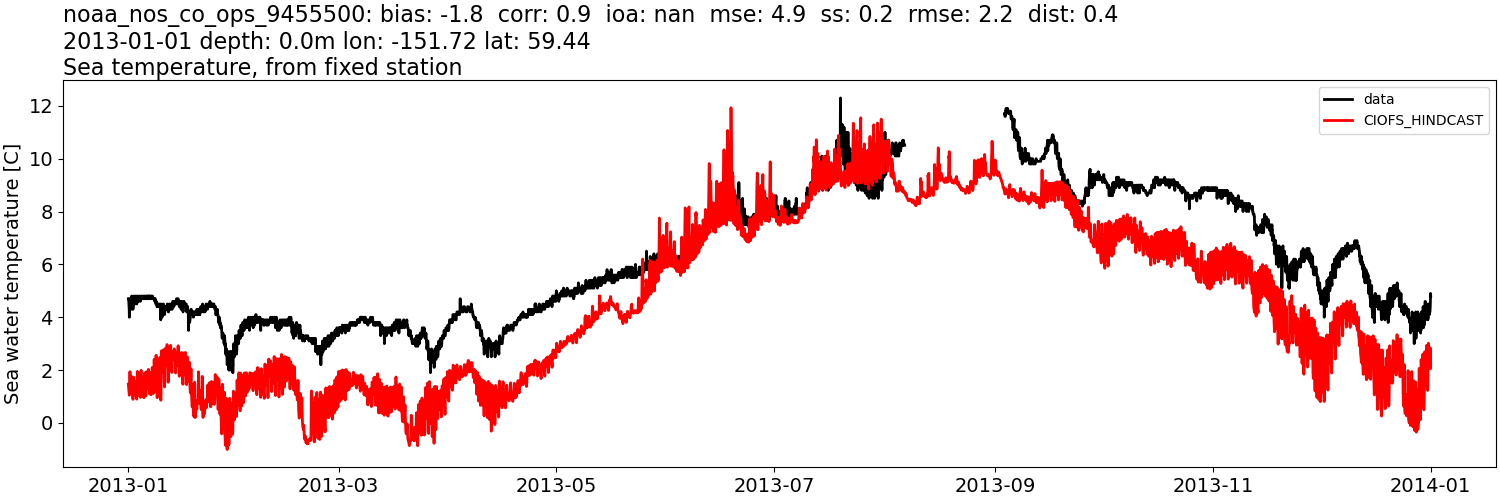
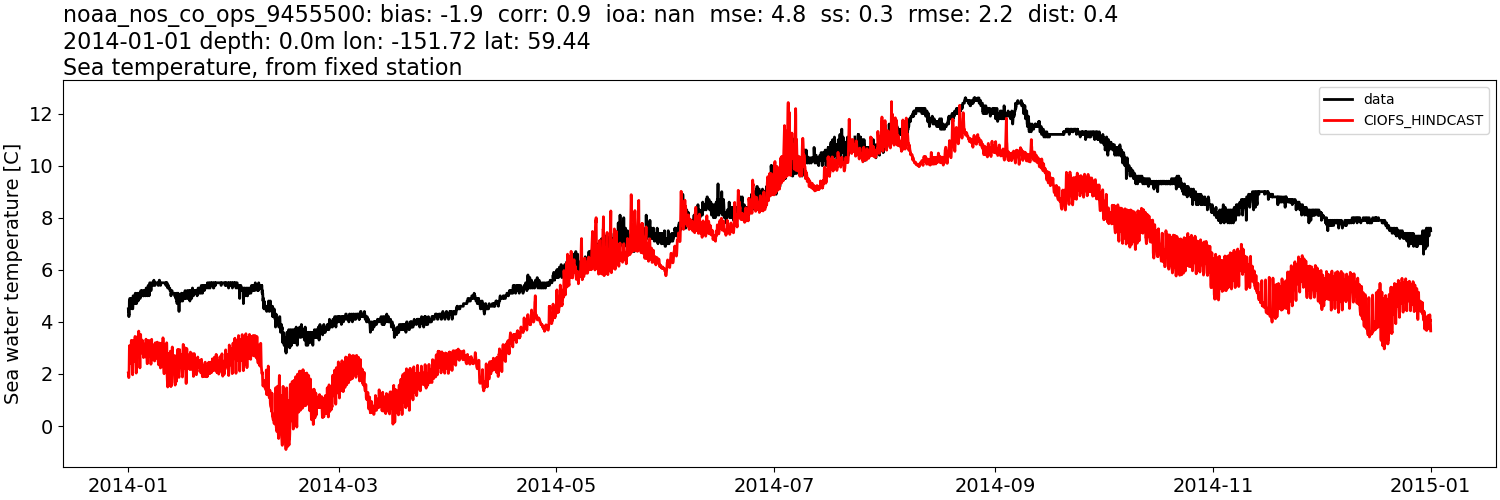
Sea water temperature:#
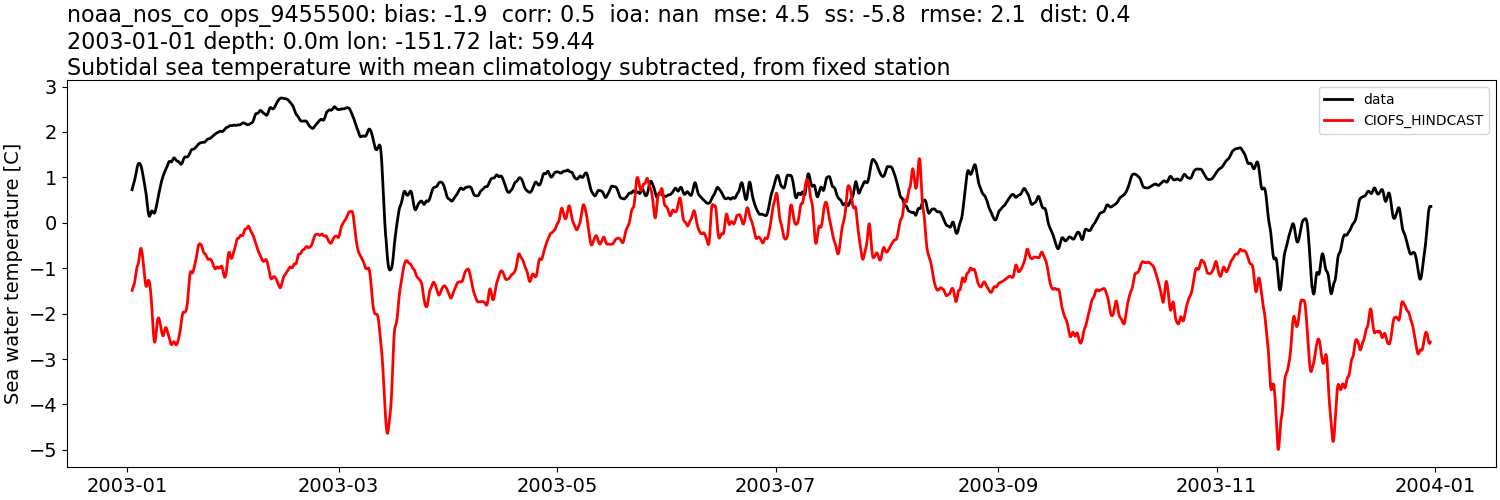
CIOFS_HINDCAST#
Comparison plots by year
2003
2004
2005
2006
2012
2013
2014
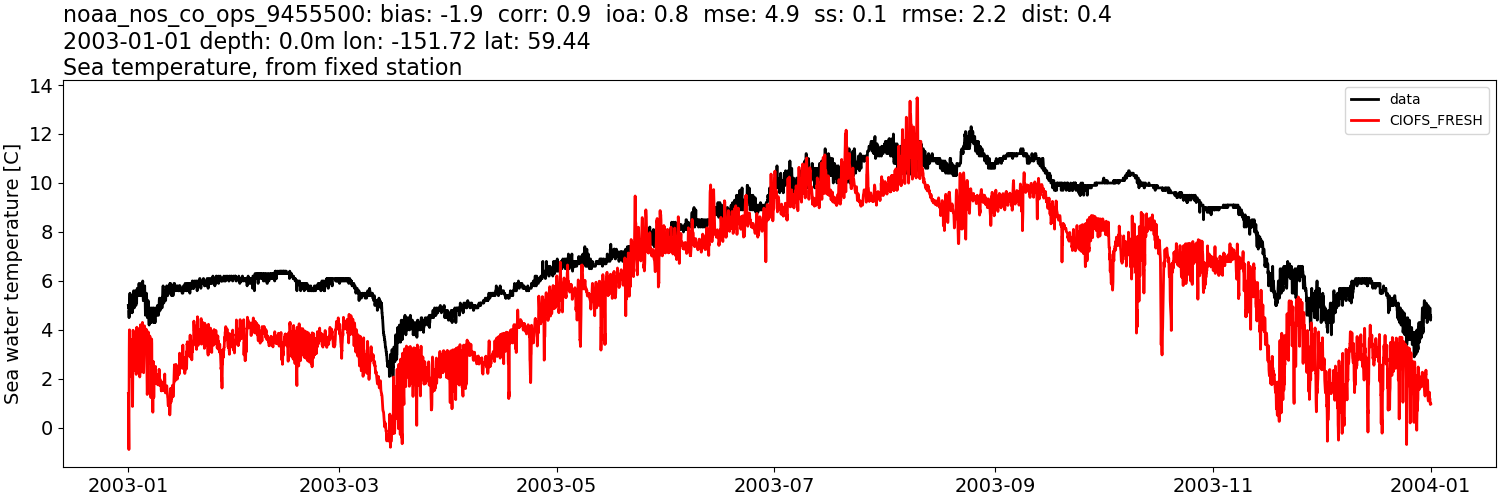
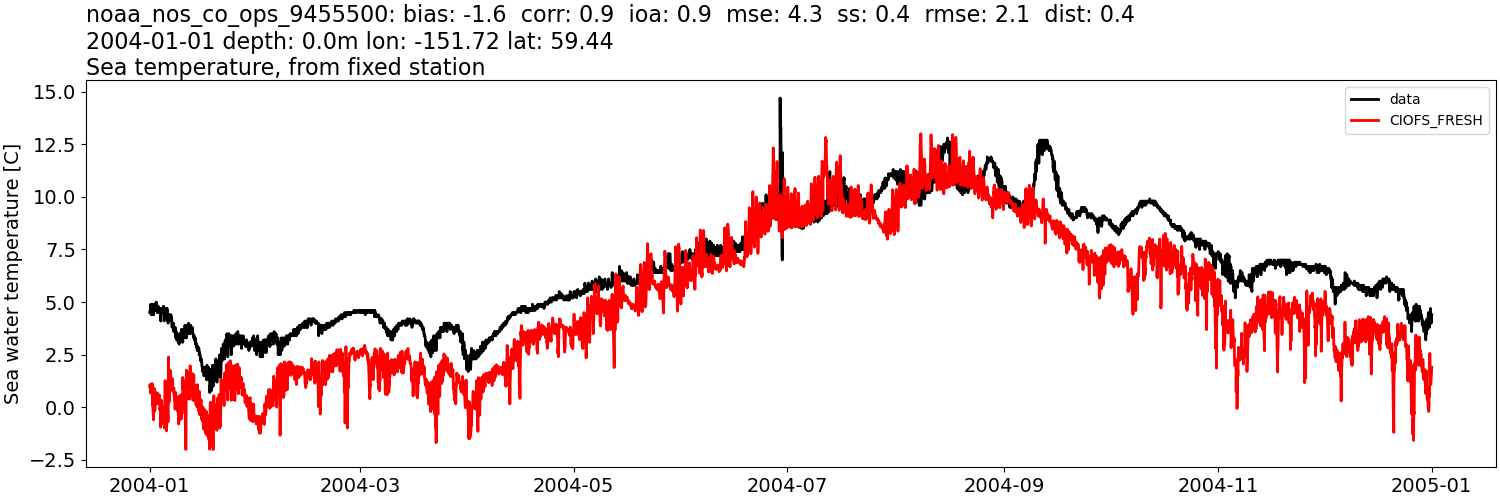
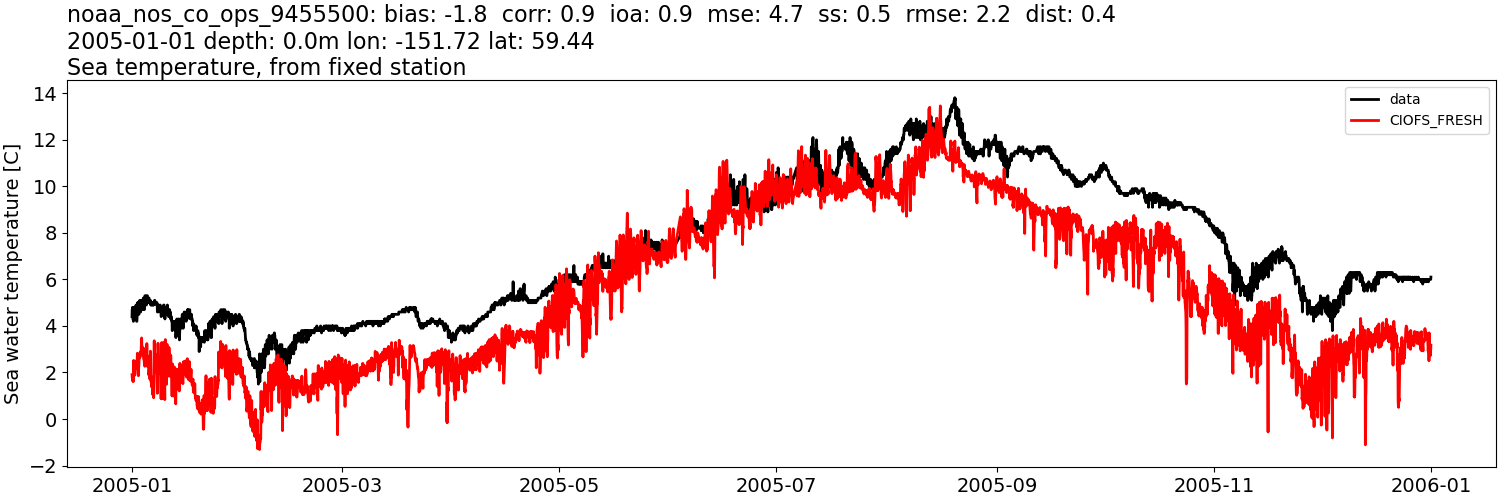
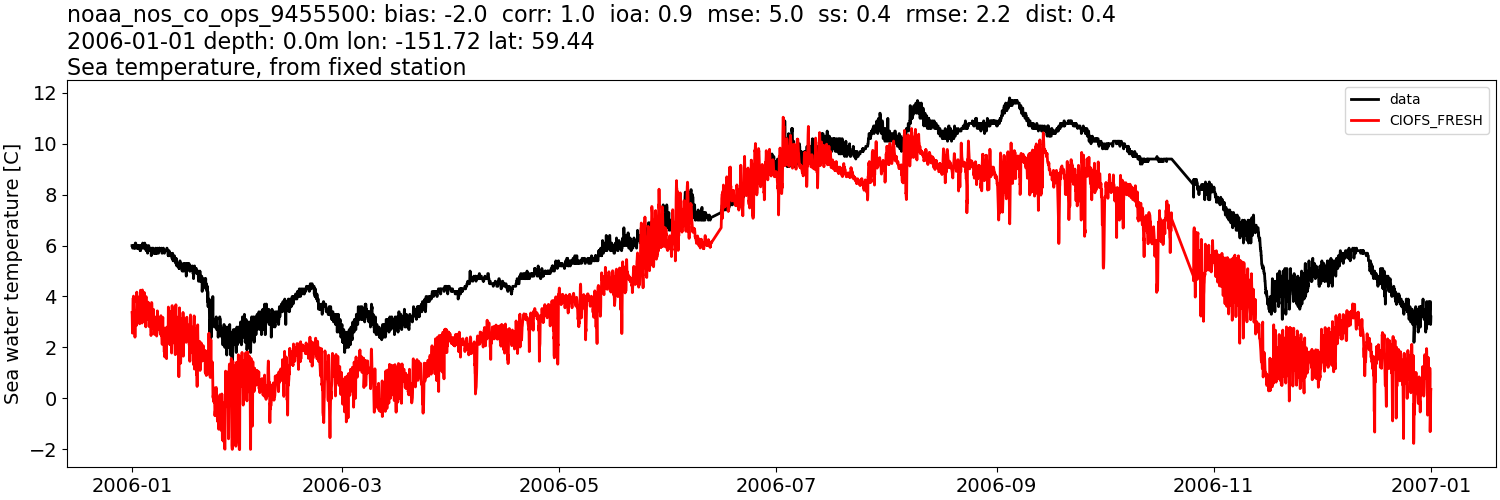
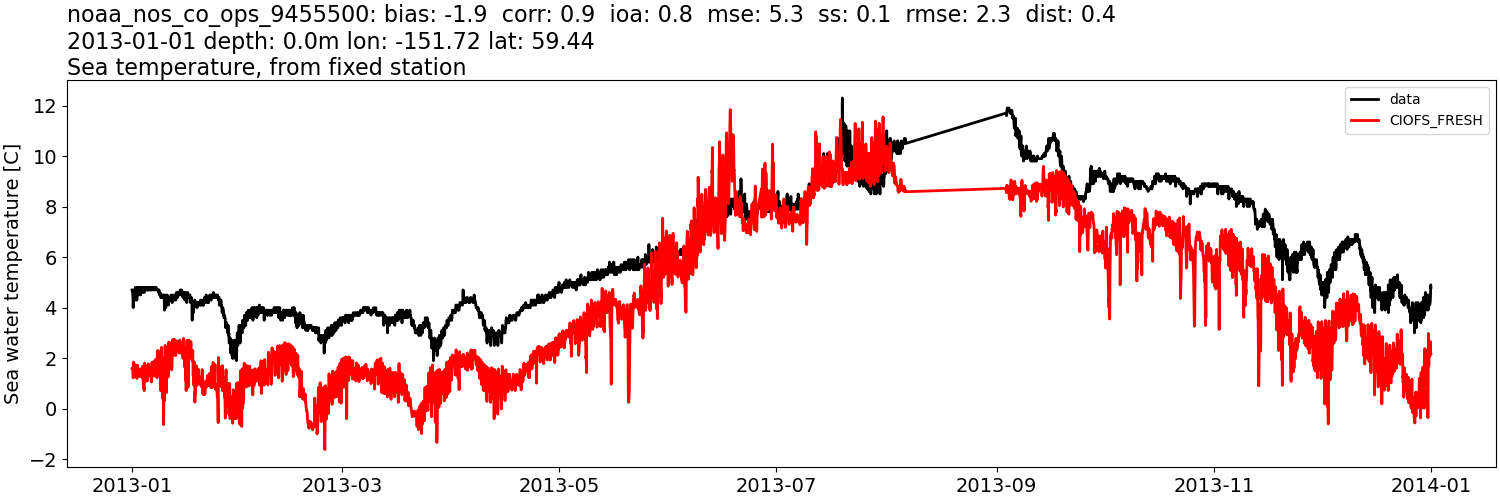
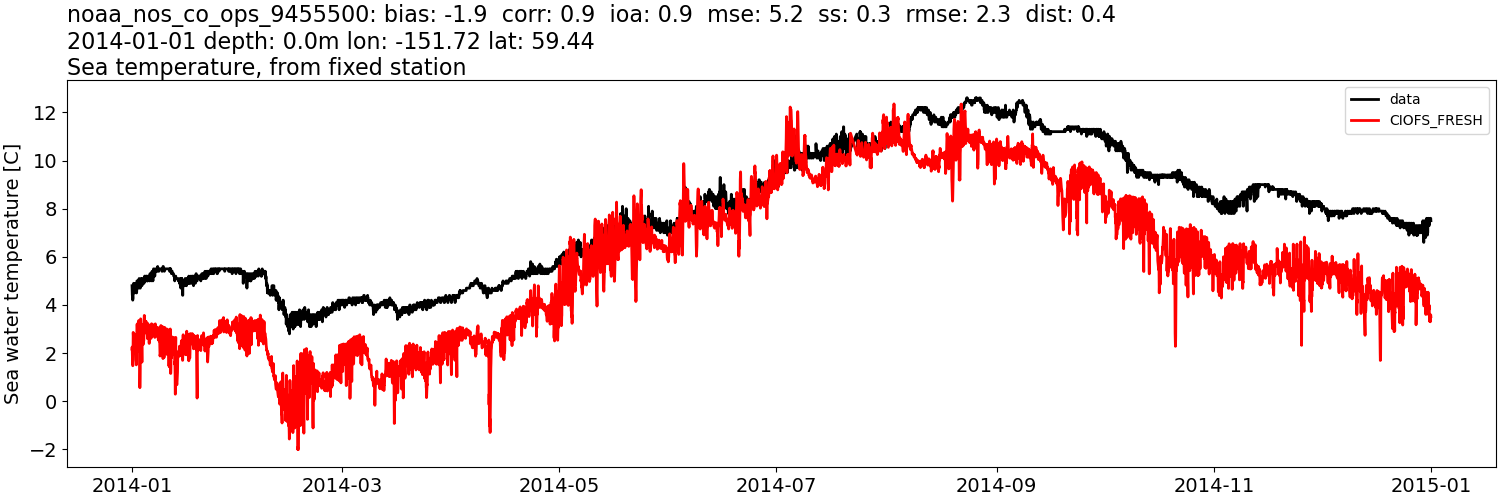
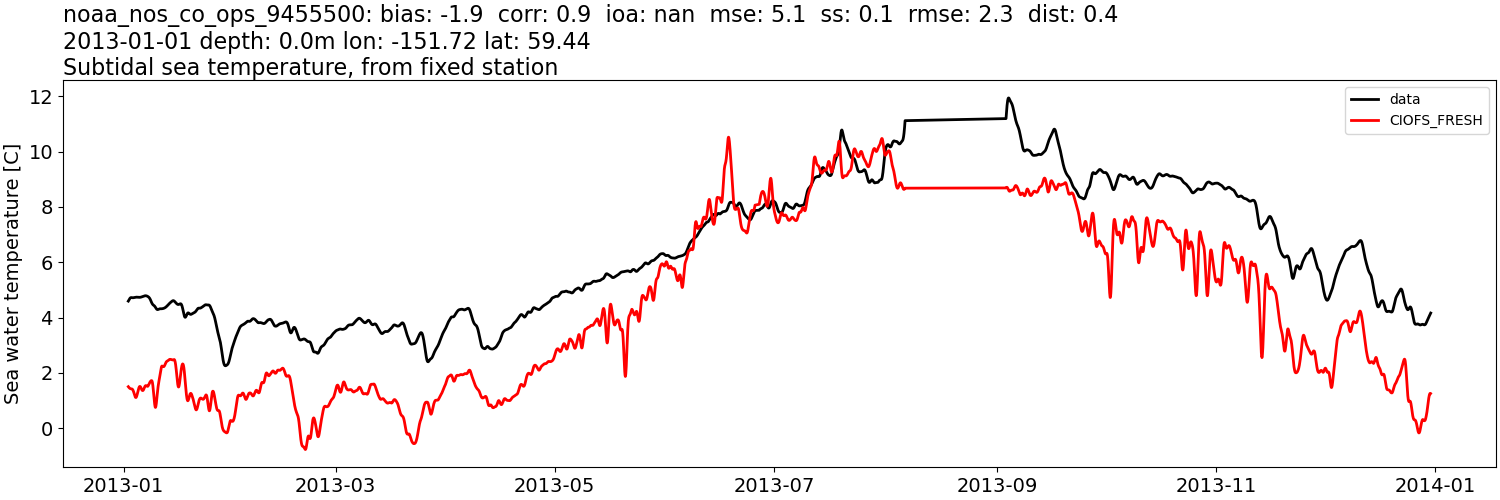
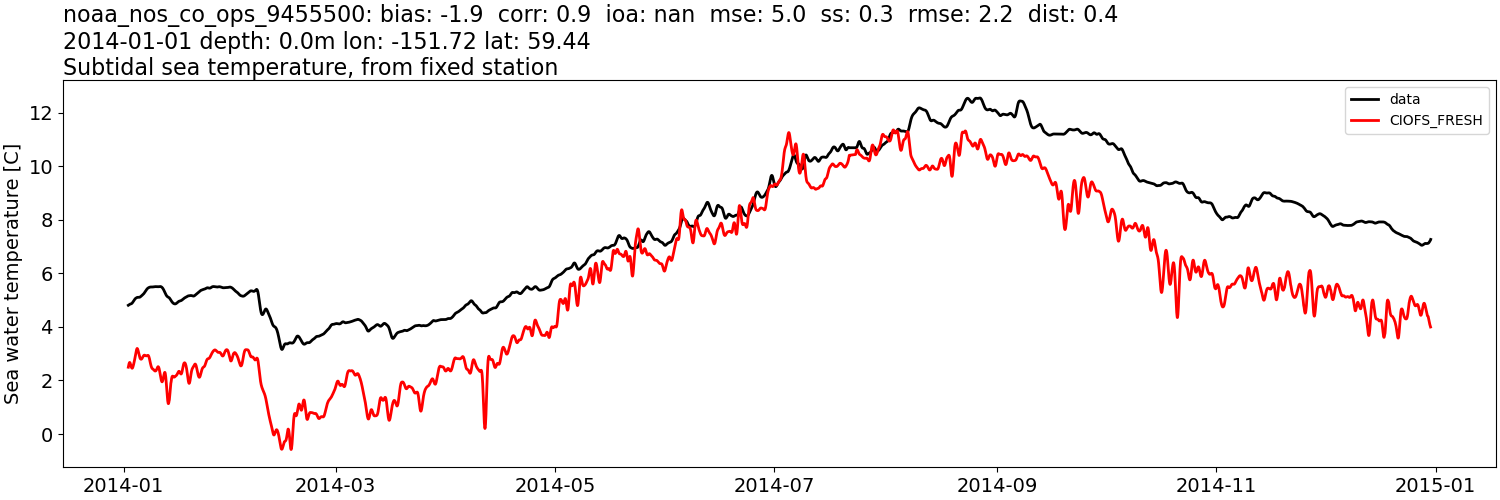
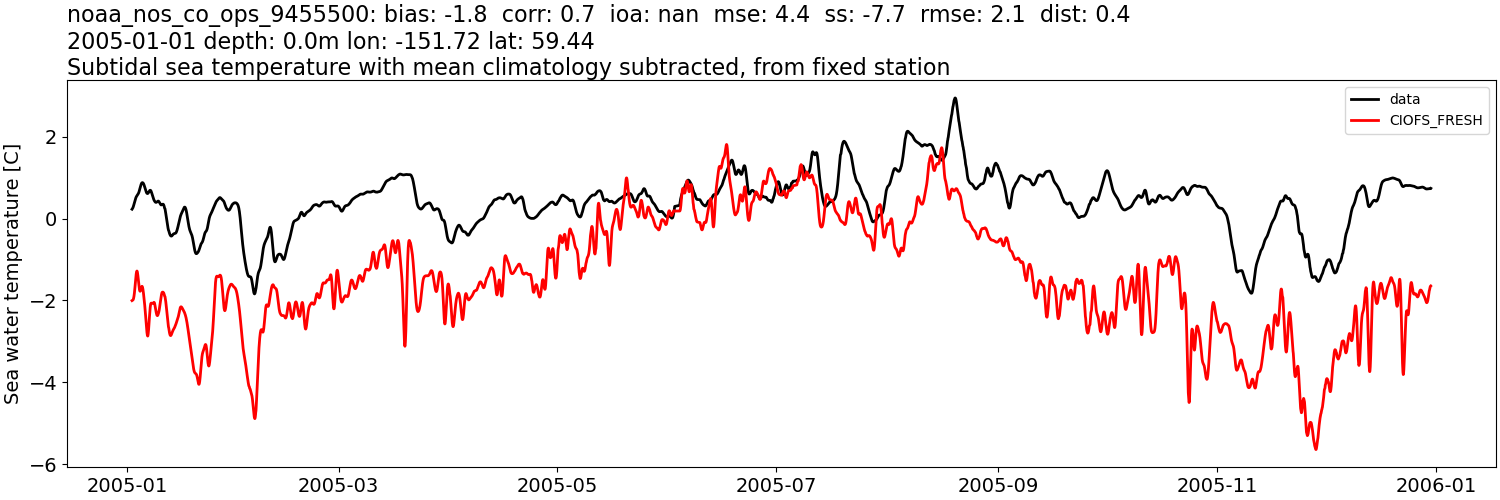
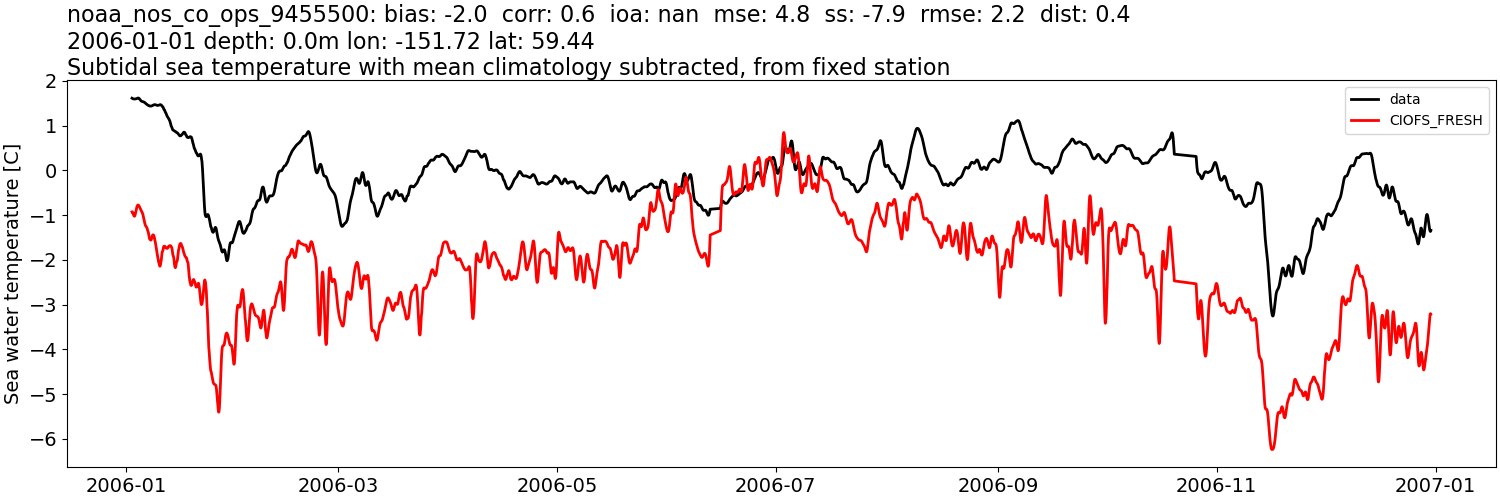
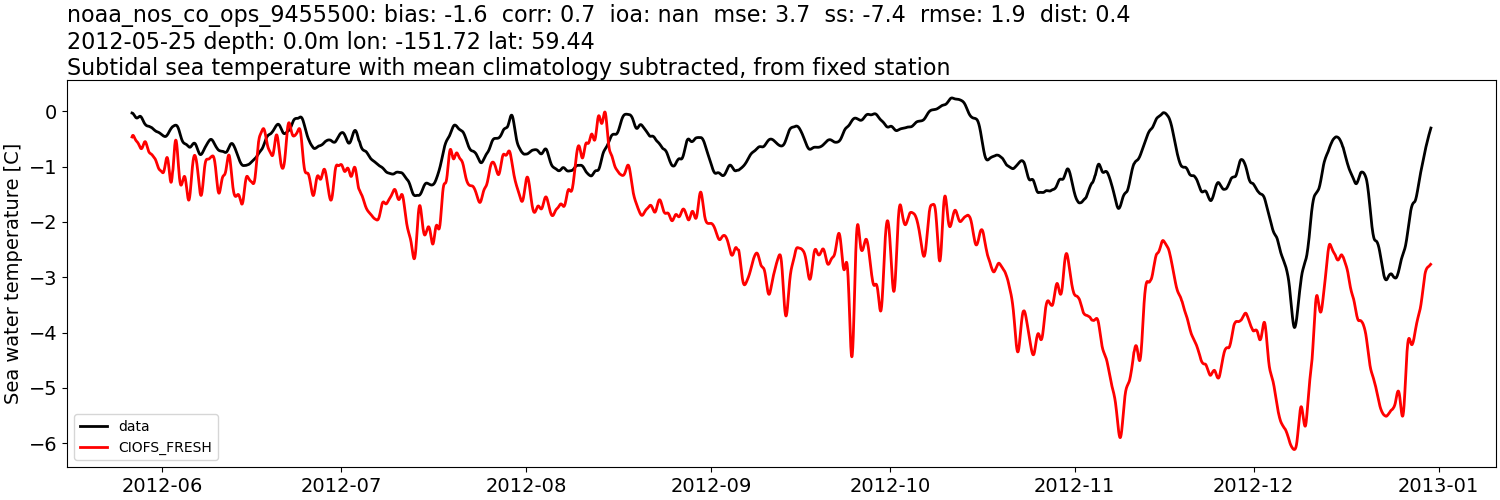
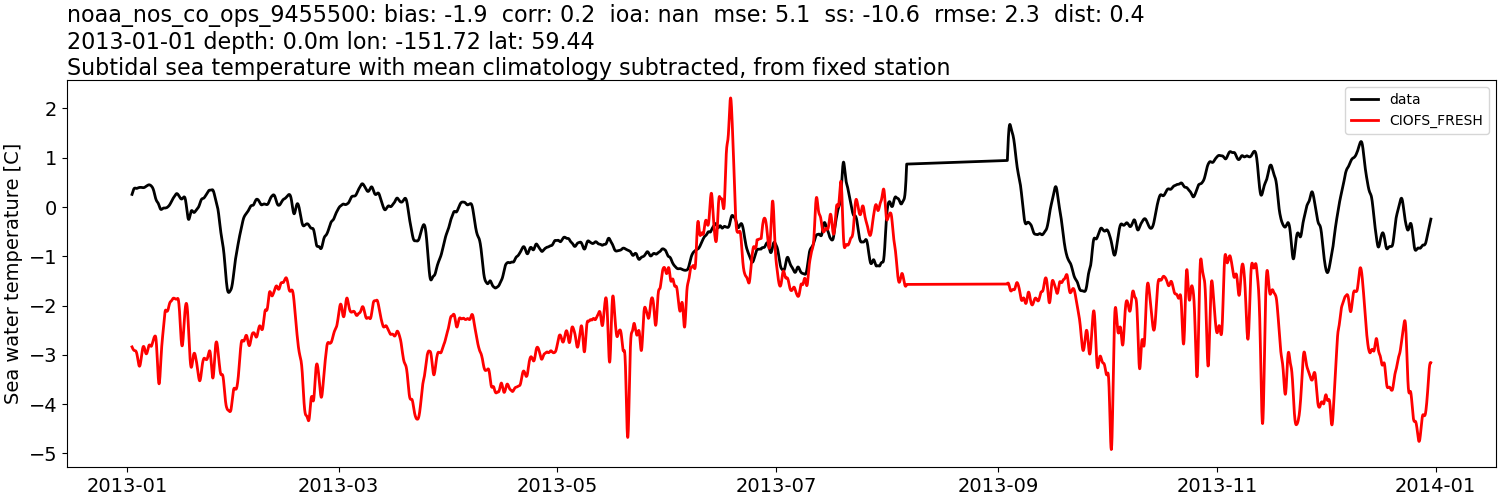
CIOFS_FRESH#
Comparison plots by year
2003
2004
2005
2006
2012

2013
2014
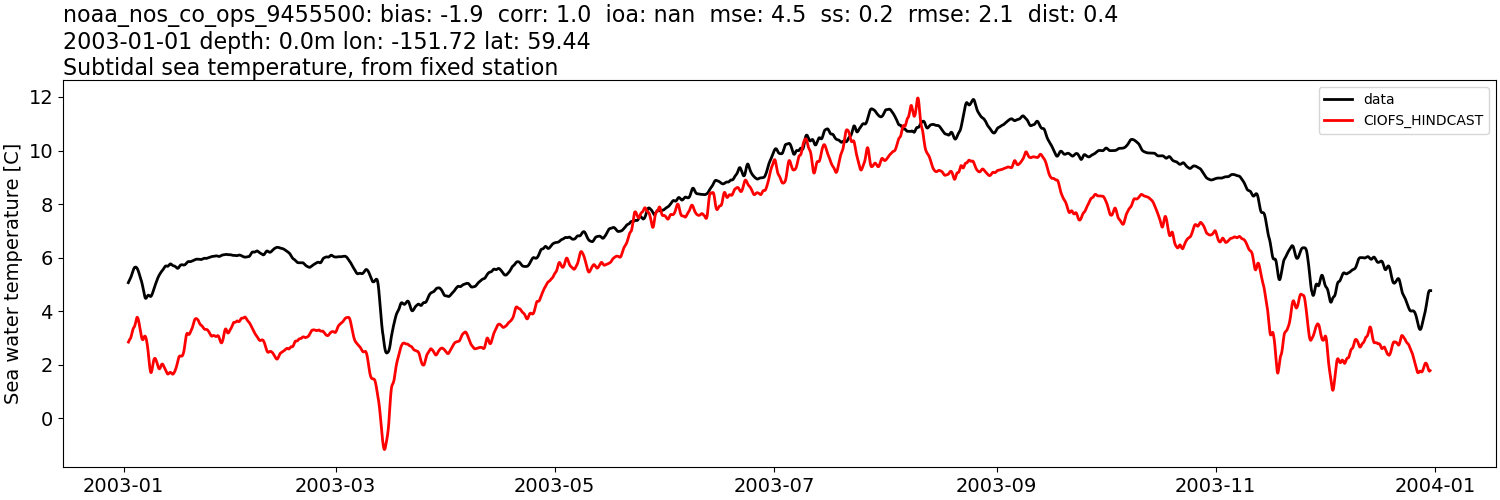
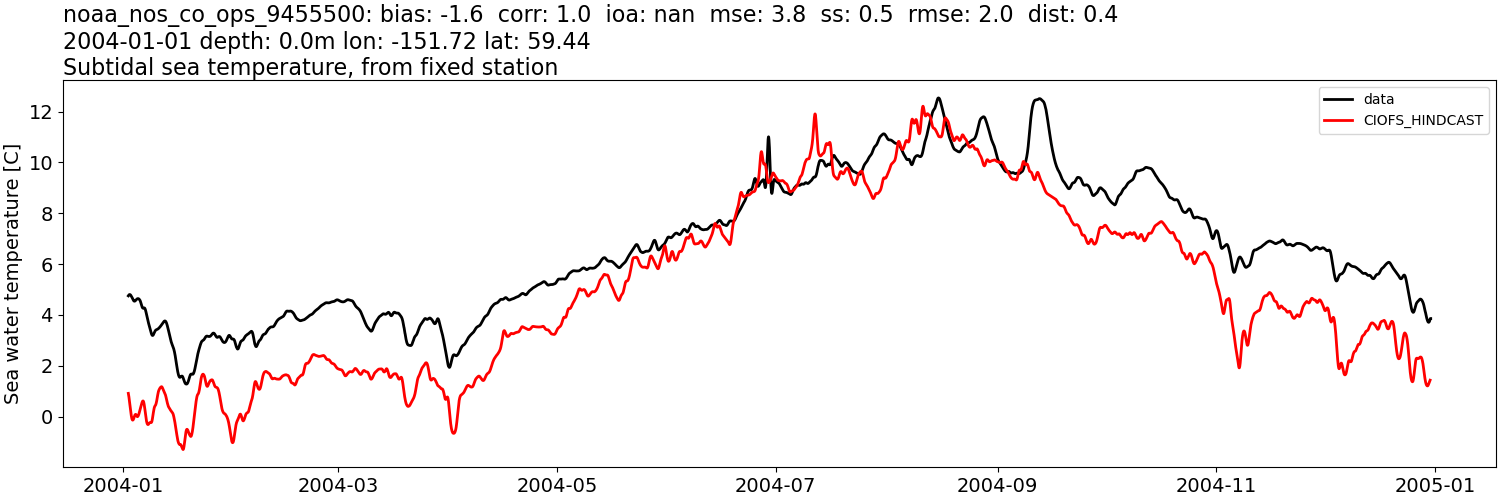
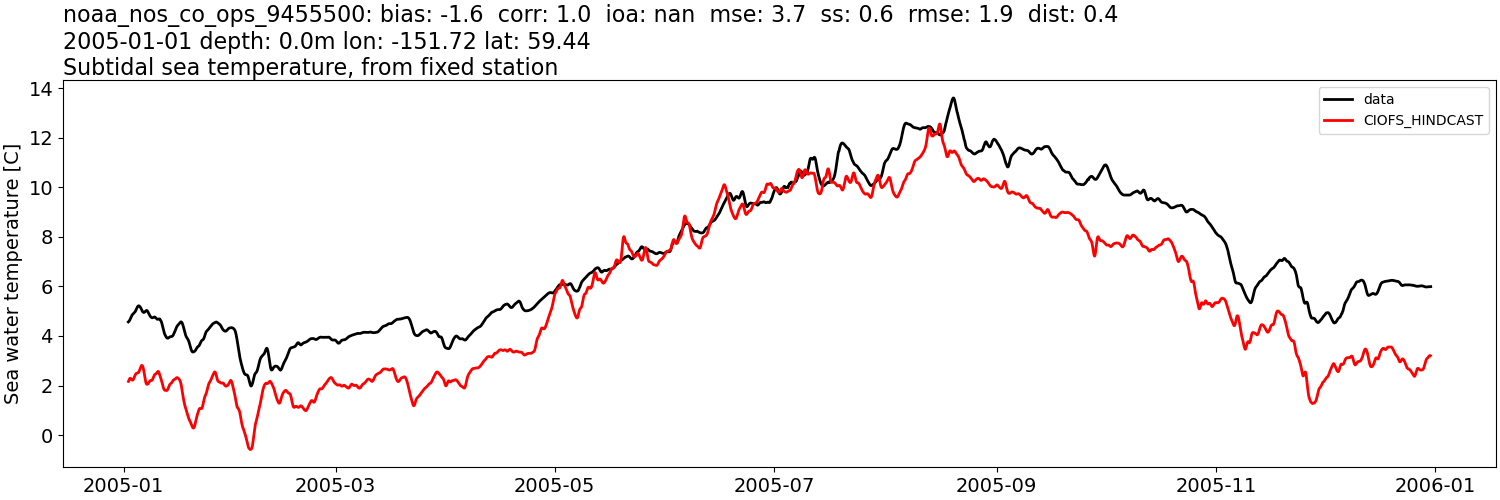
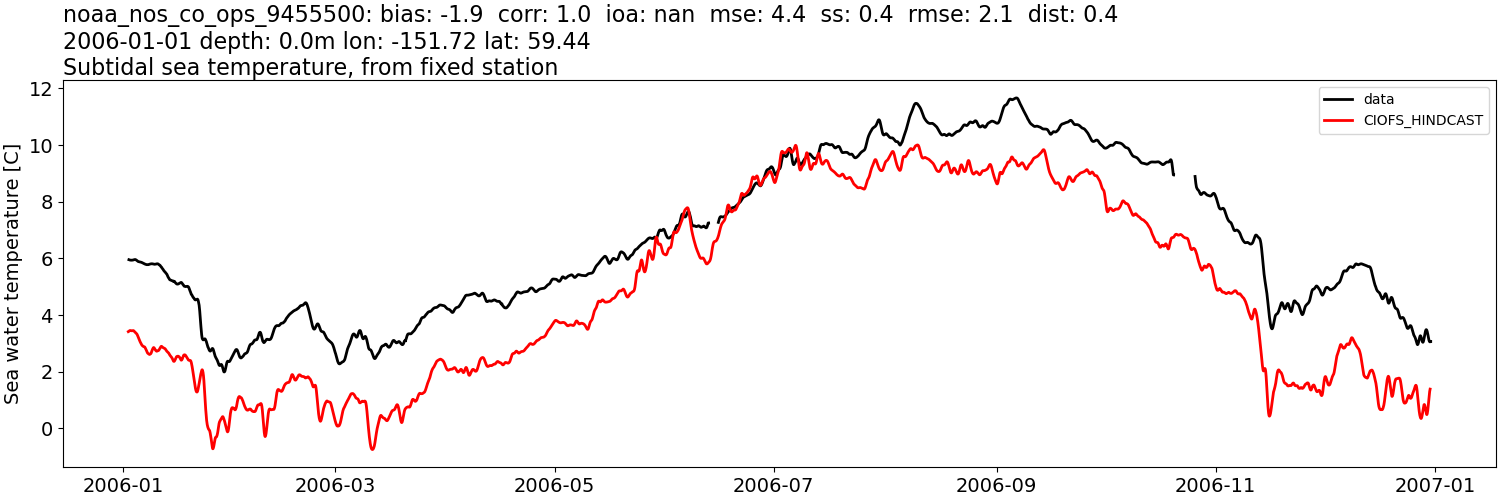
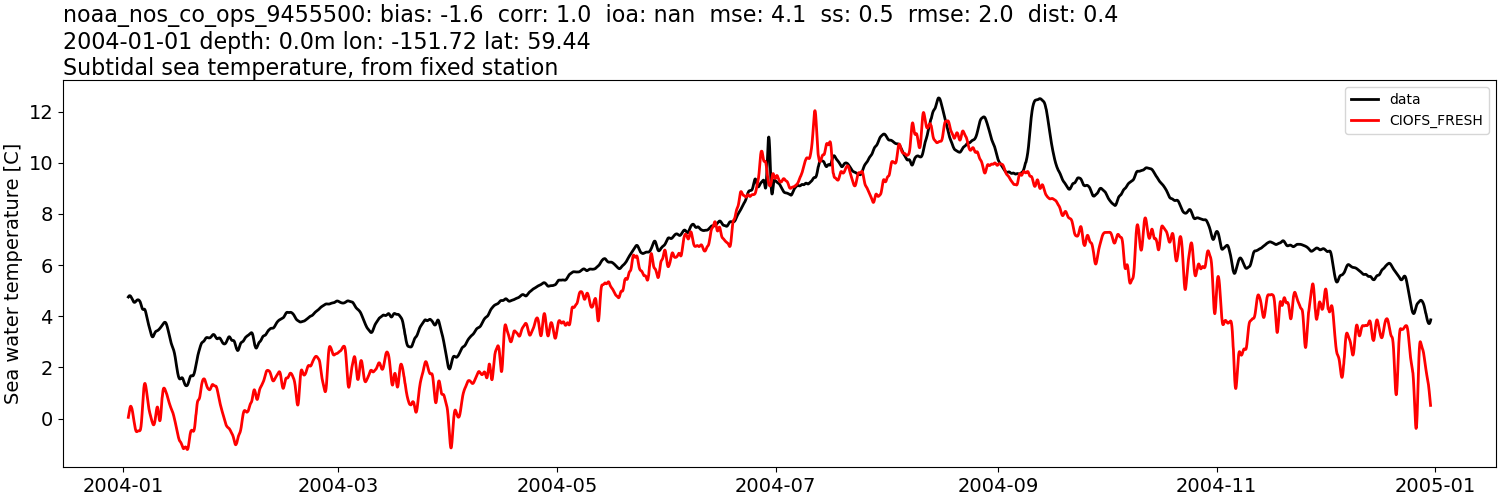
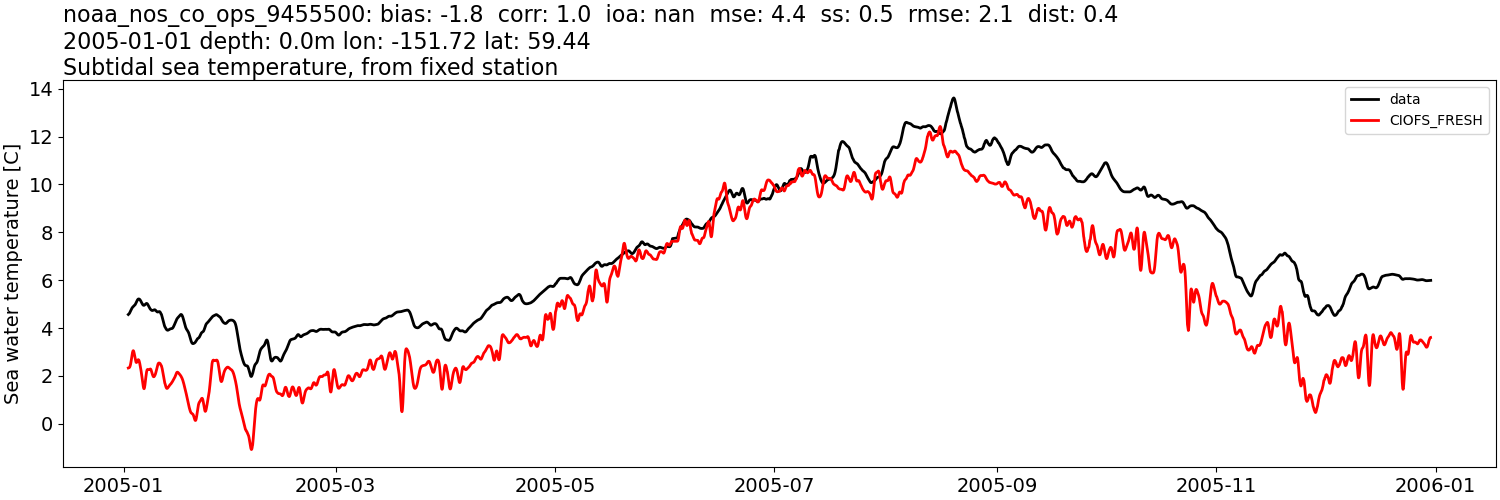
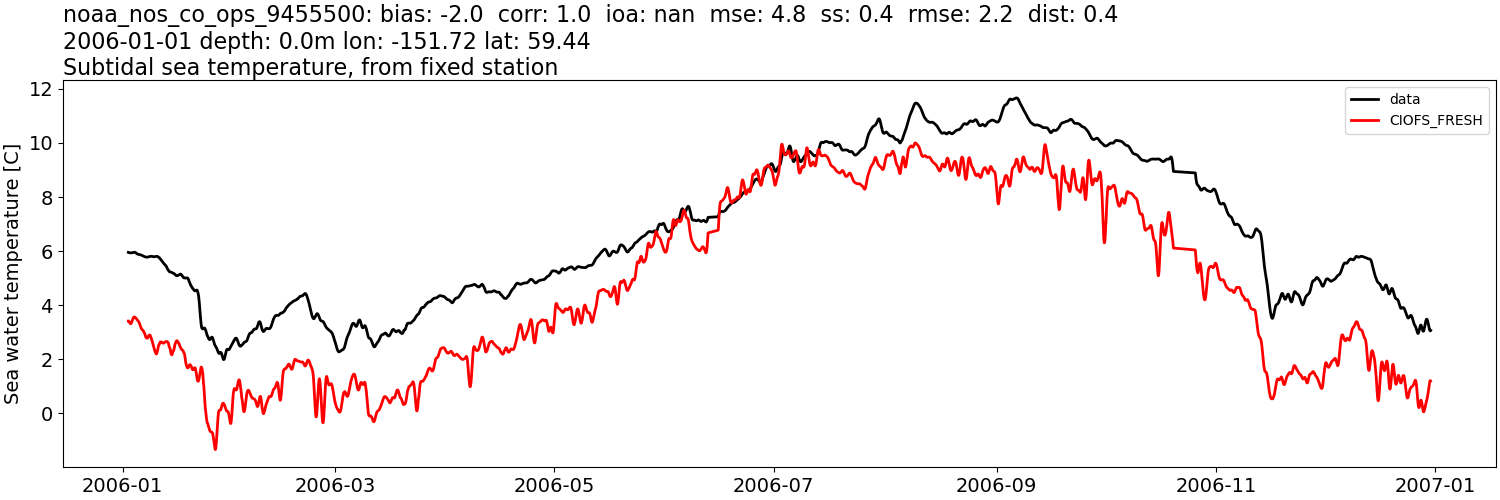
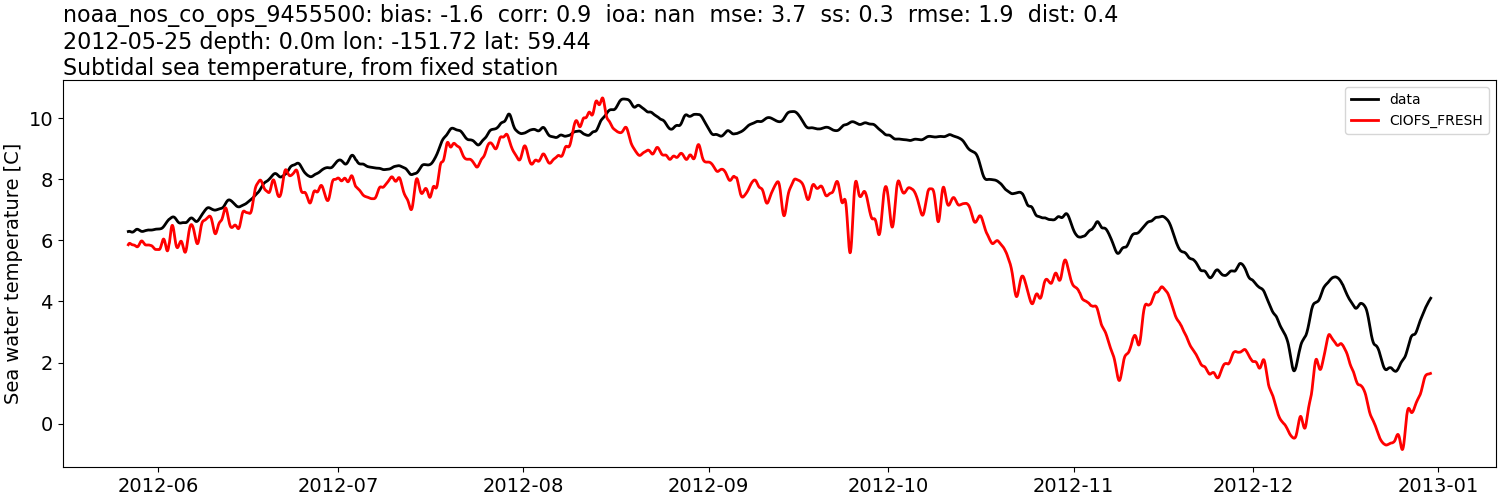
Sea water temperature: tidally-filtered#
CIOFS_HINDCAST#
Comparison plots by year
2003
2004
2005
2006
2012
2013
2014
CIOFS_FRESH#
Comparison plots by year
2003
2004
2005
2006
2012
2013
2014
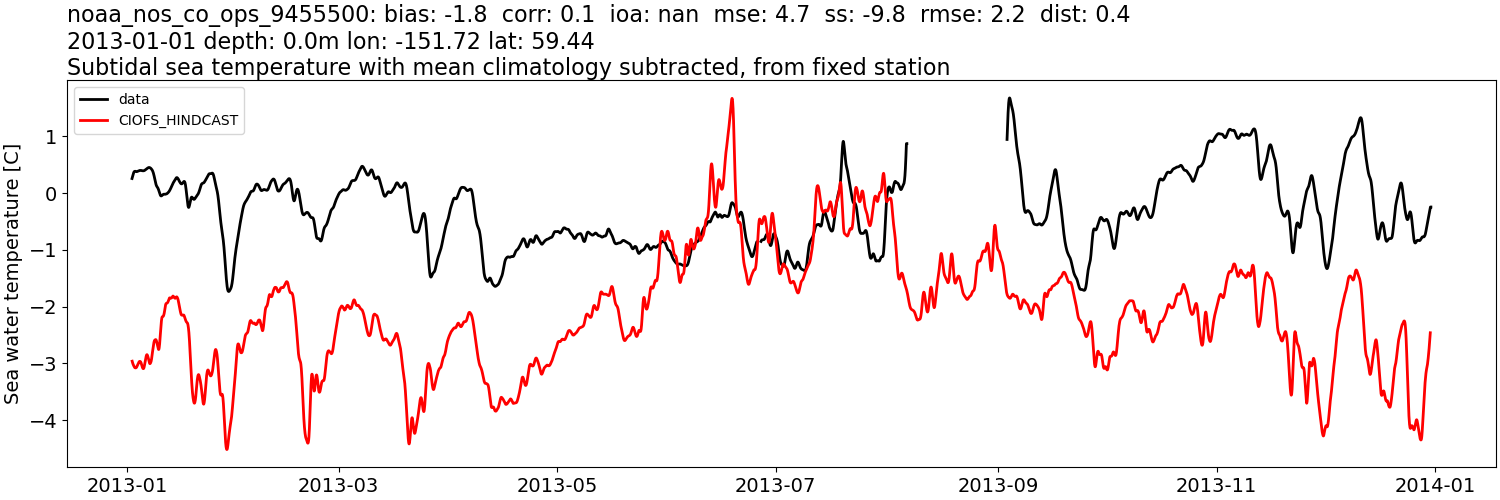
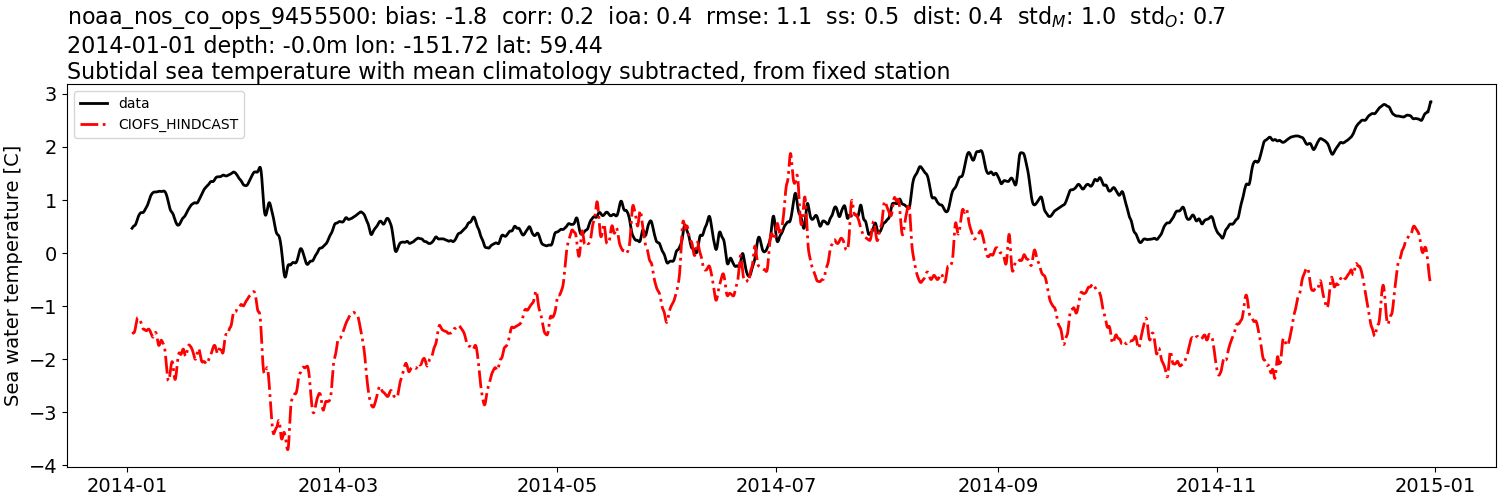
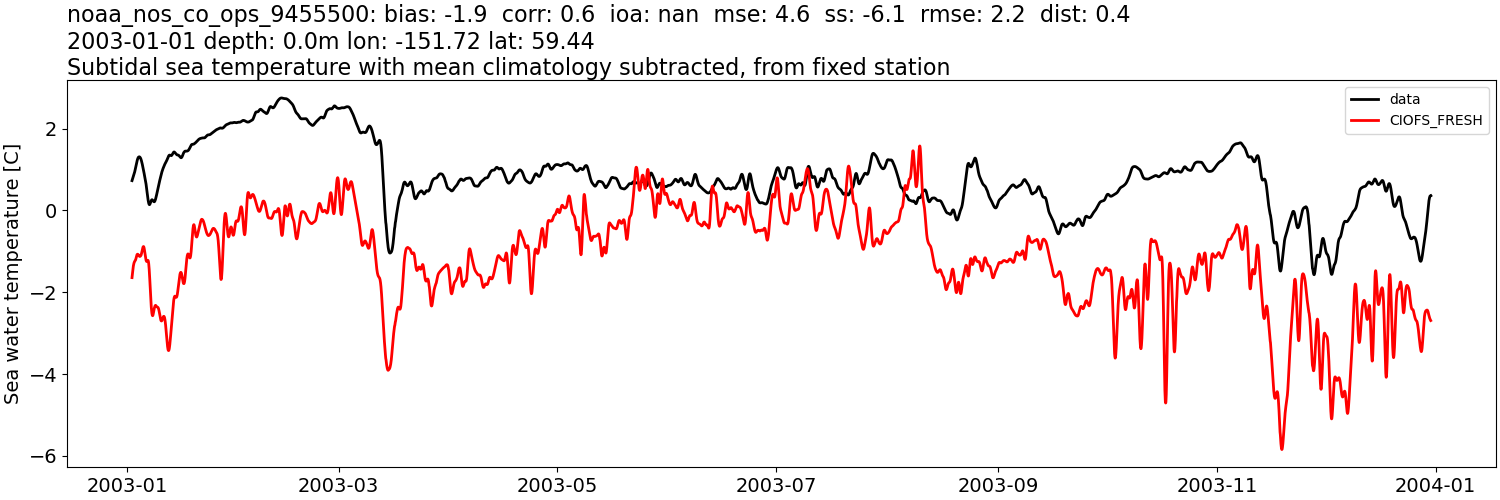
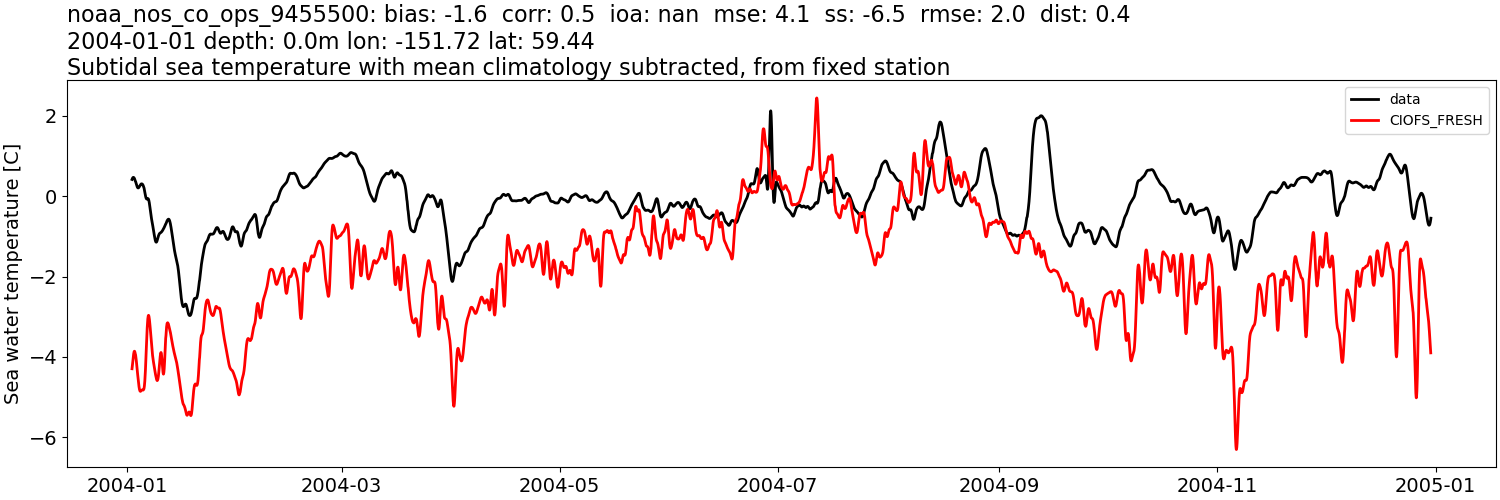
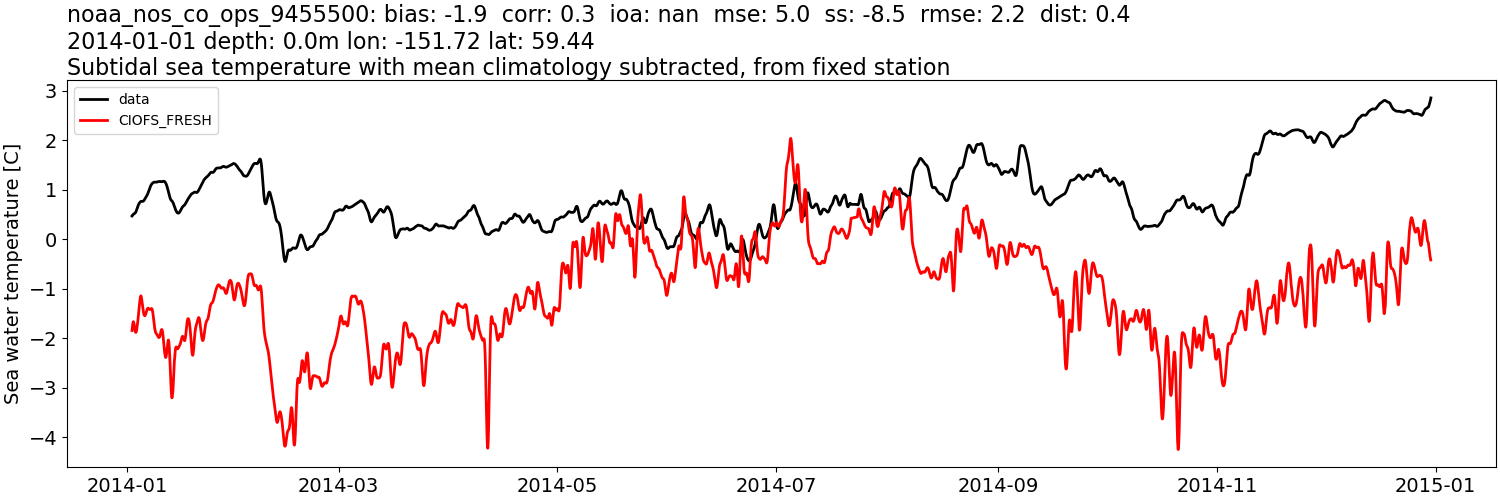
Sea water temperature: tidally-filtered, then monthly mean from data subtracted#
CIOFS_HINDCAST#
Comparison plots by year
2003
2004
2005
2006
2012
2013
2014
CIOFS_FRESH#
Comparison plots by year
2003
2004
2005
2006
2012
2013
2014
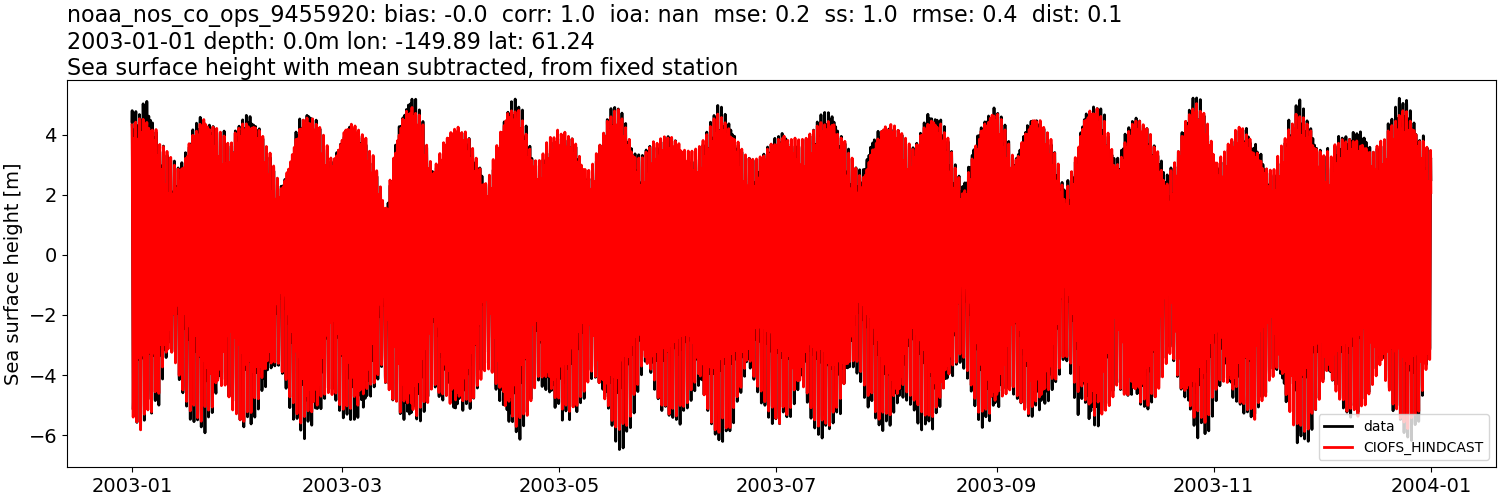
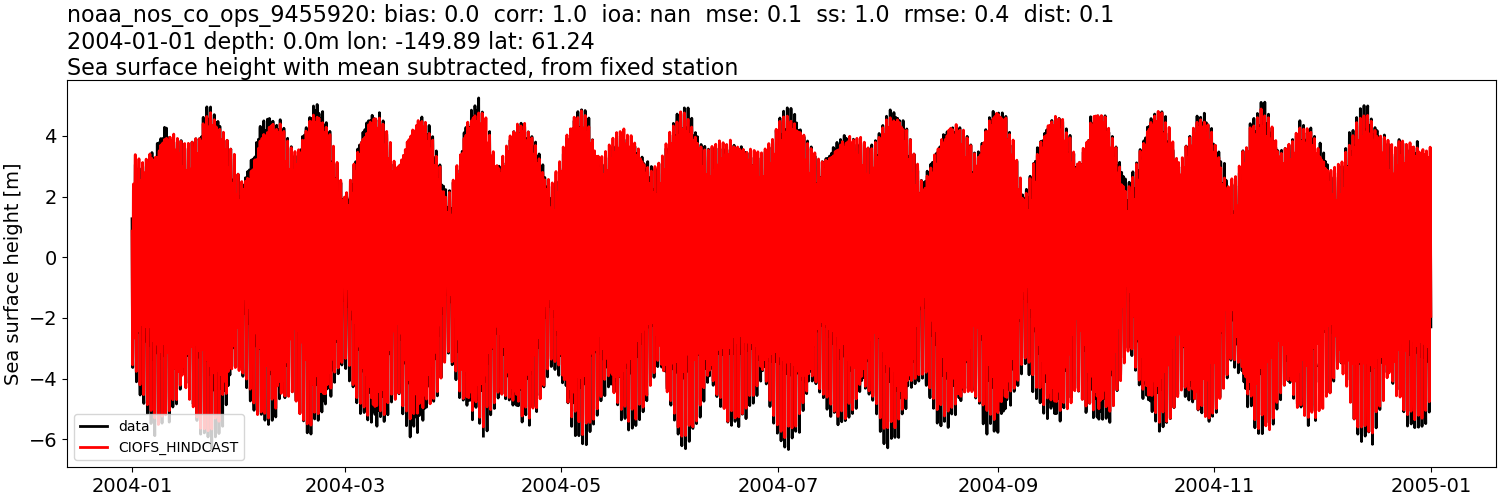
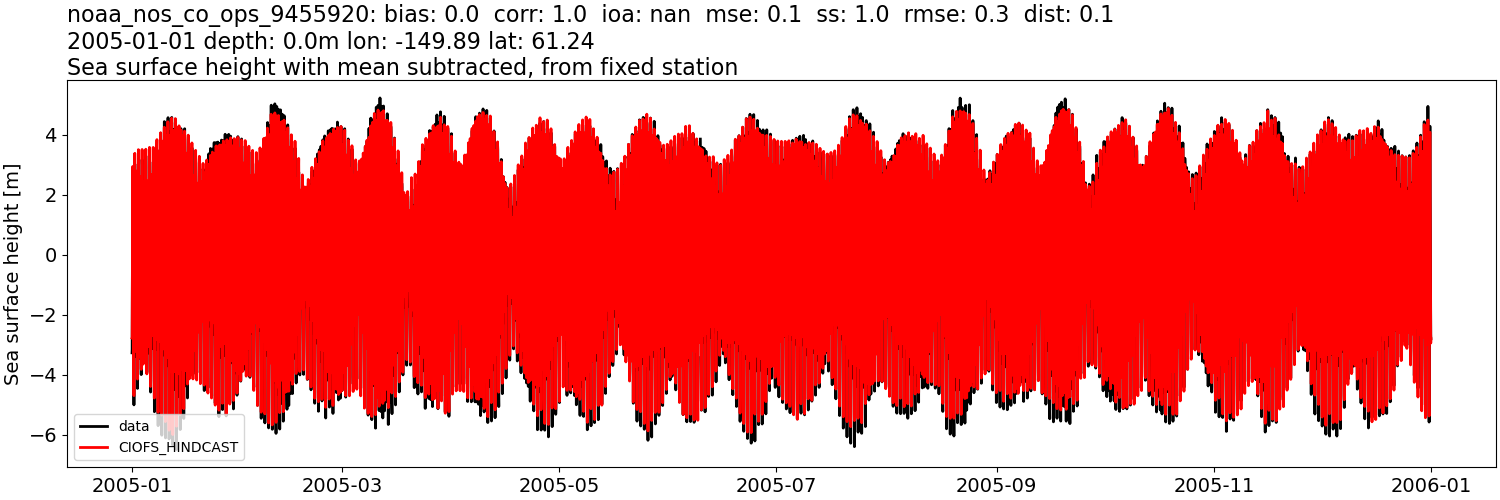
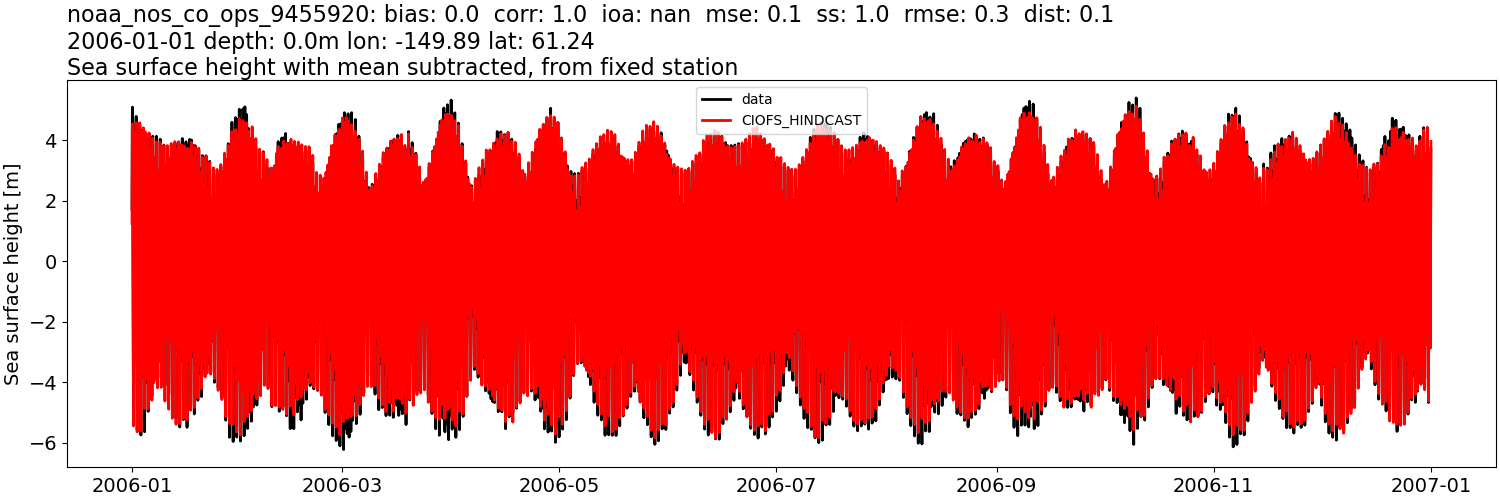
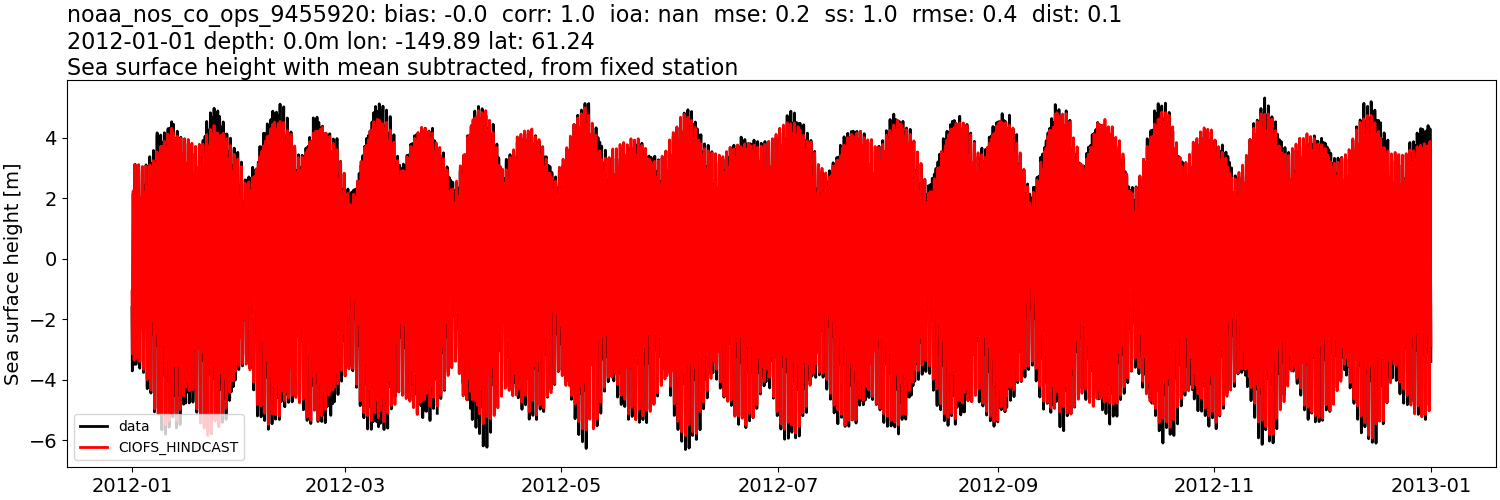
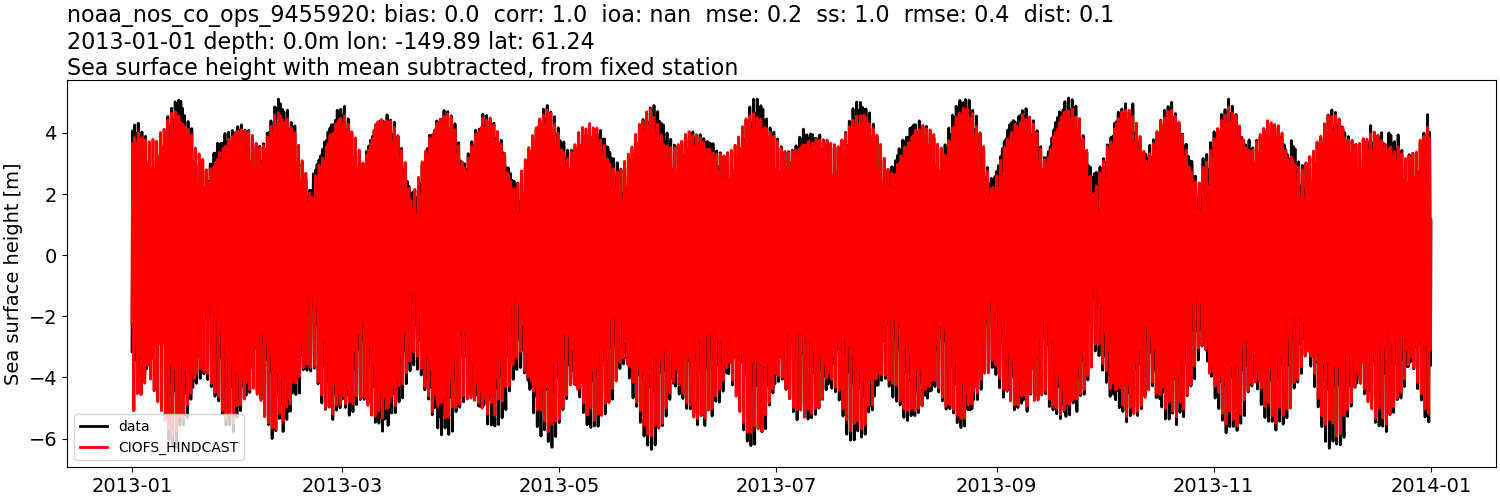
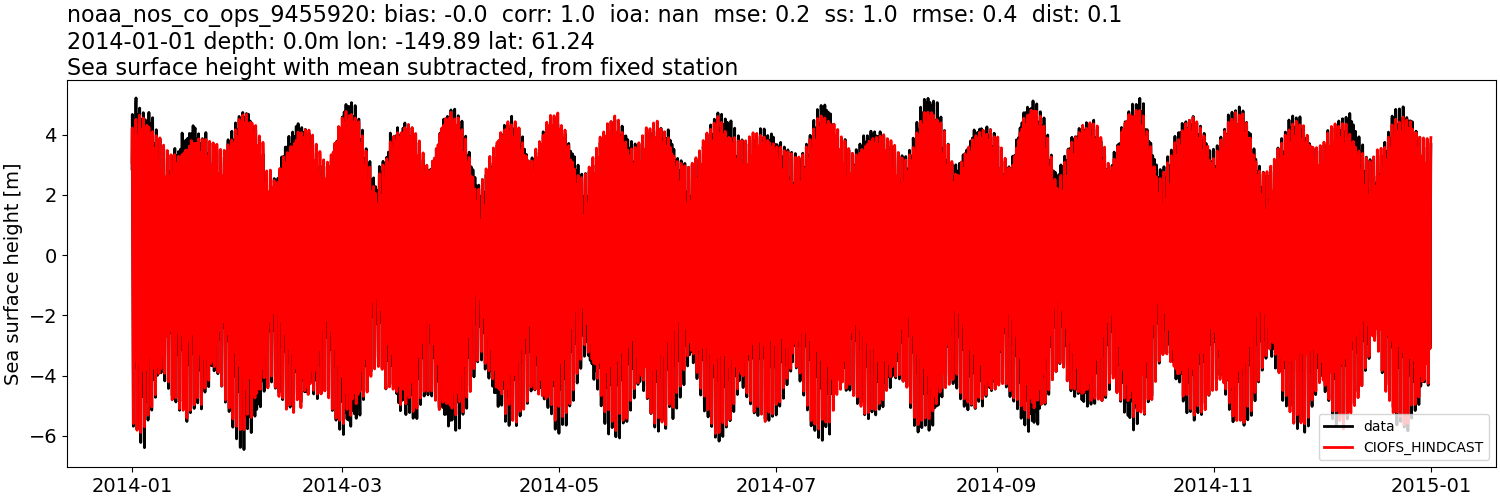
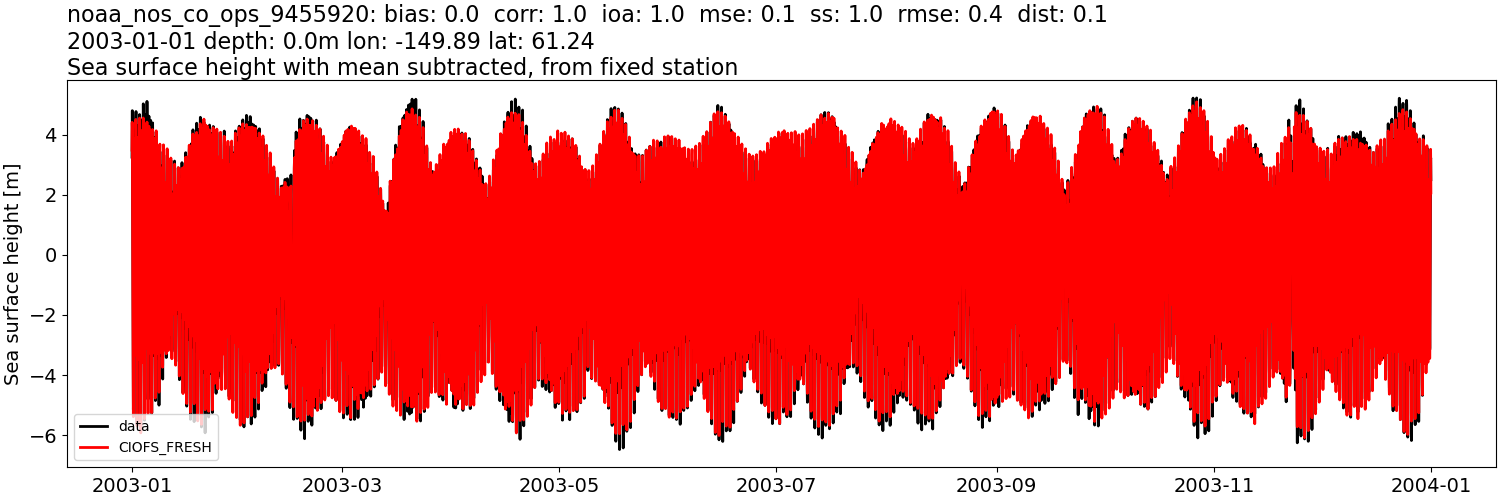
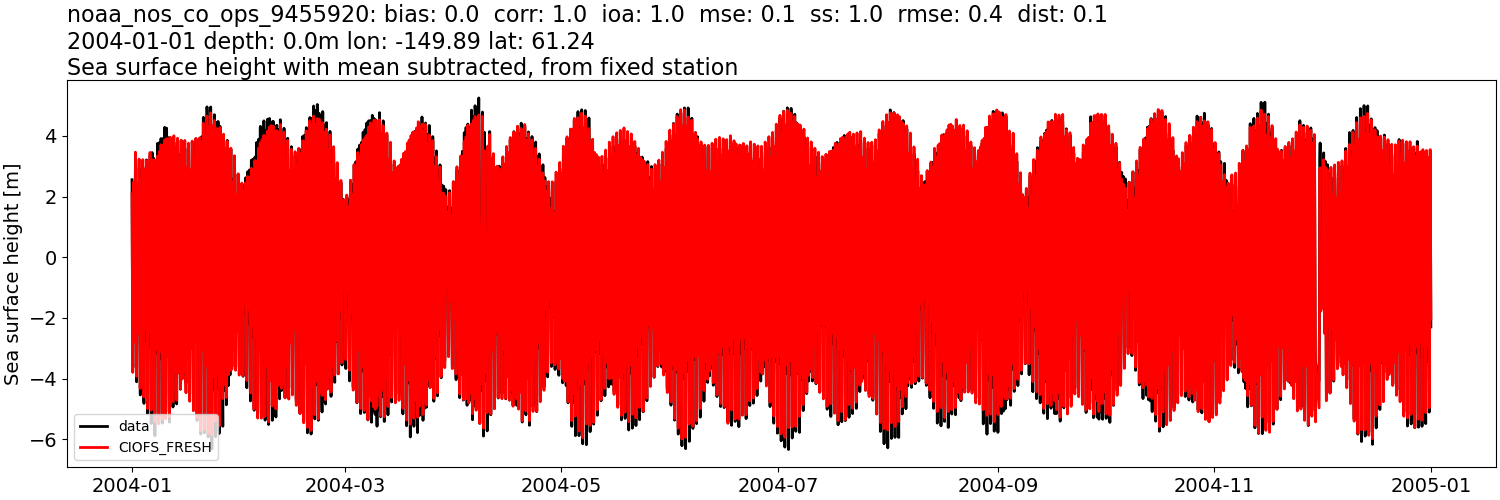
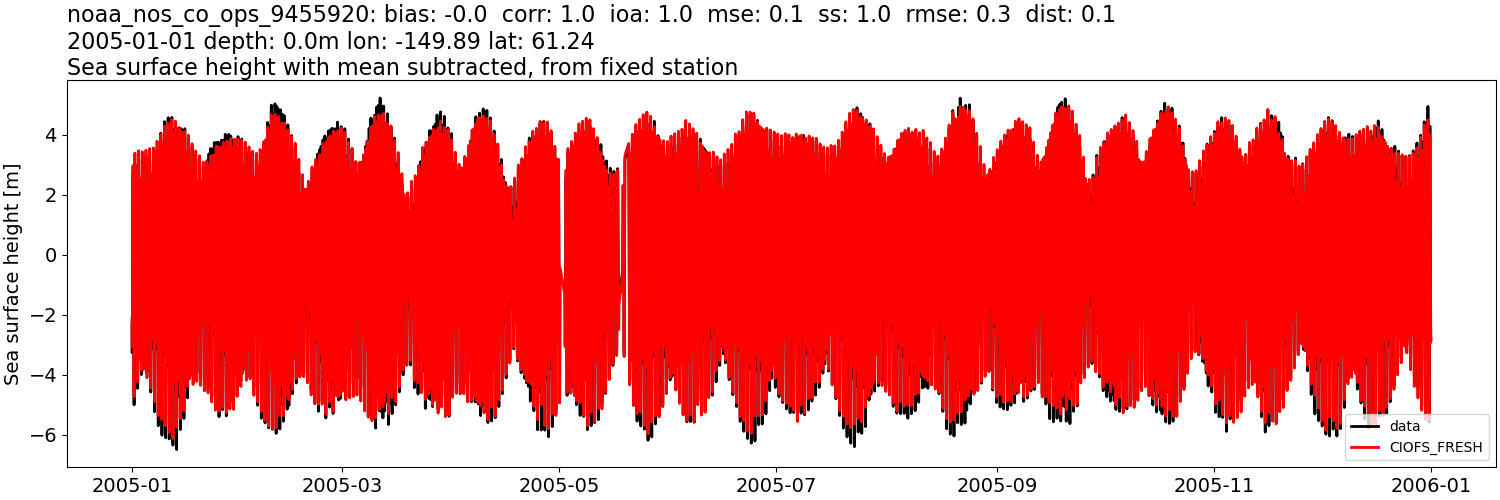
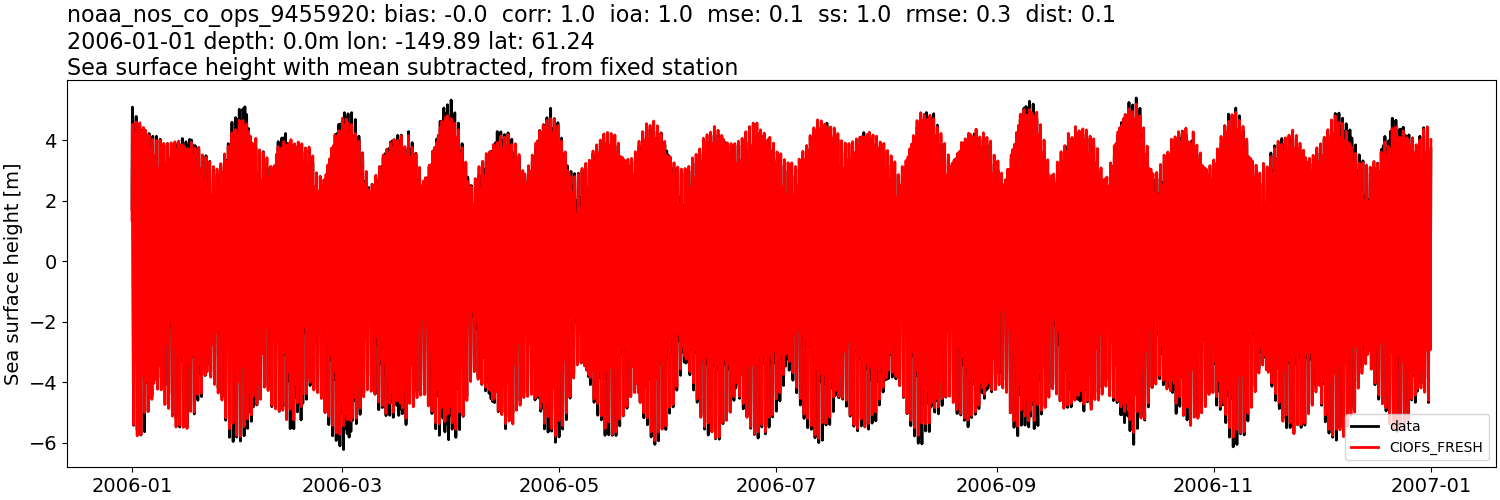
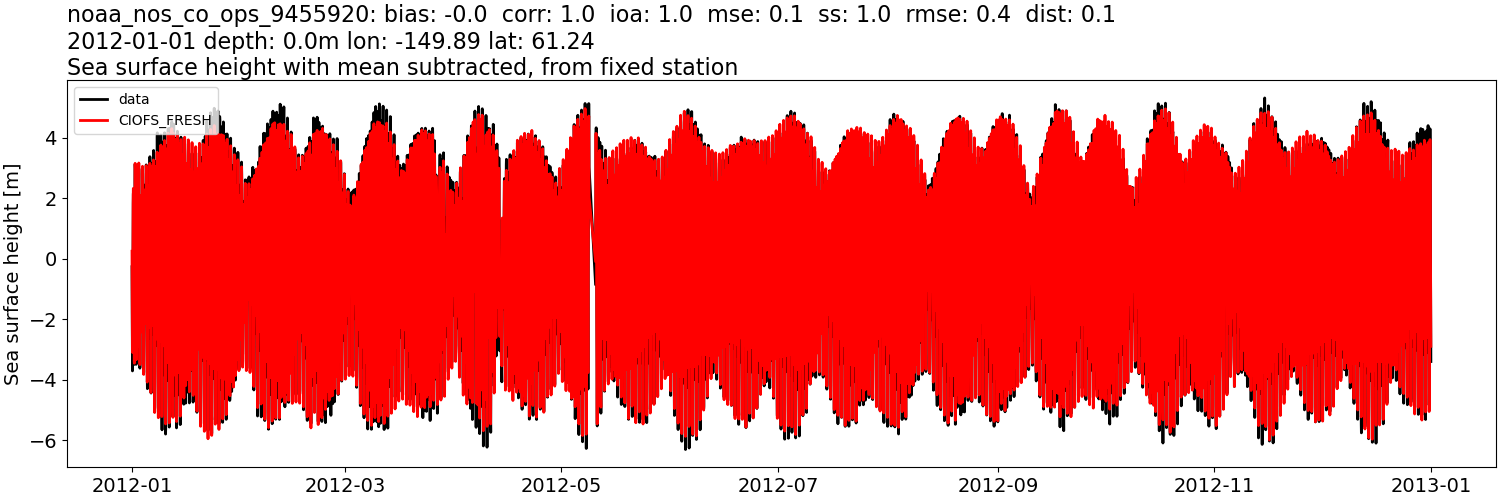
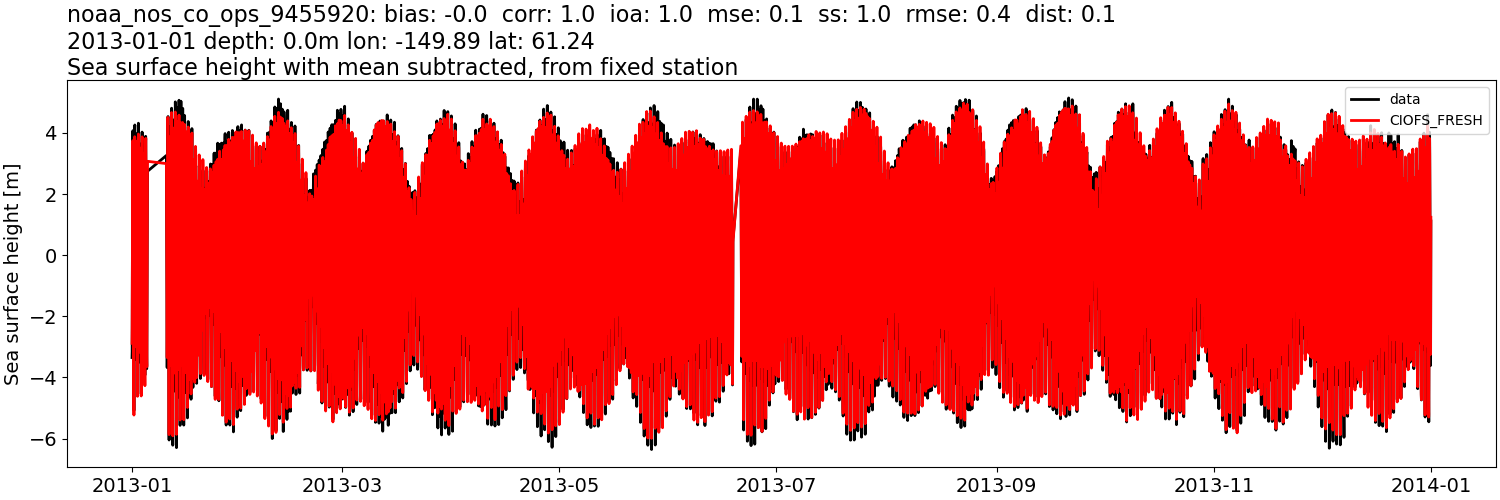
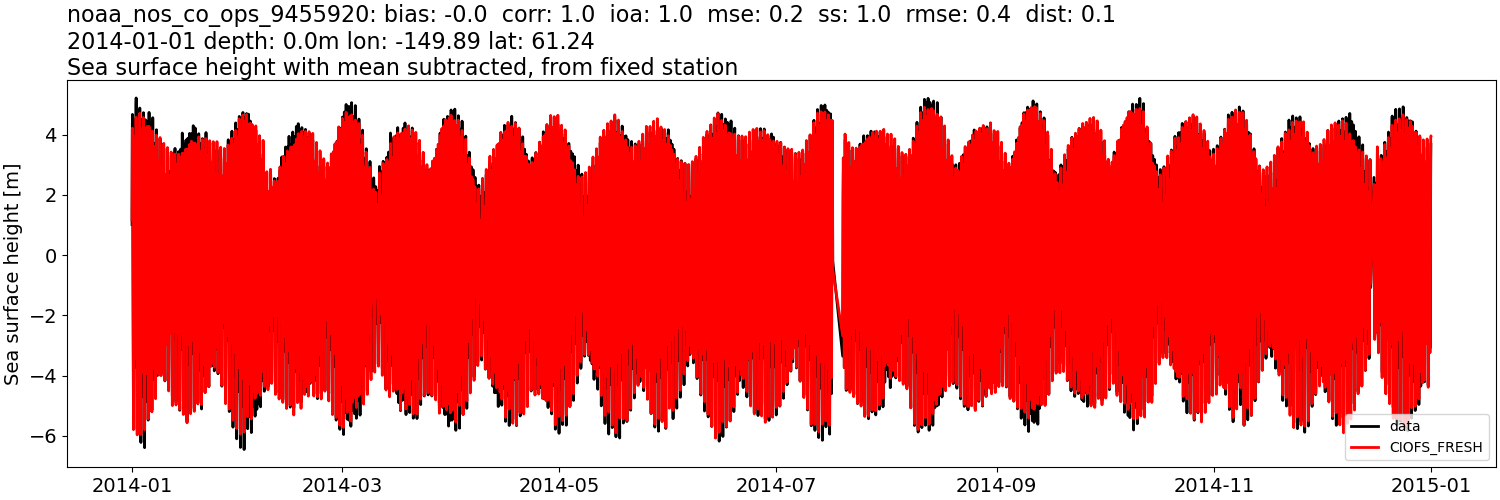
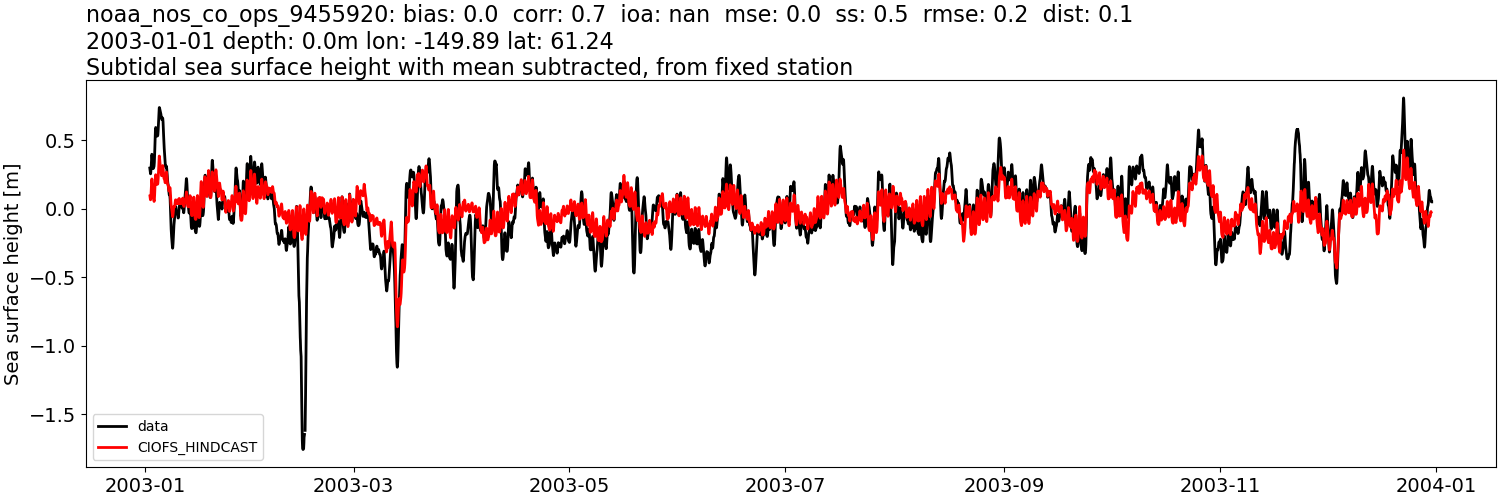
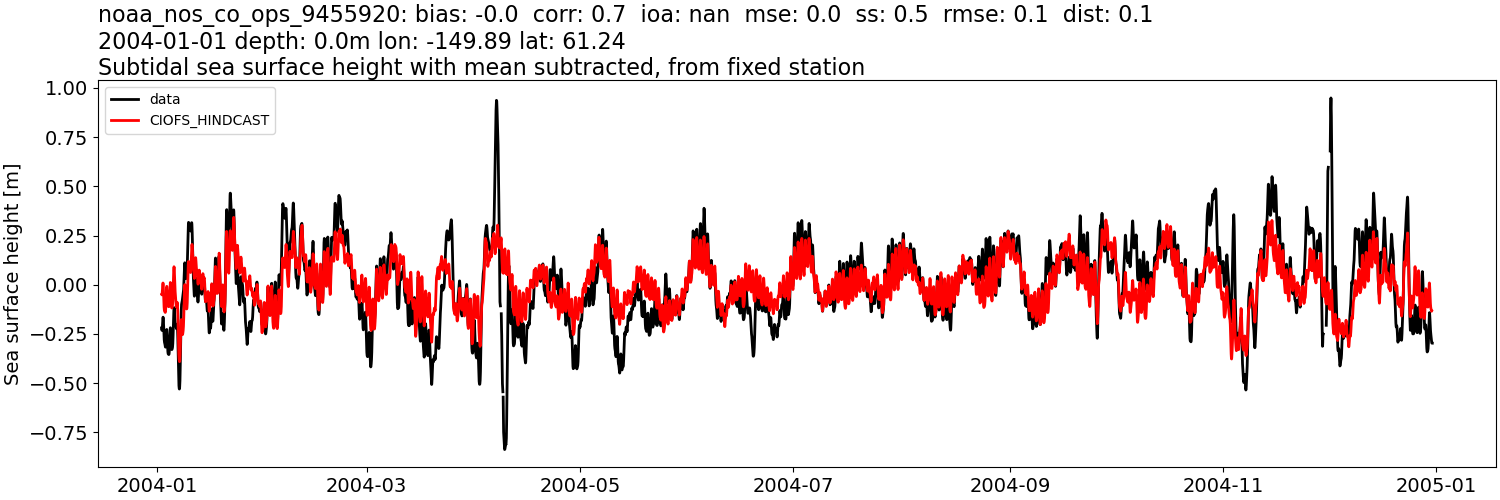
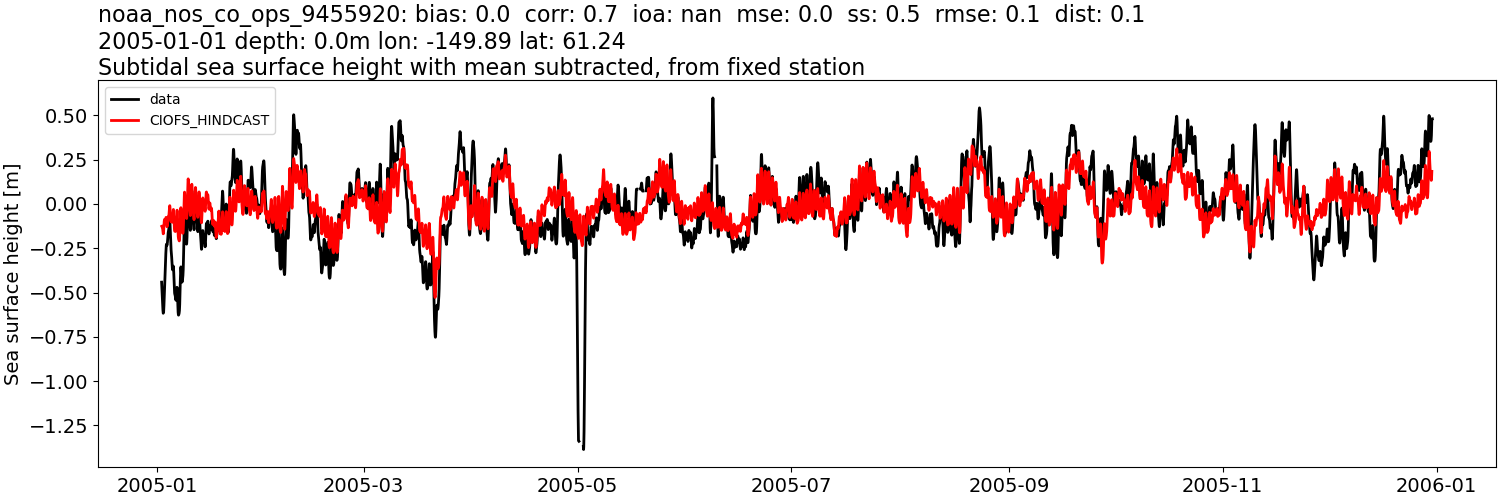
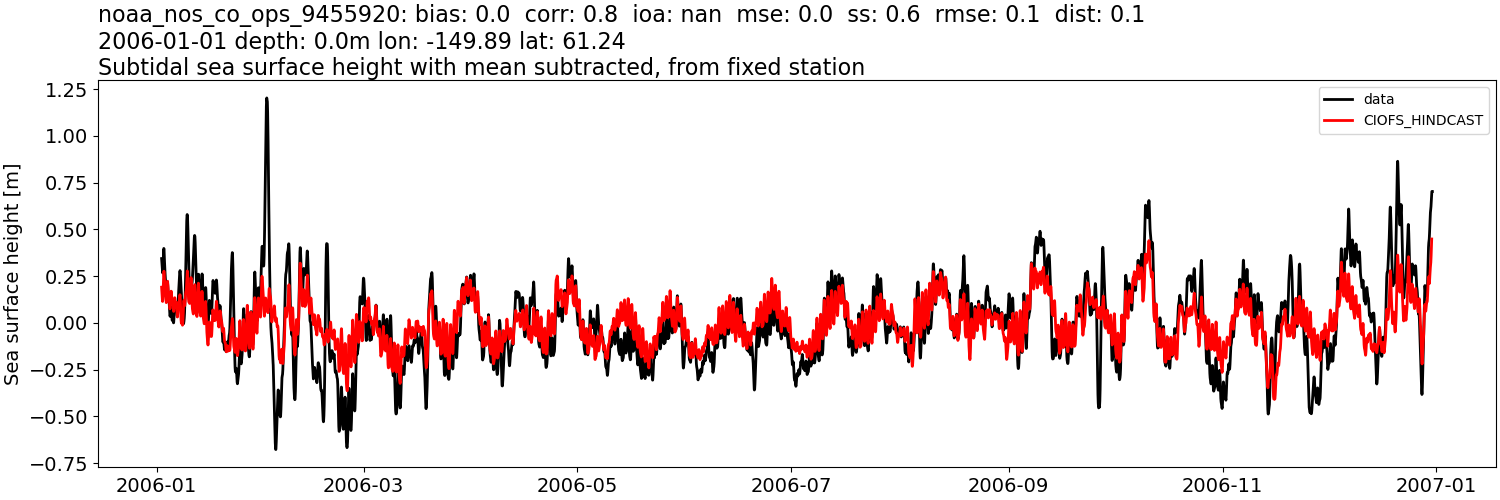
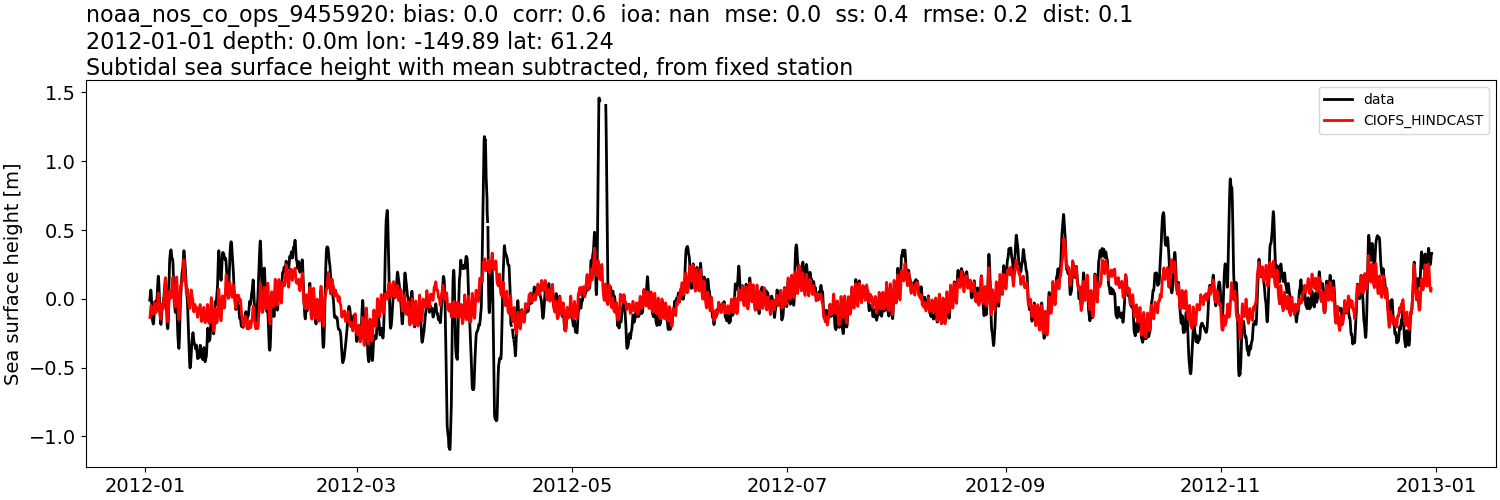
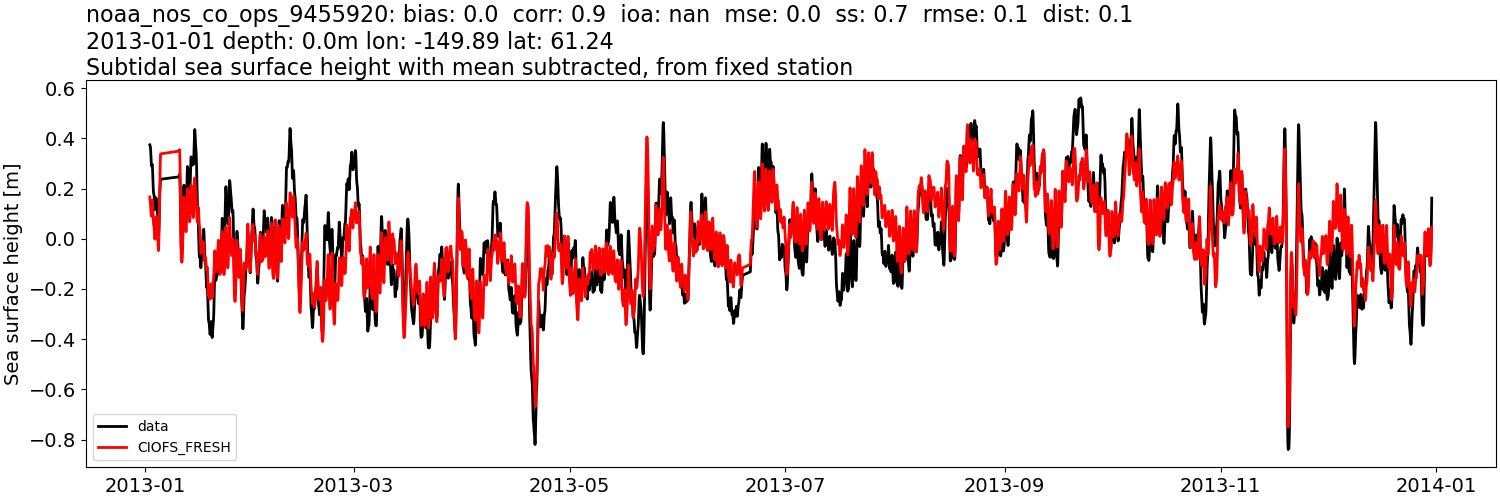
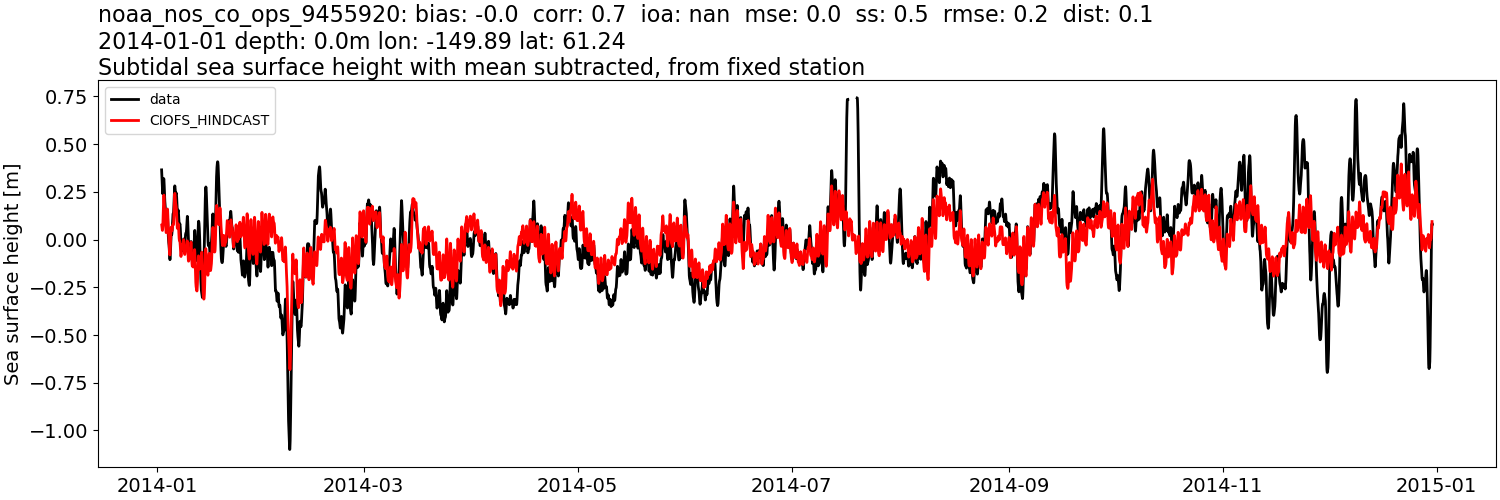
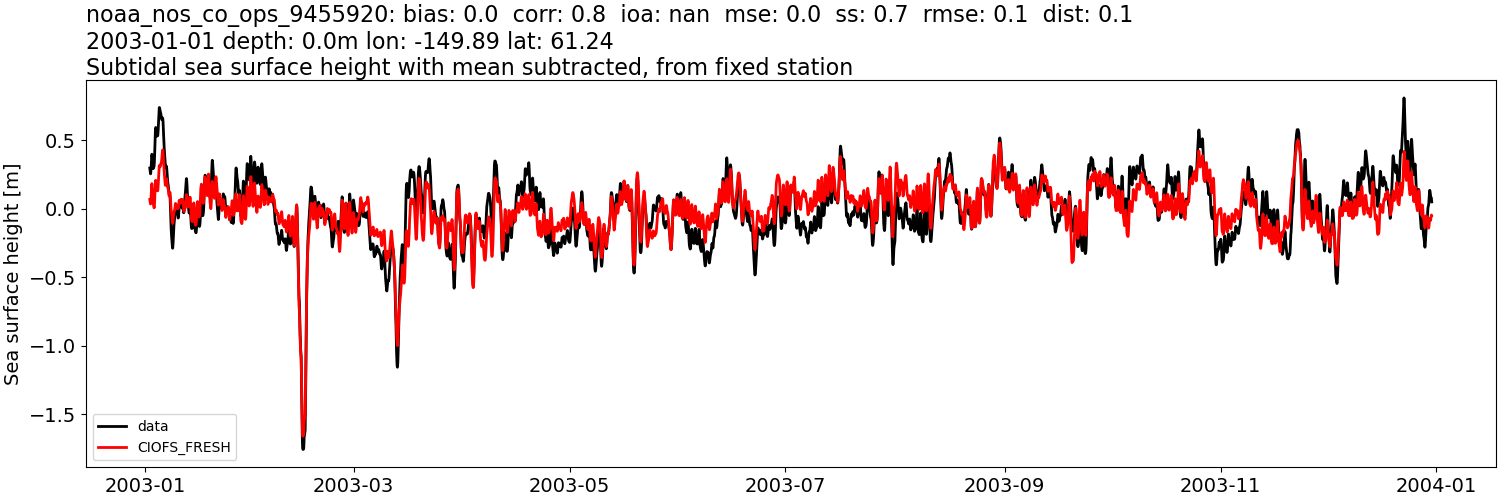
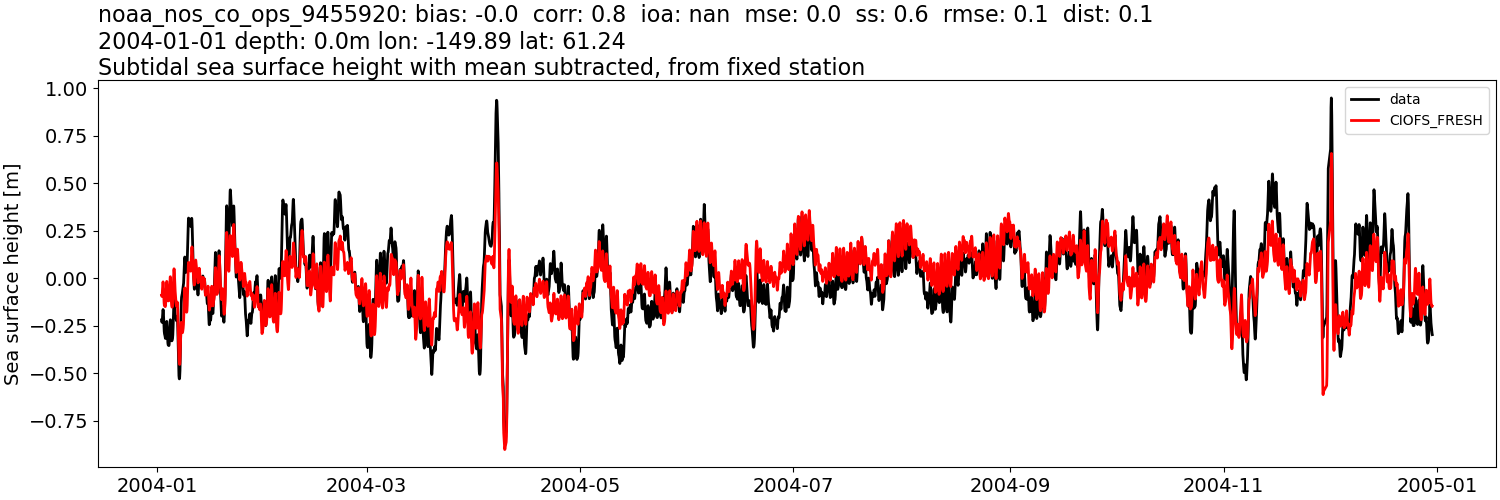
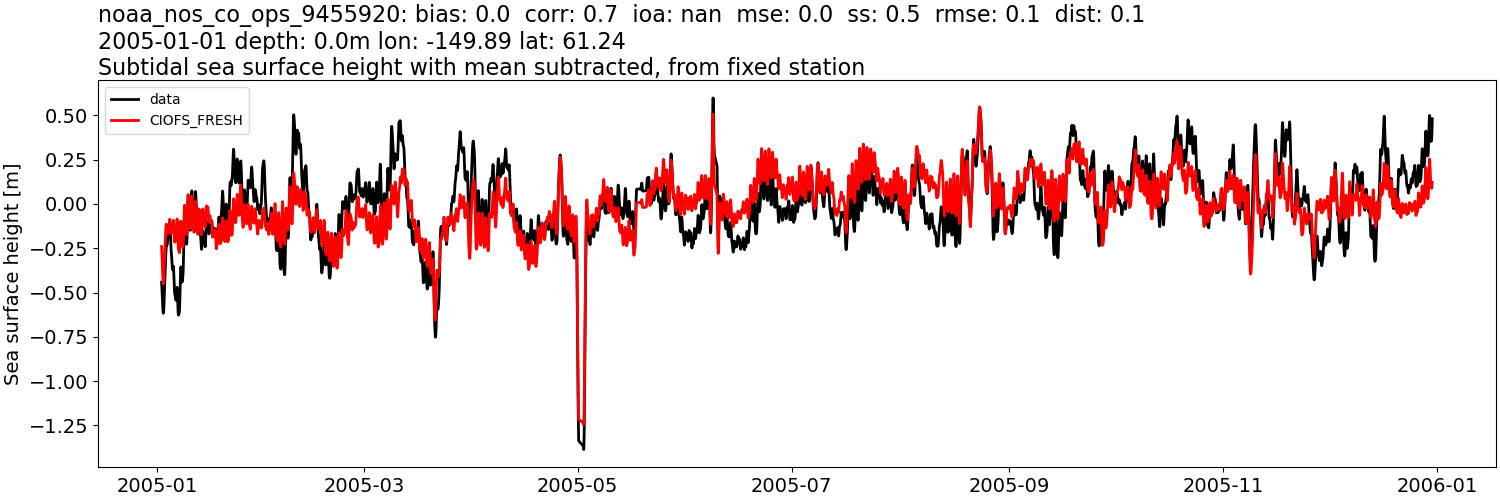
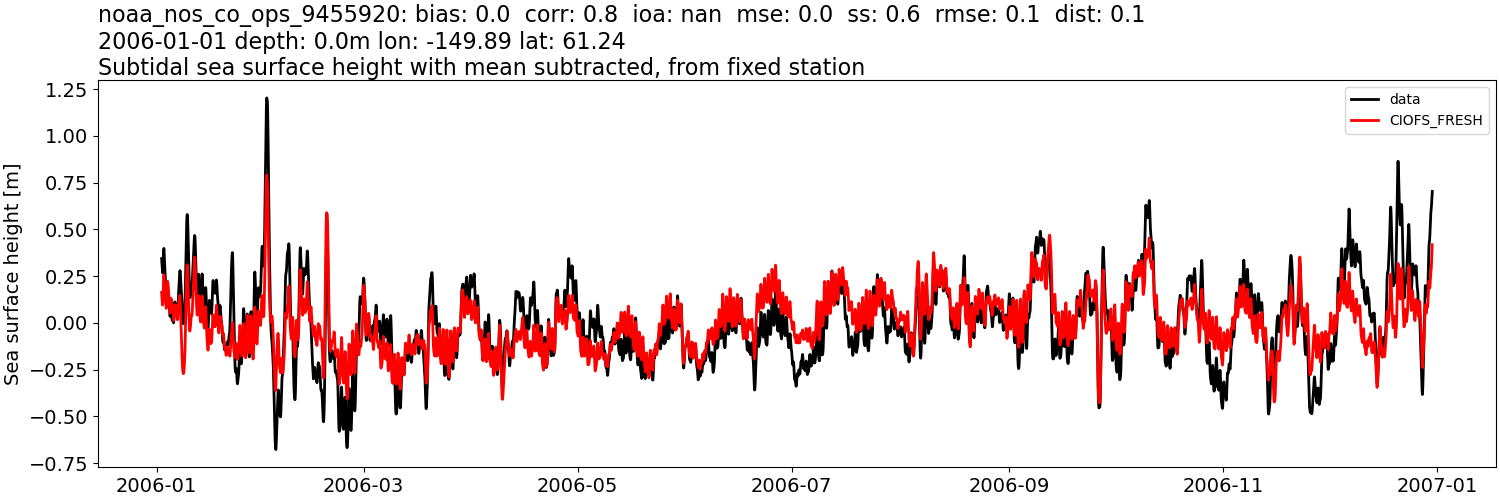
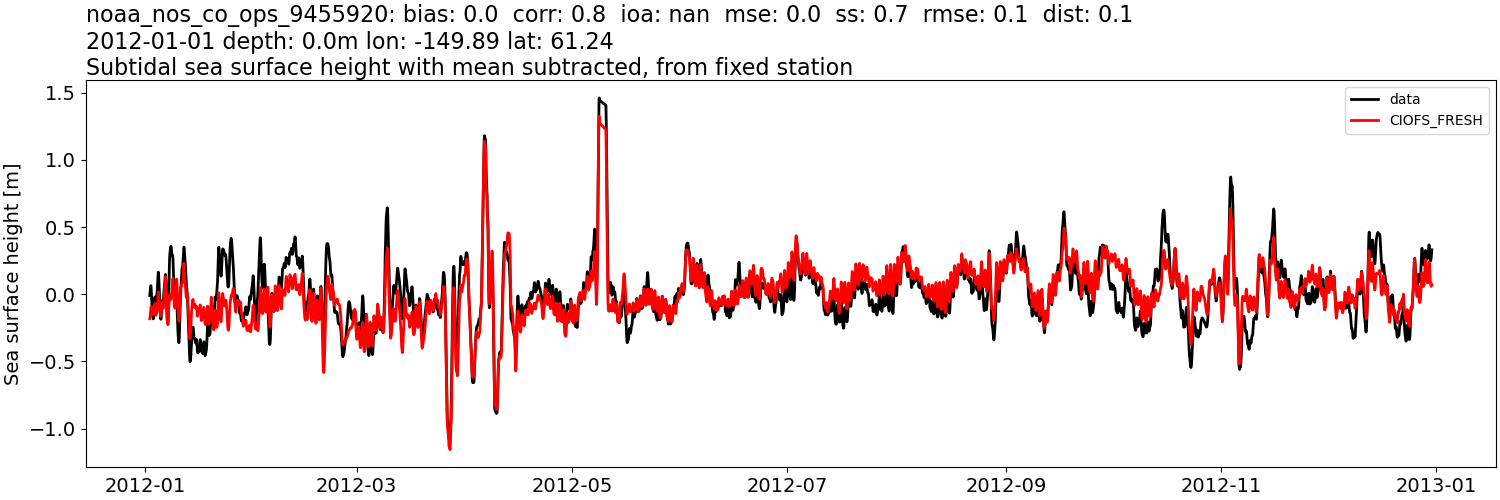
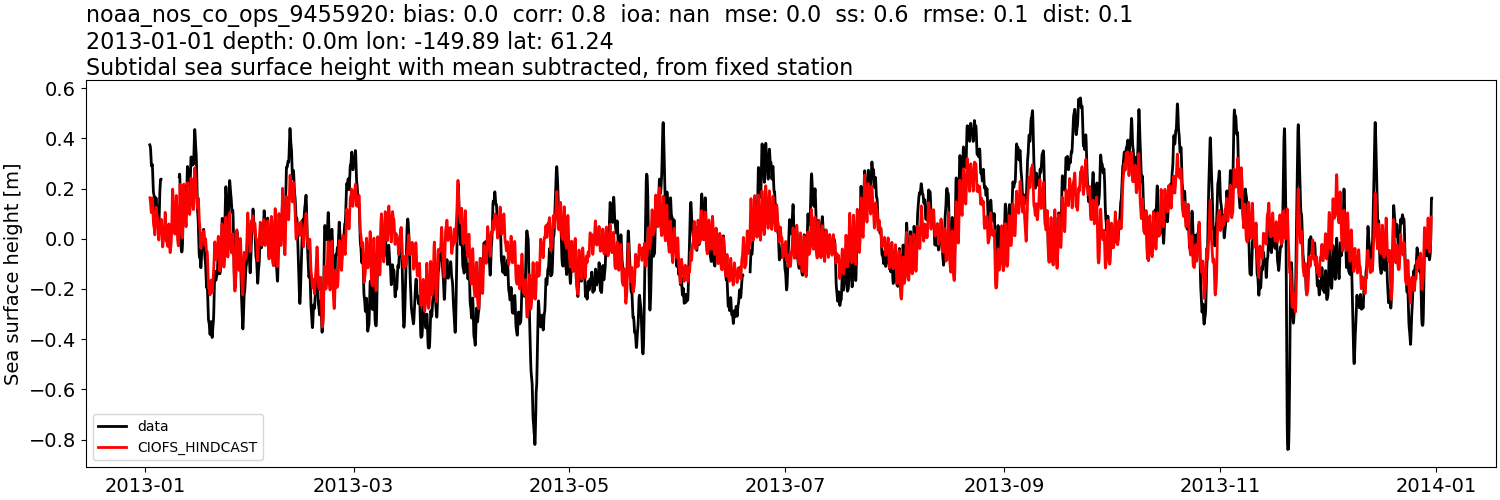
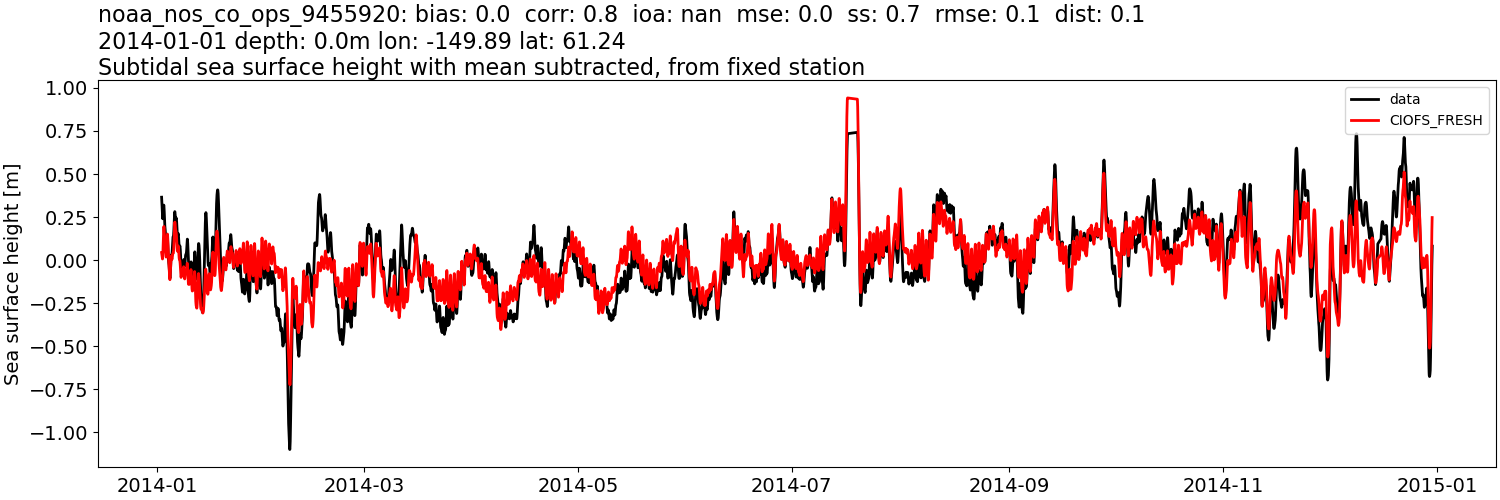
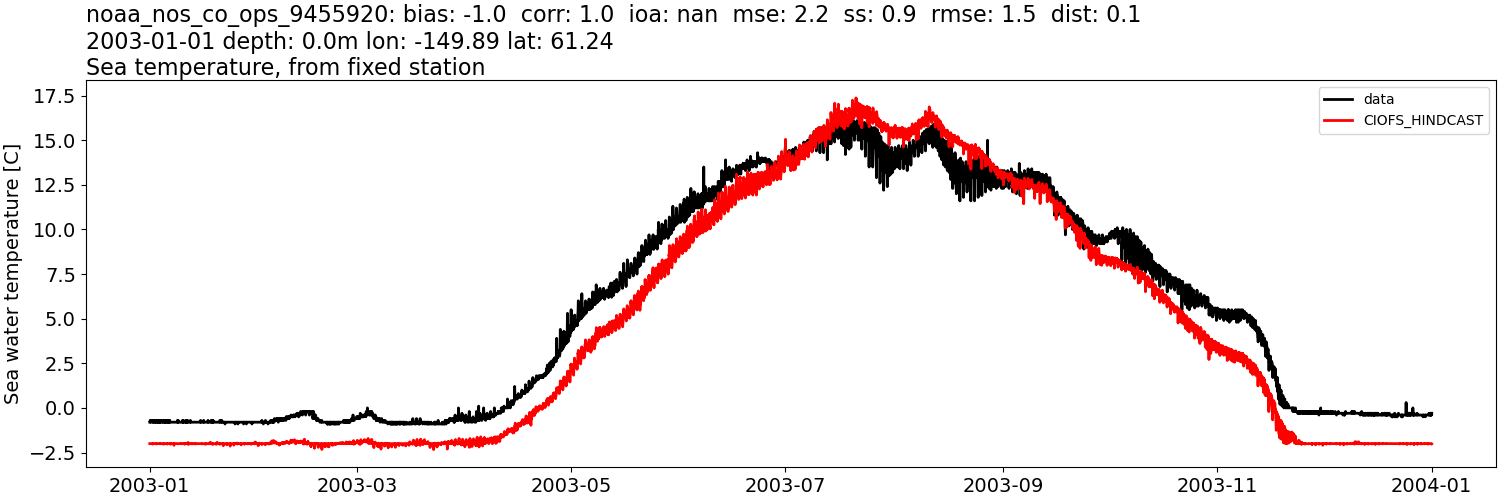
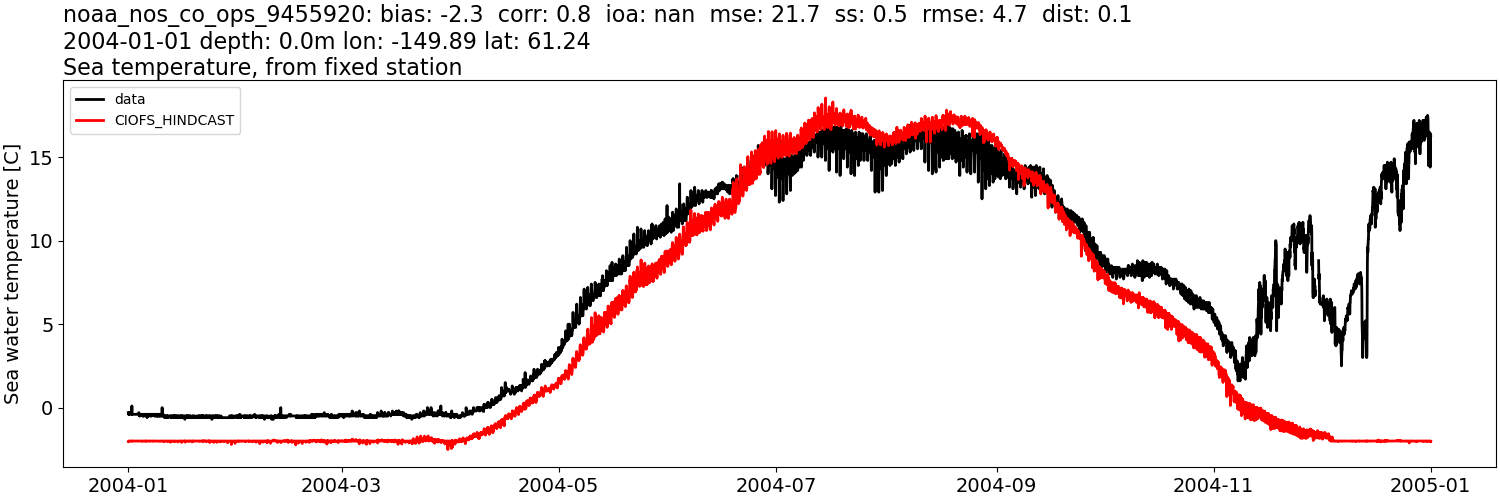
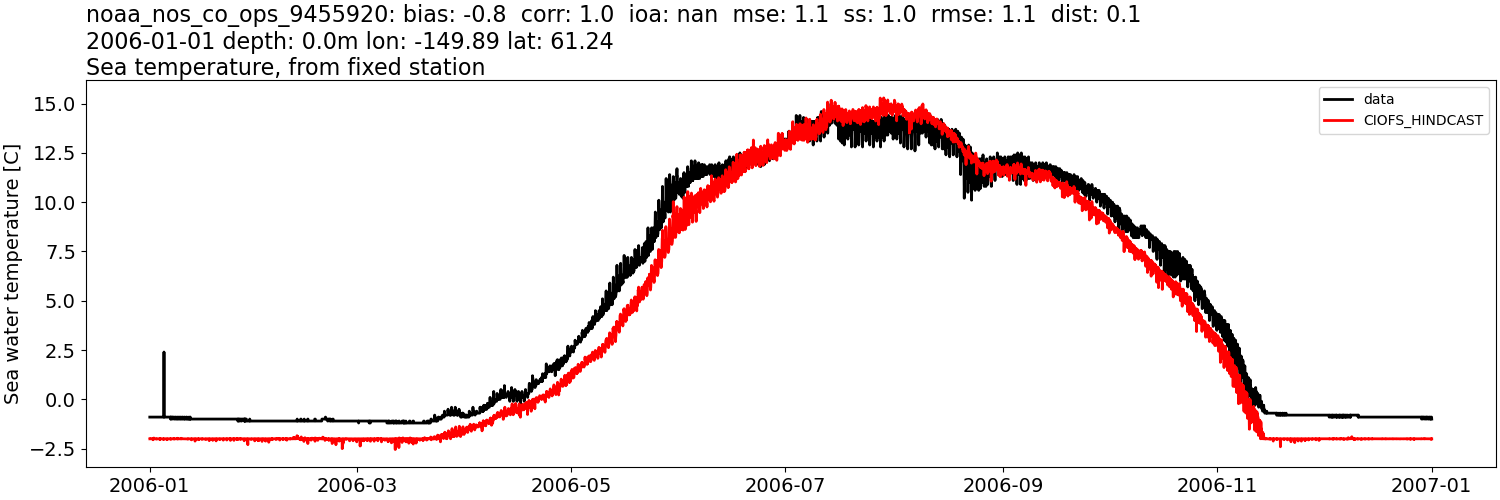
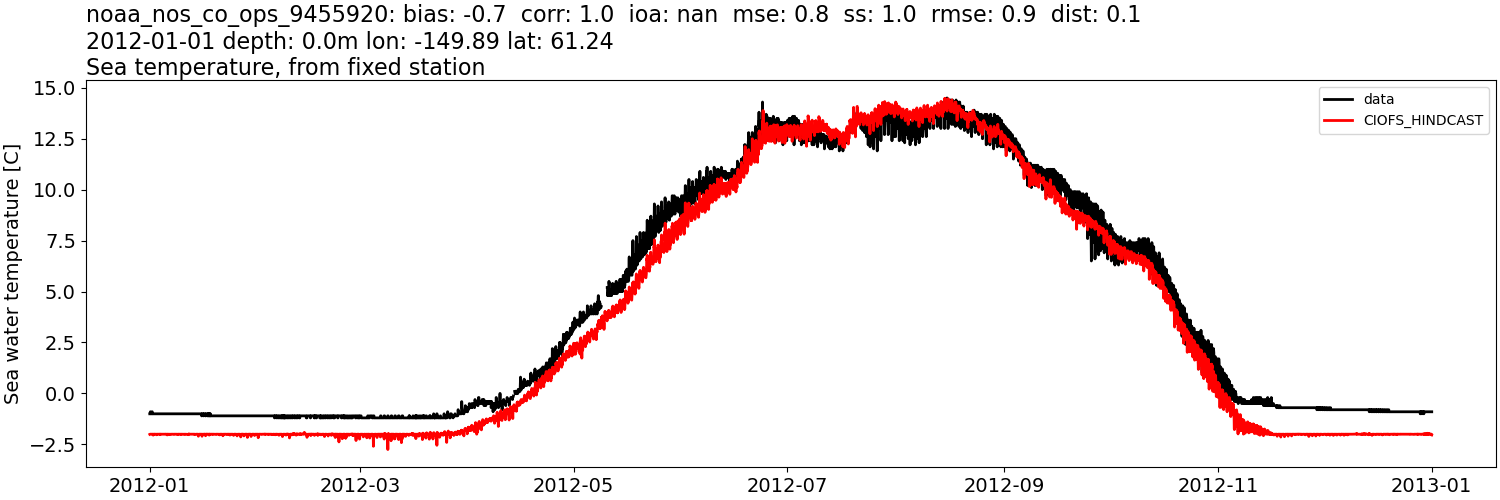
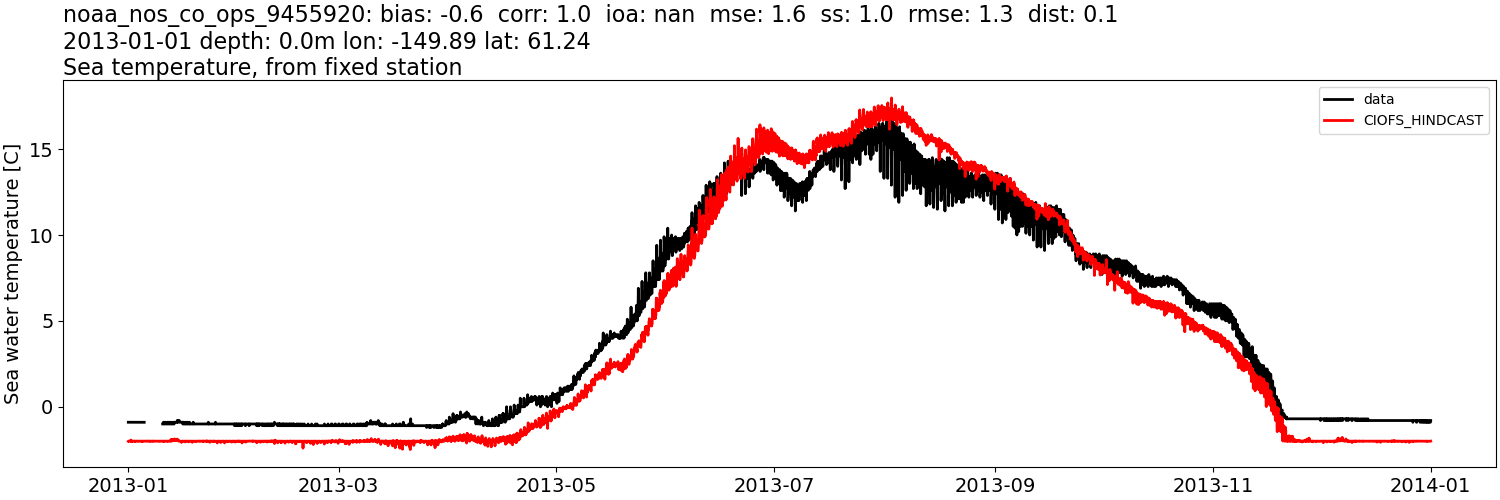
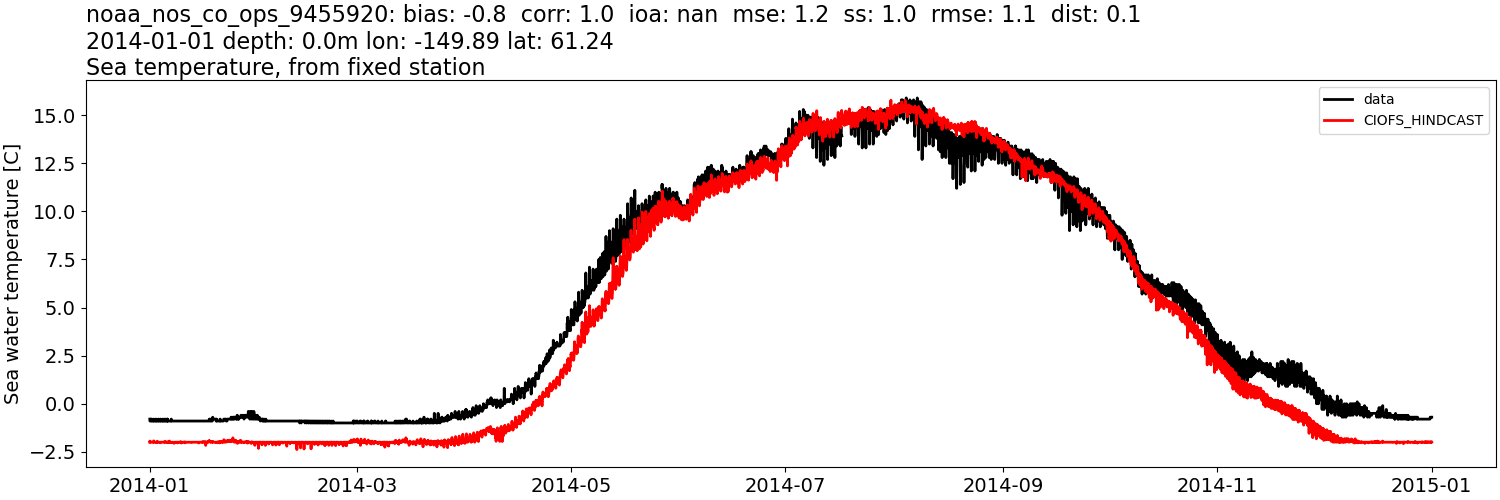
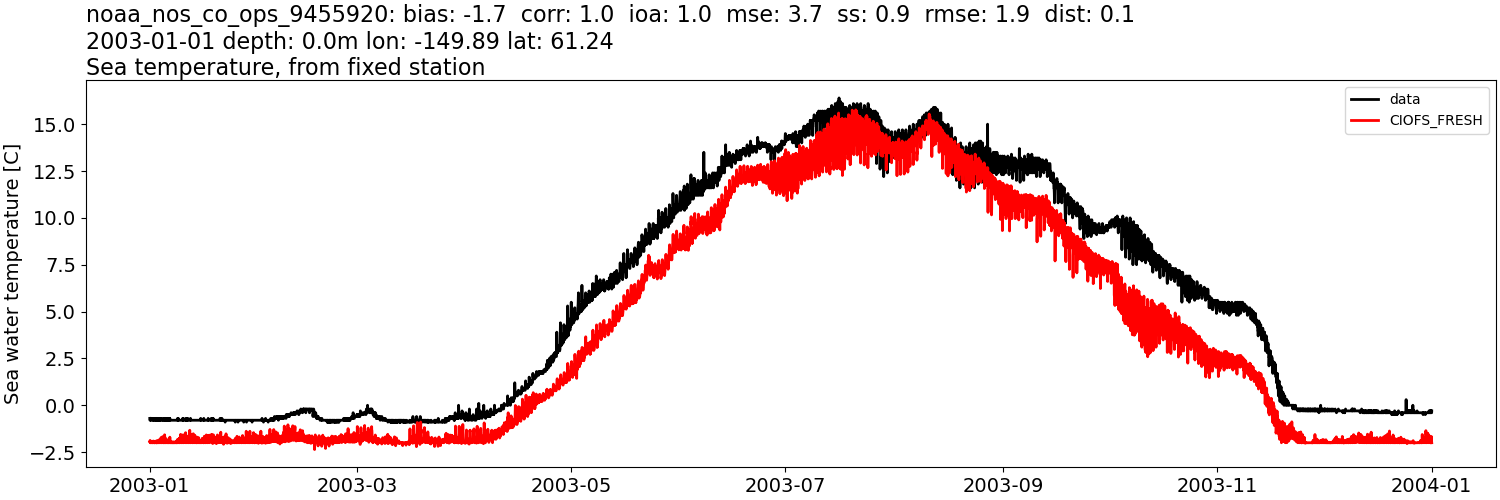
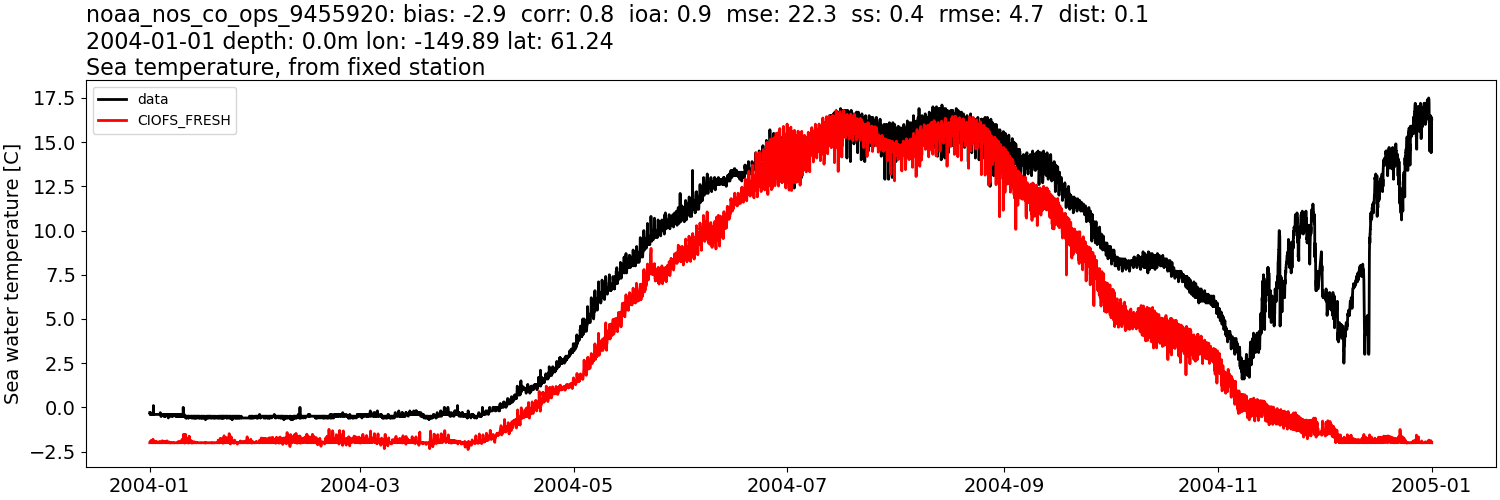
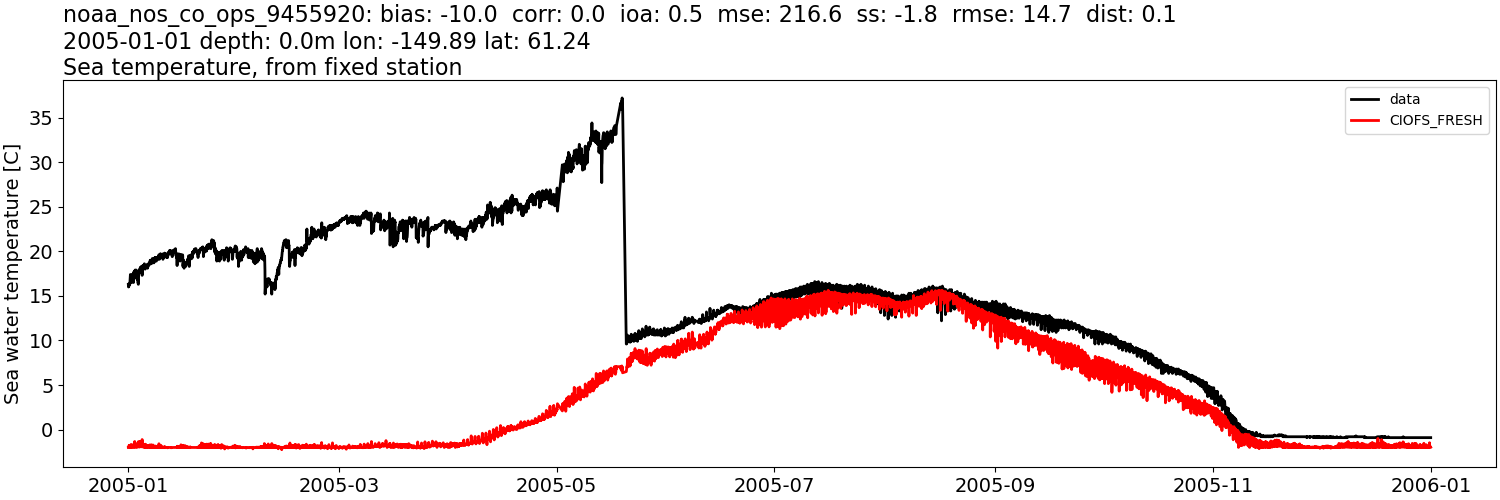
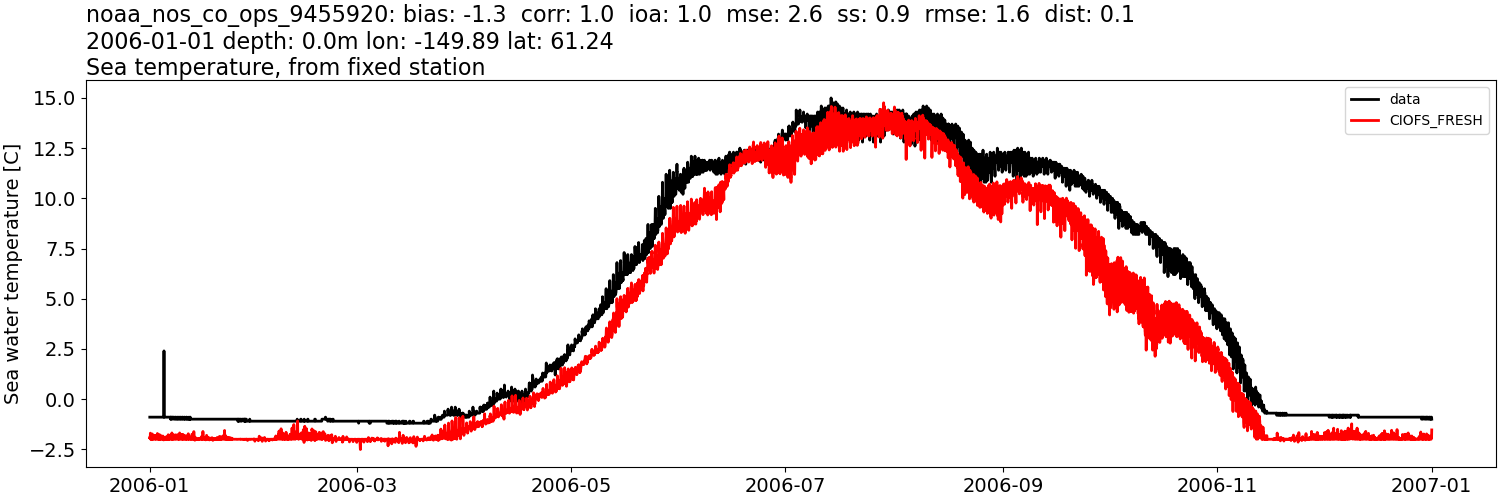
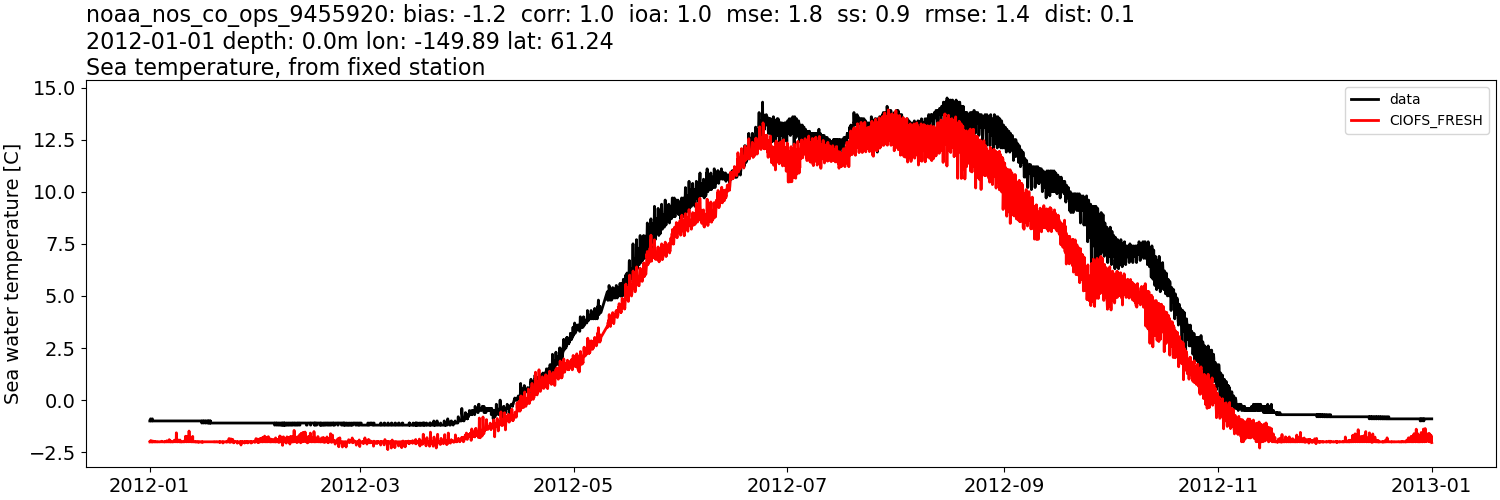
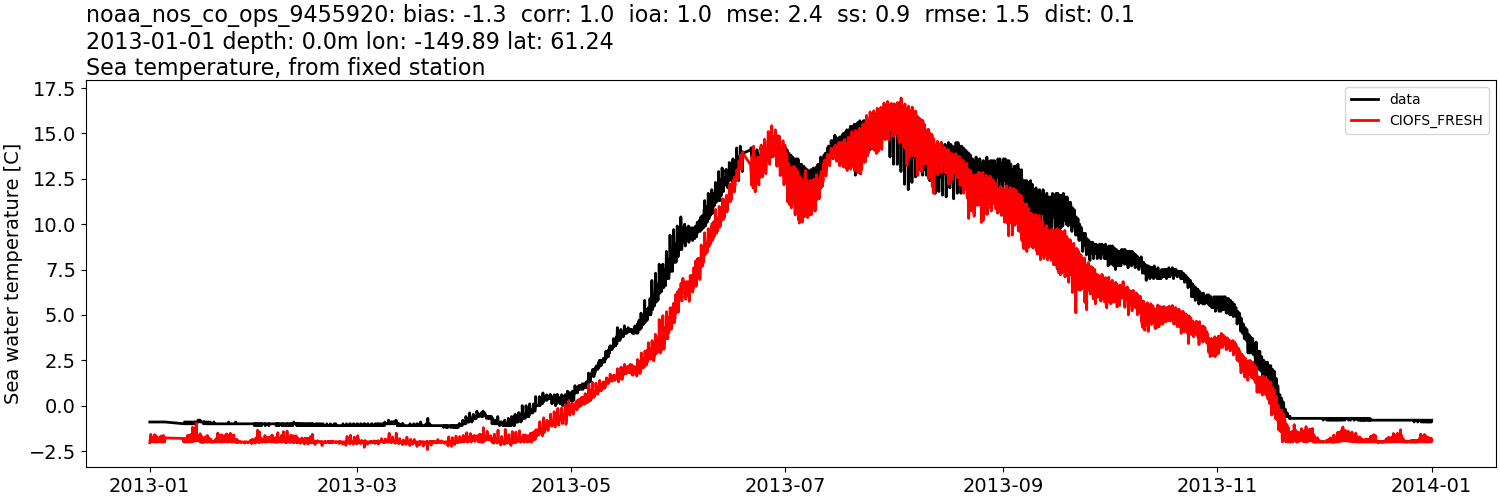
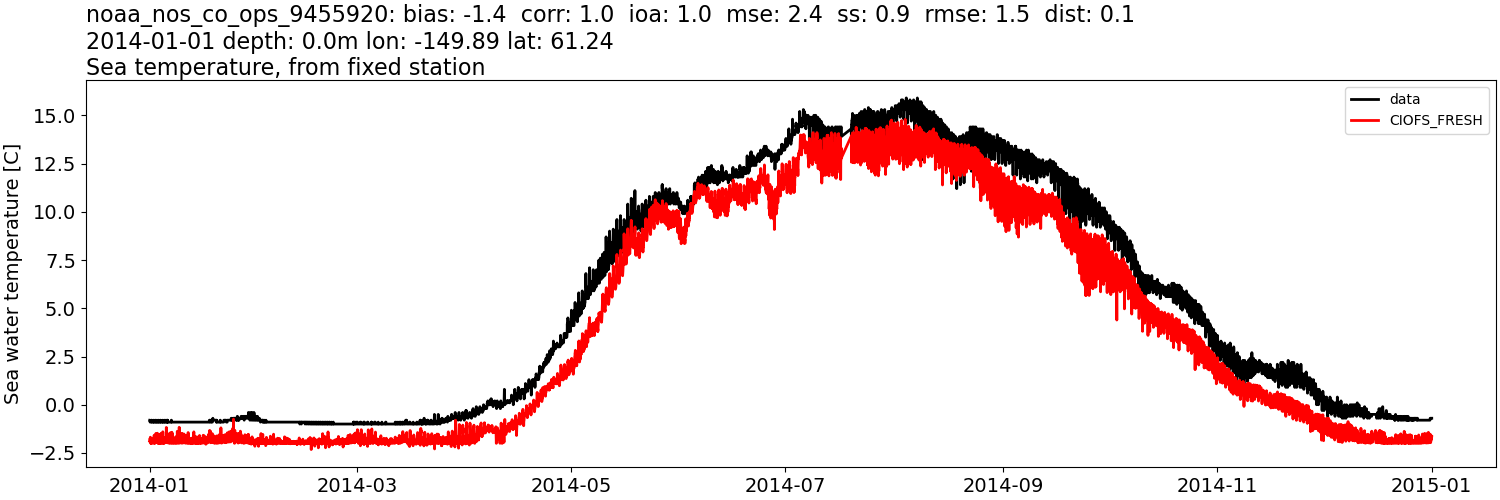
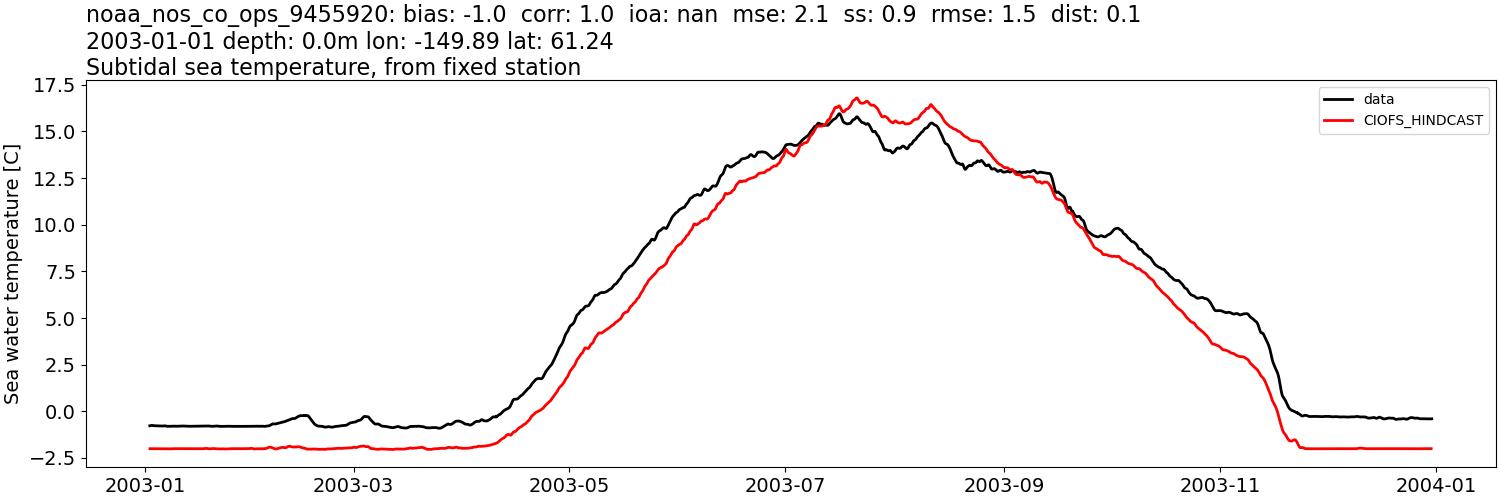
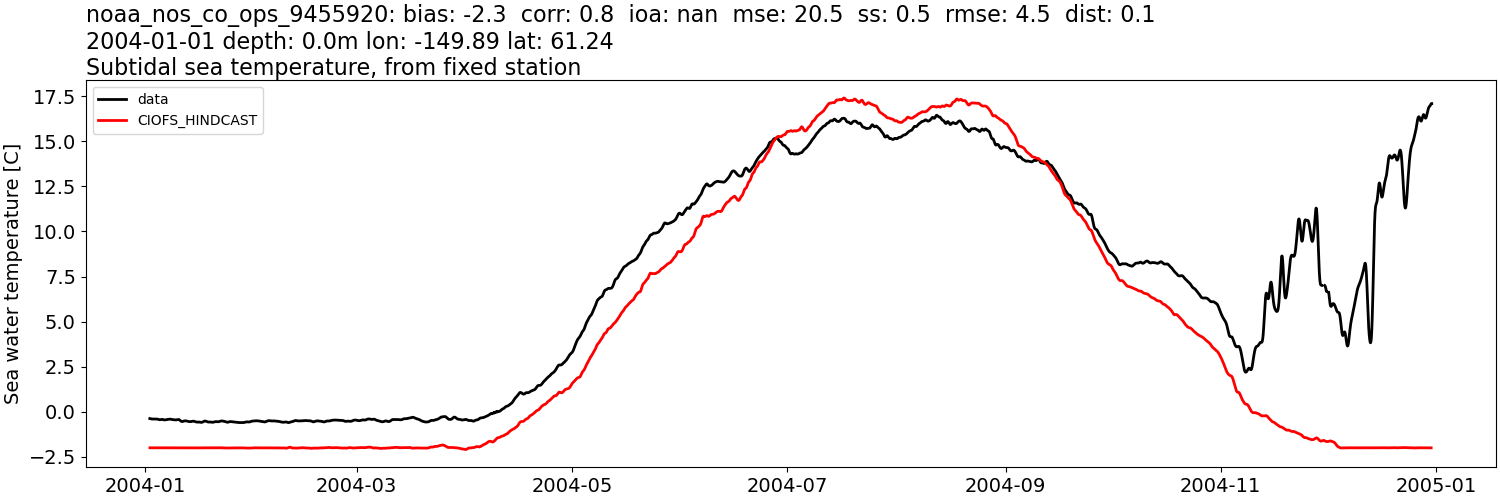
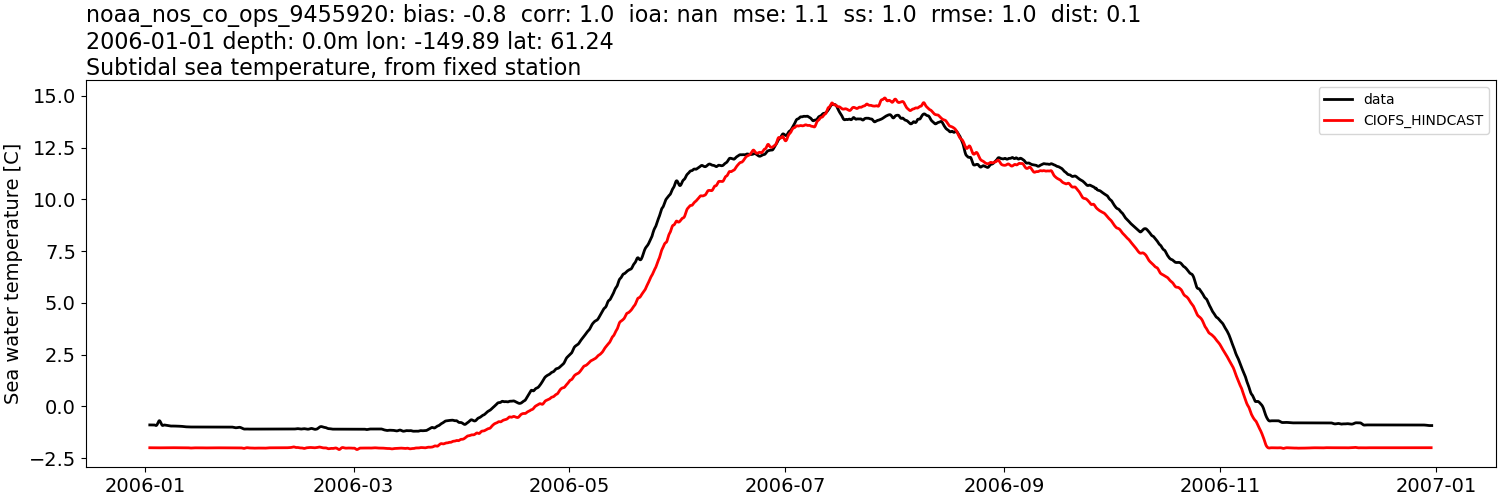
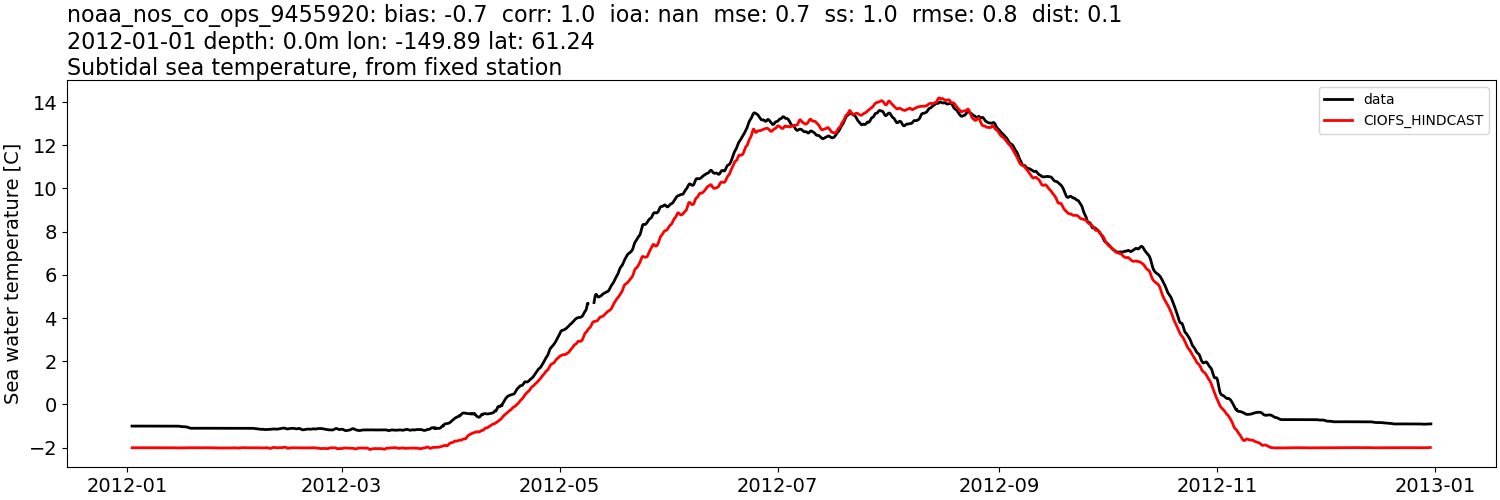
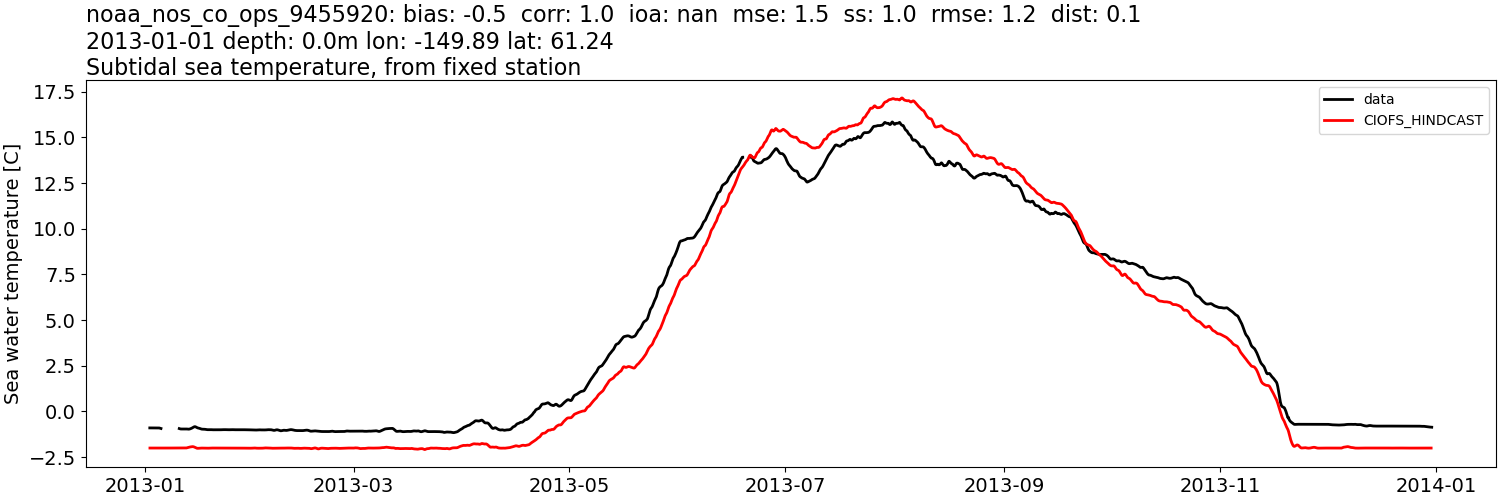
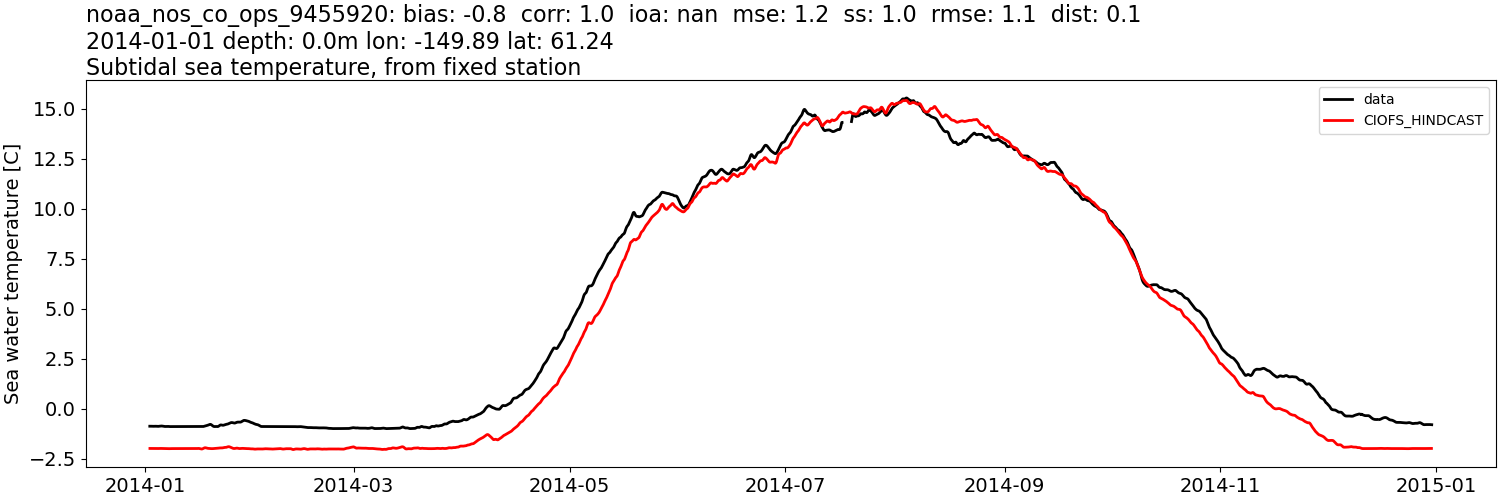
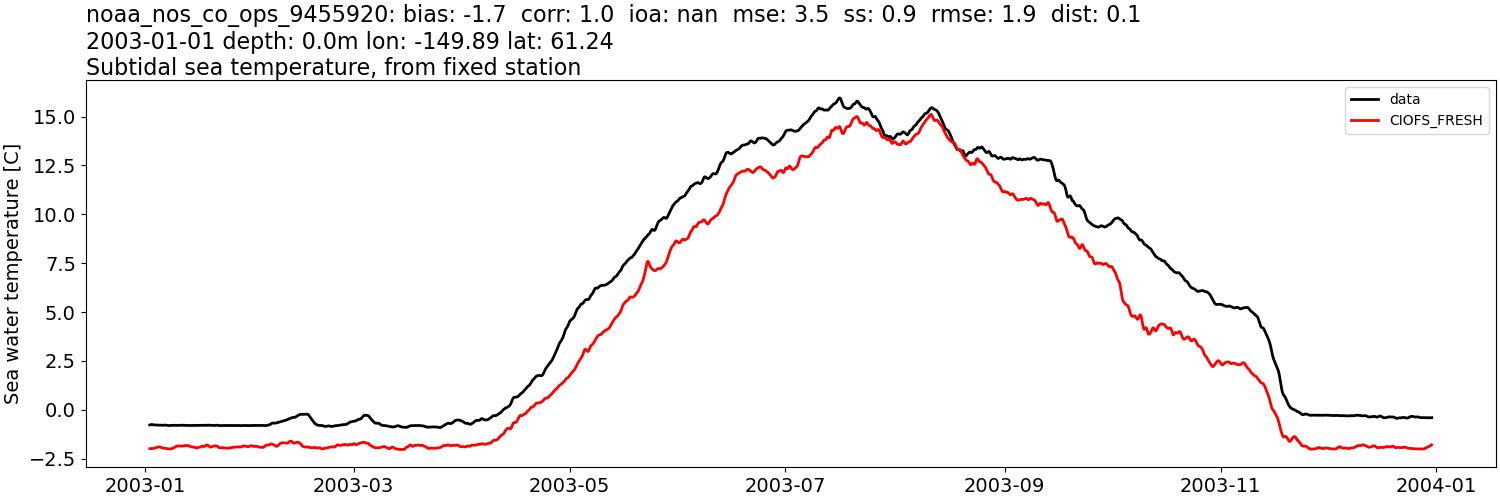
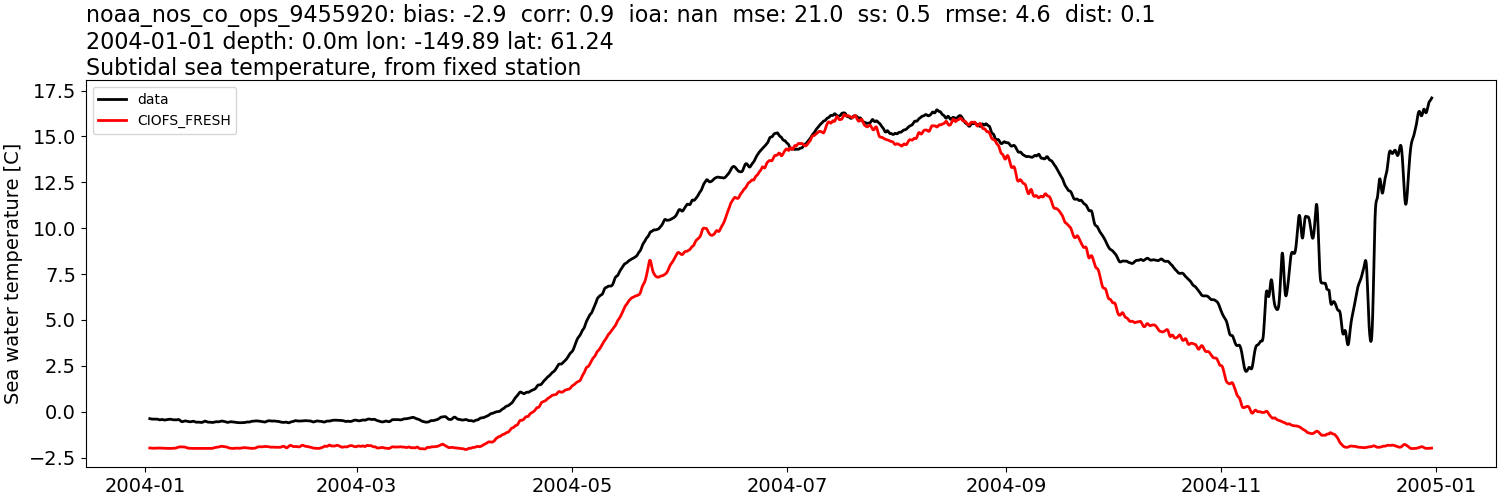
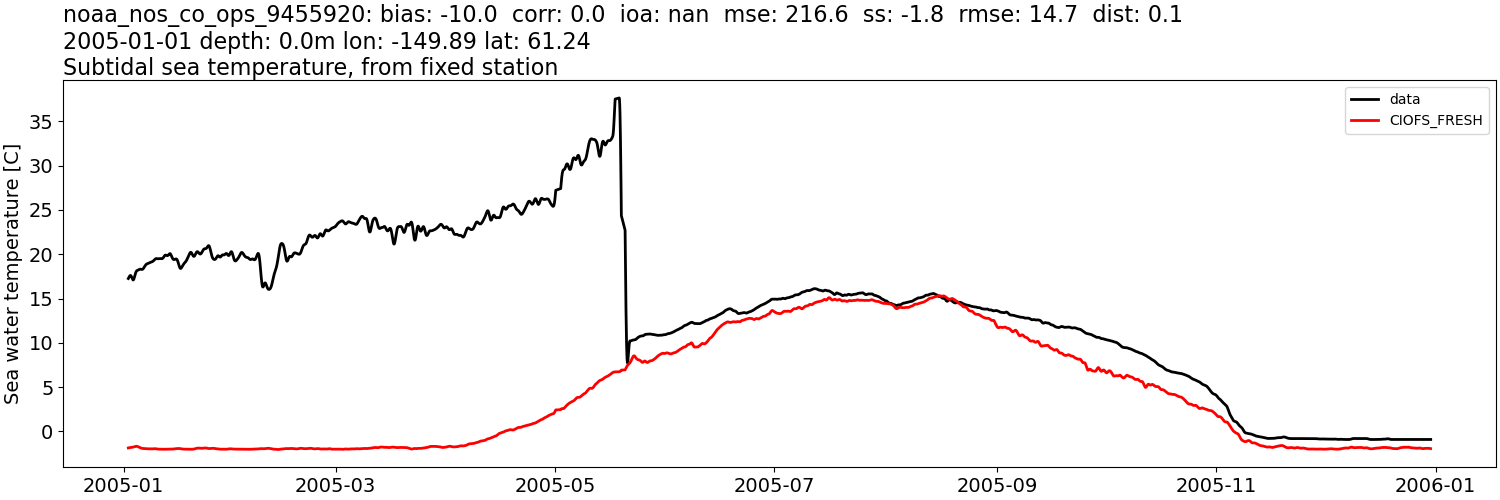
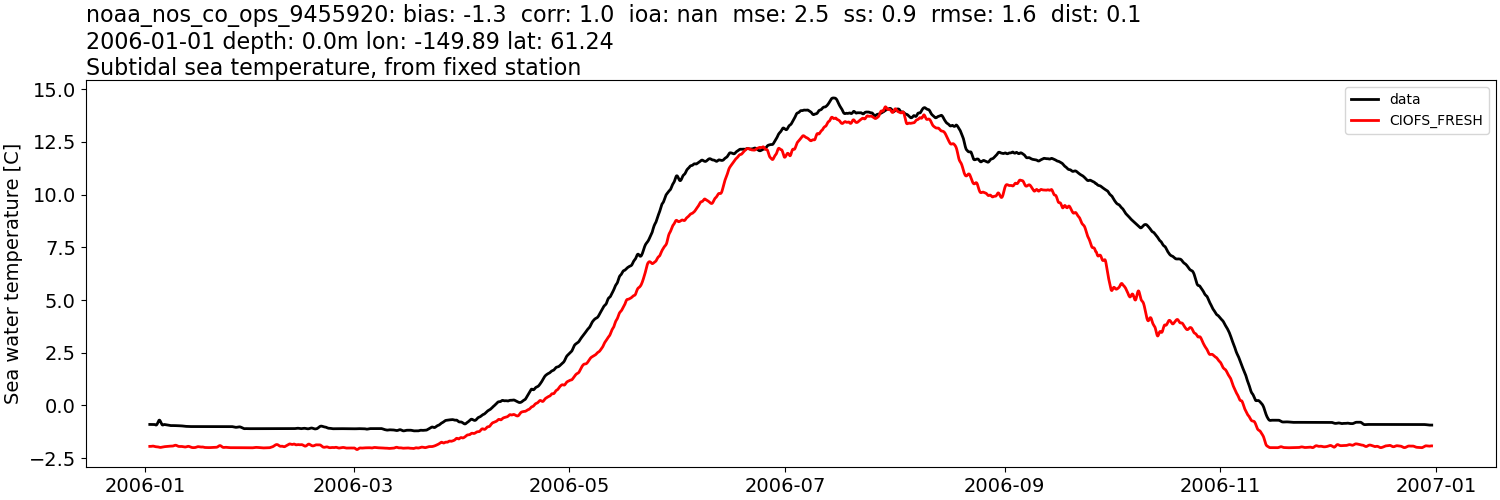
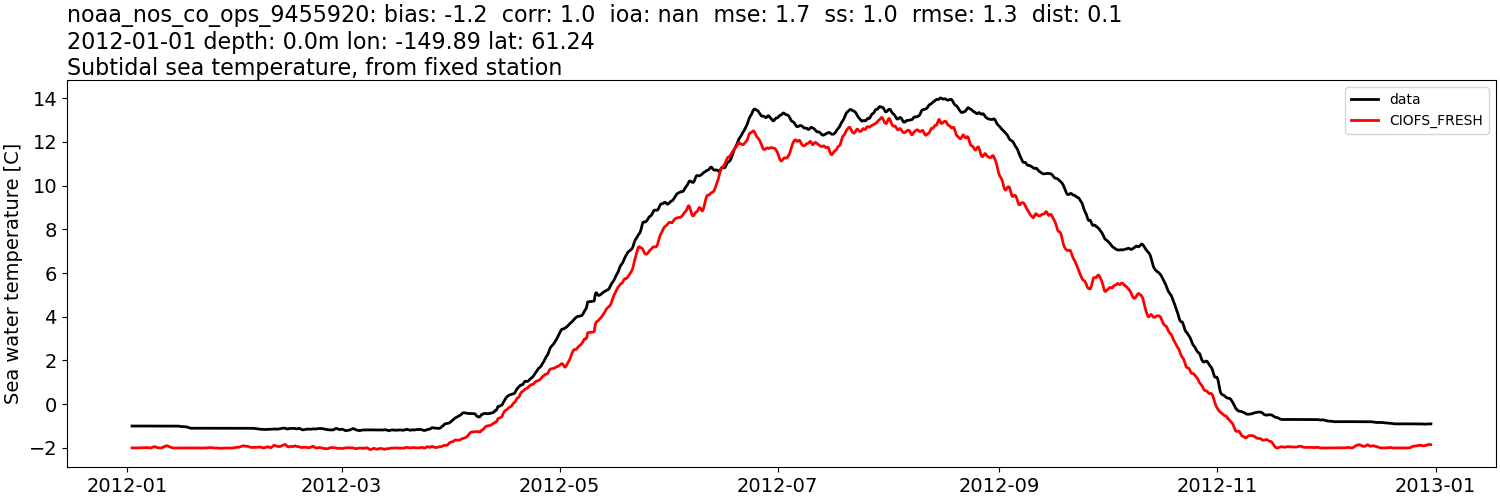
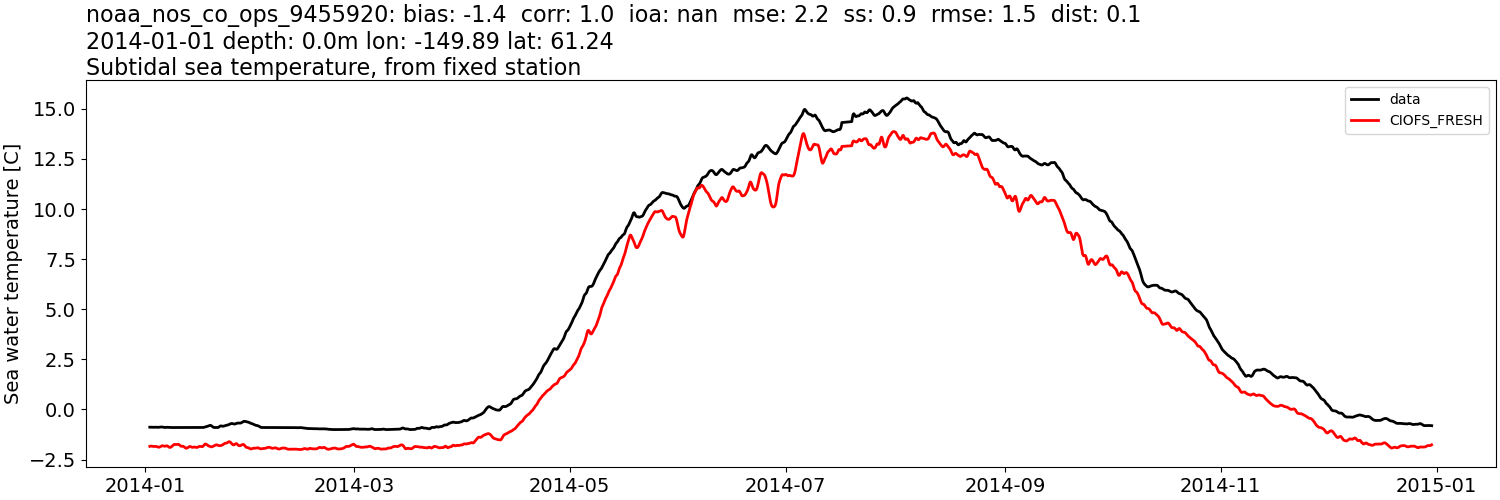
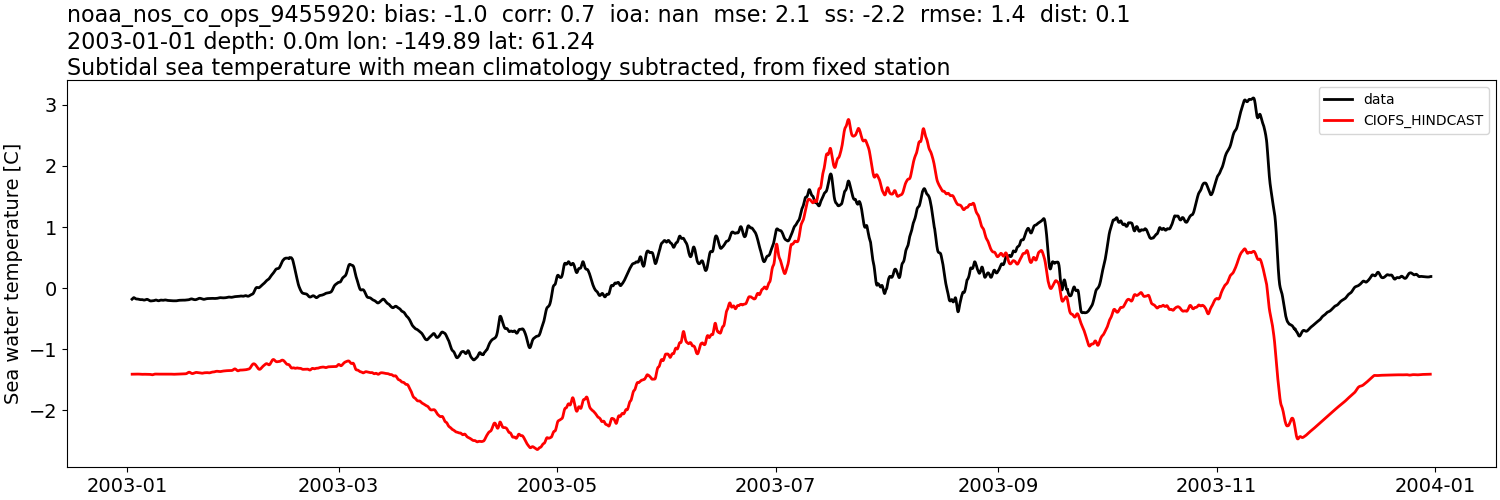
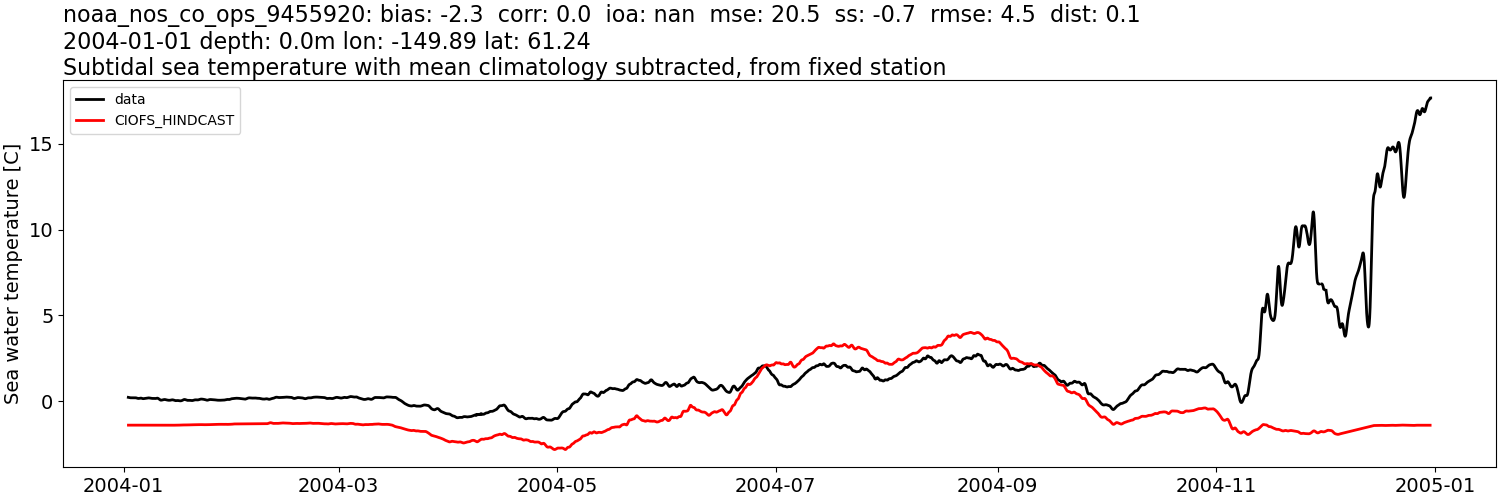
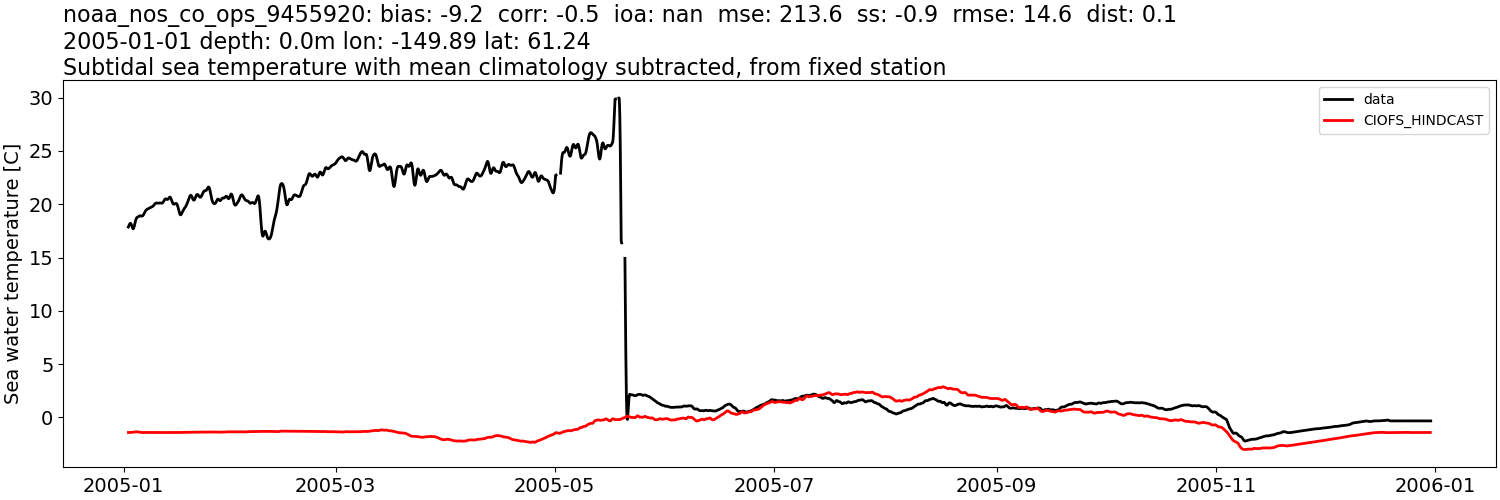
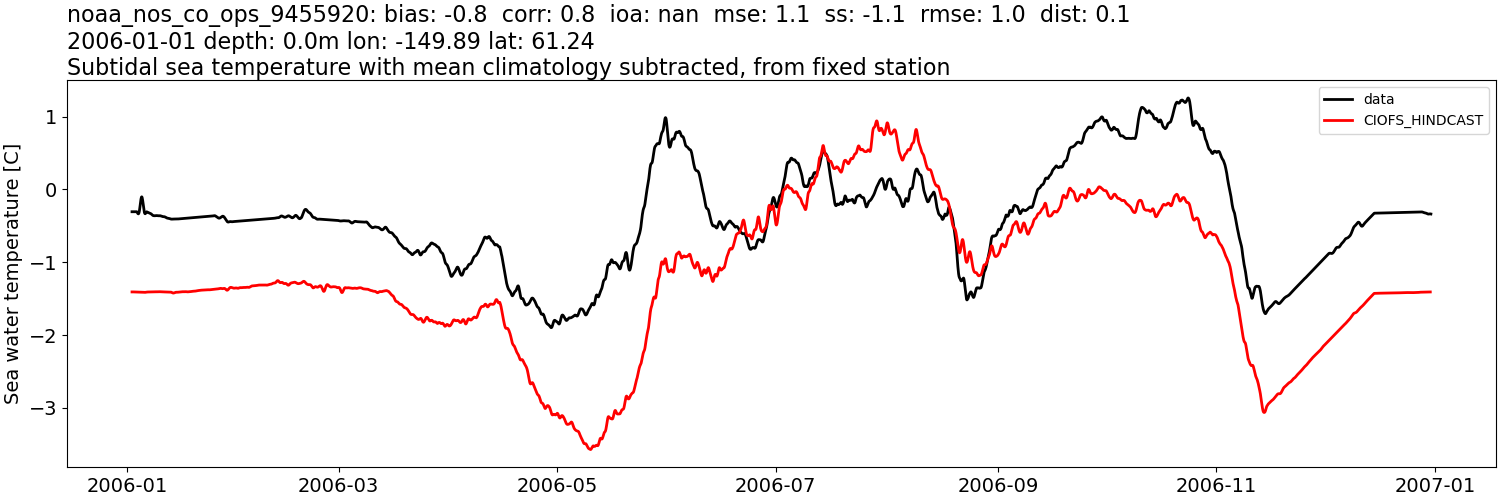
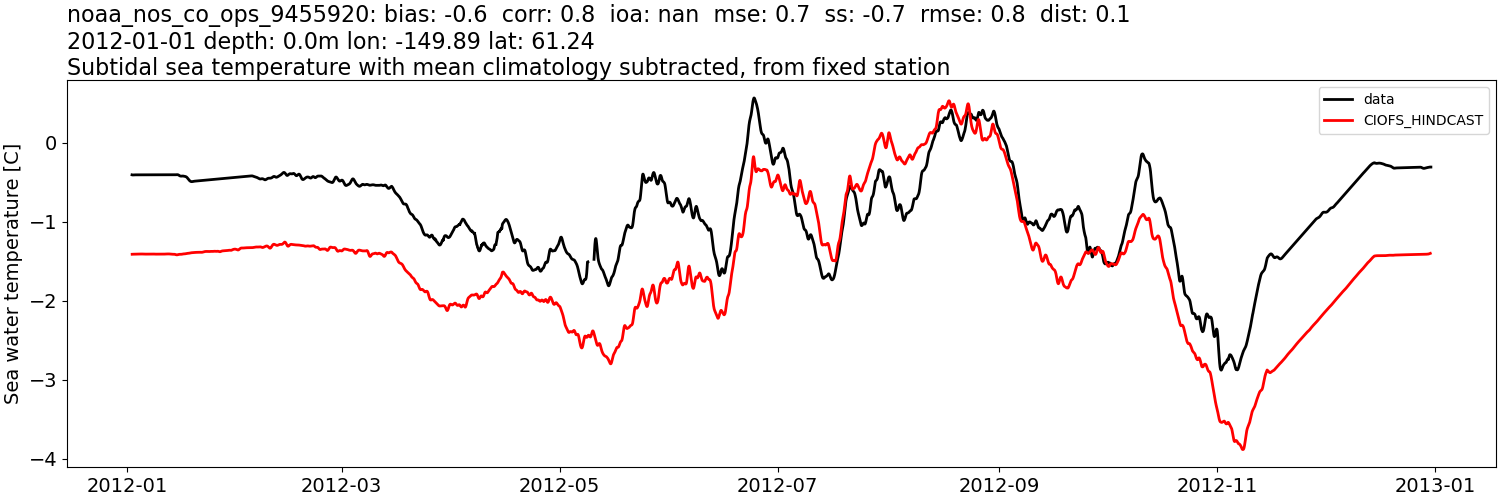
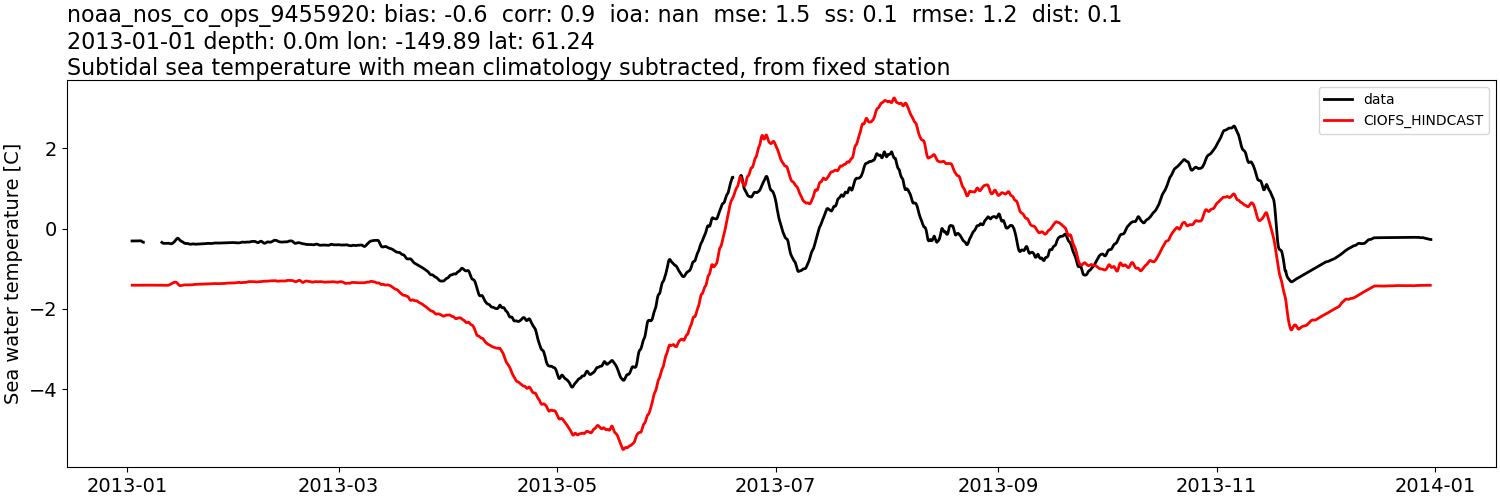
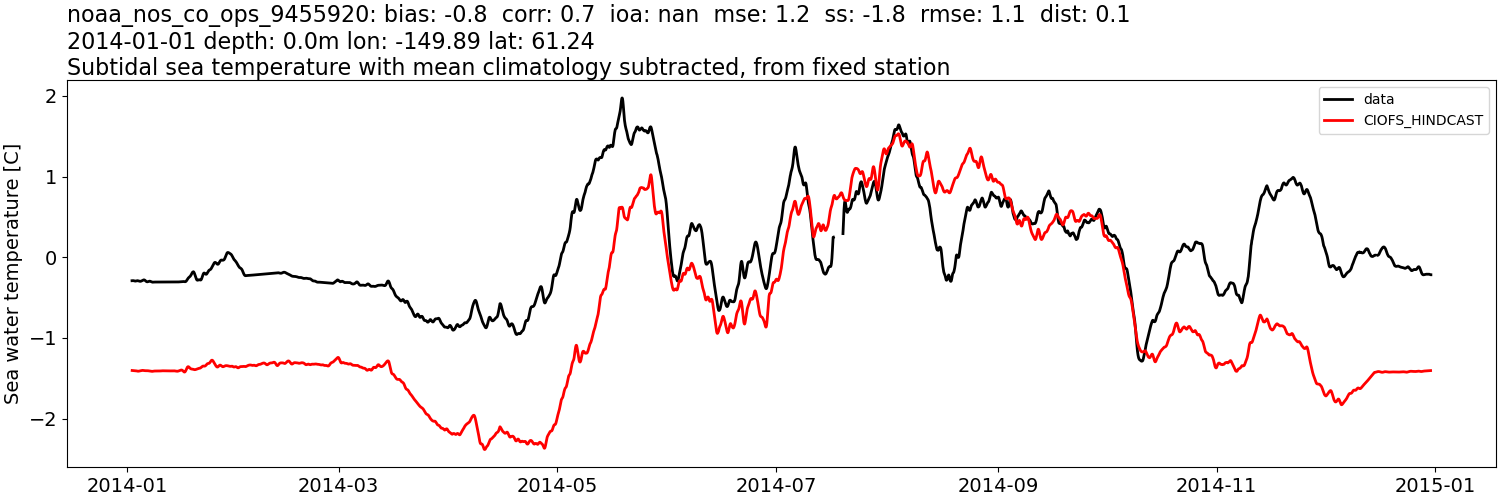
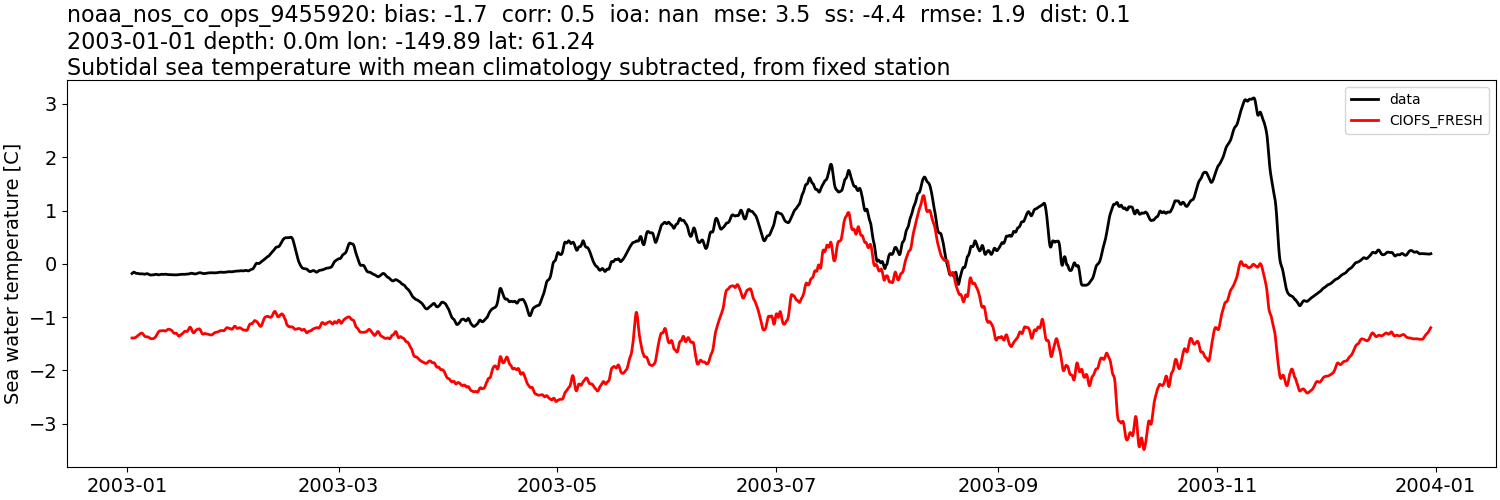
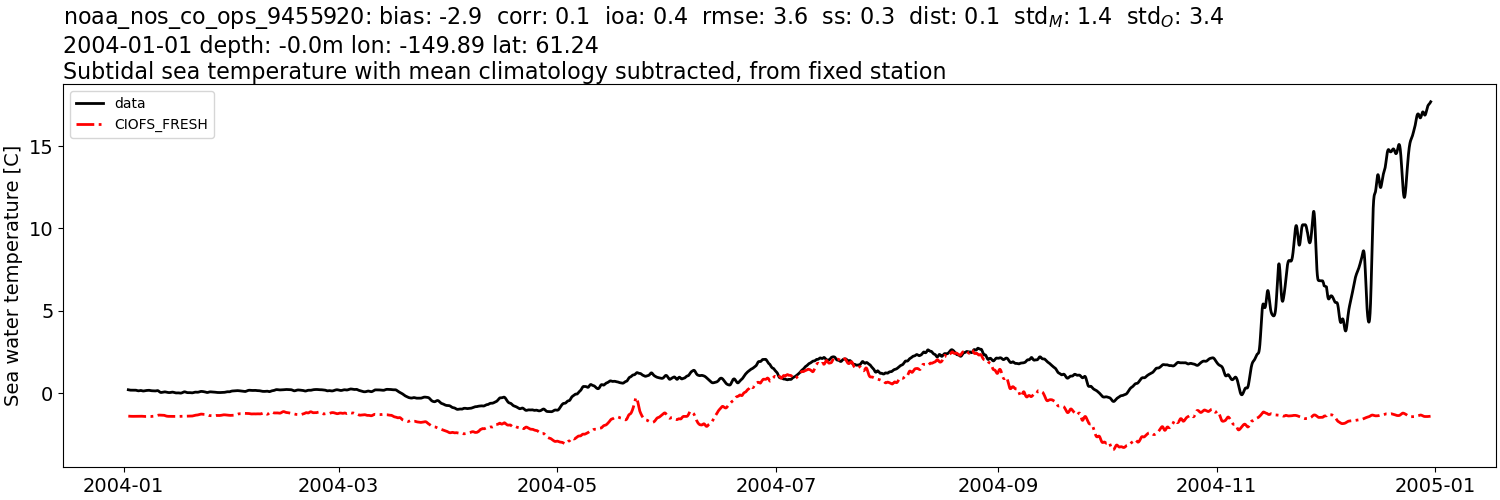
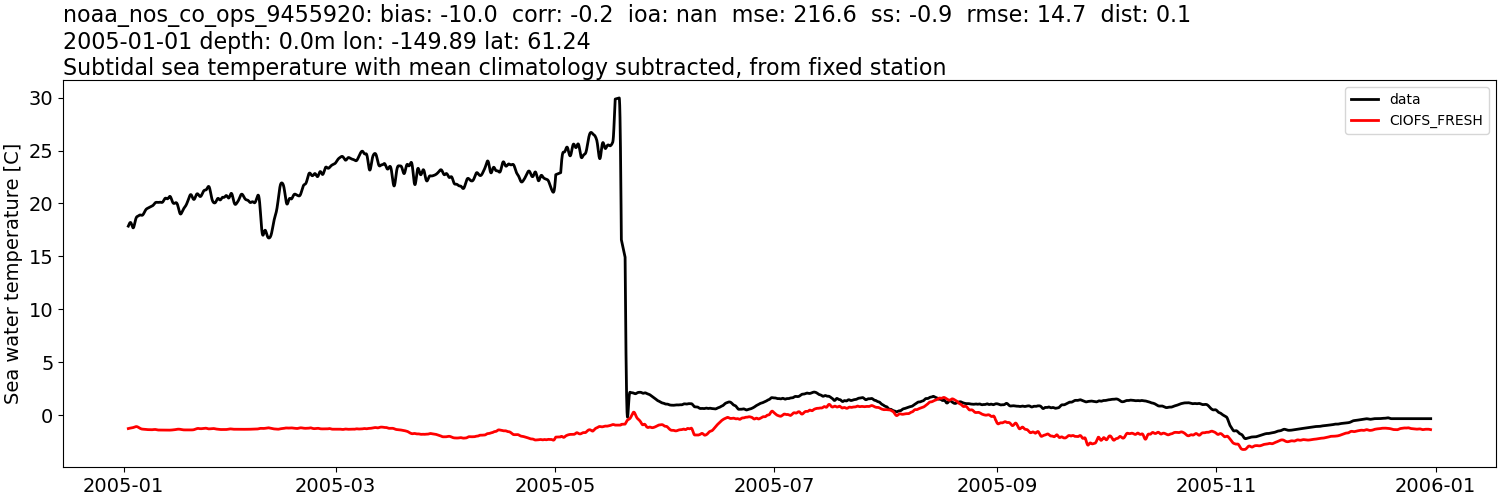
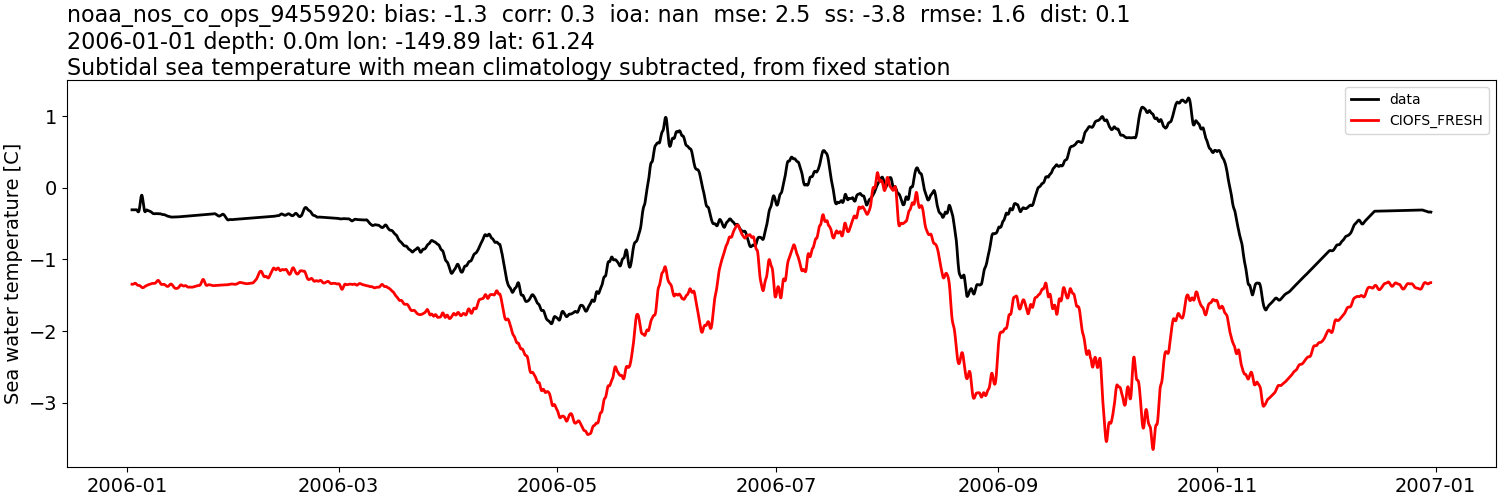
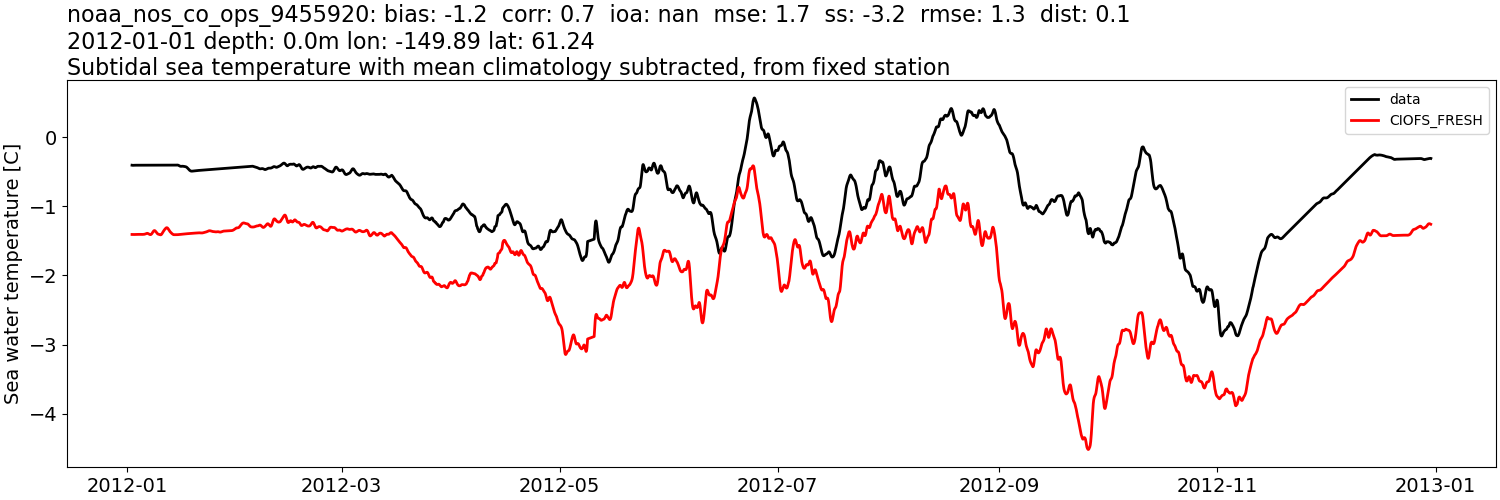
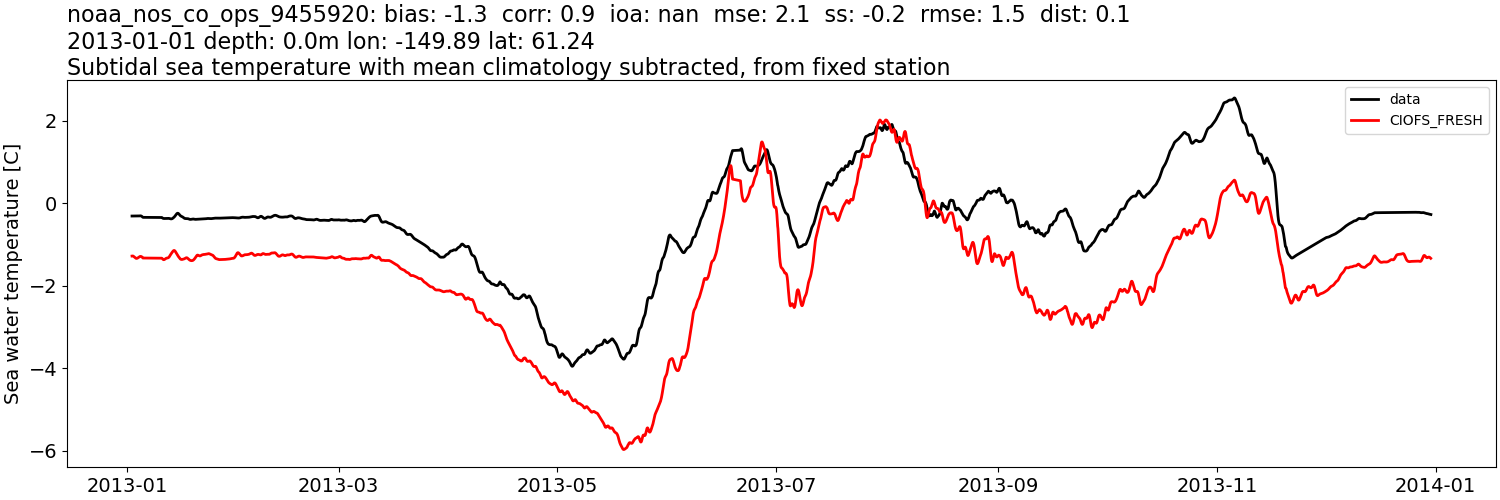
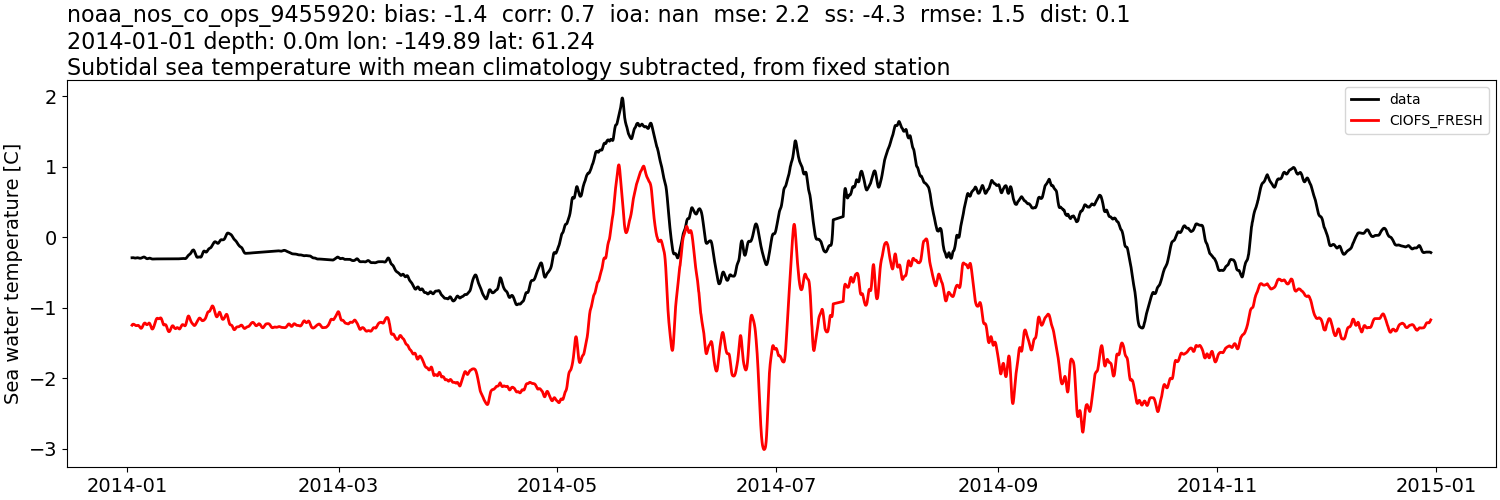
noaa_nos_co_ops_9455920#
Sea surface height: mean subtracted#
CIOFS_HINDCAST#
Comparison plots by year
2003
2004
2005
2006
2012
2013
2014
CIOFS_FRESH#
Comparison plots by year
2003
2004
2005
2006
2012
2013
2014
Sea surface height: mean subtracted, then tidally-filtered#
CIOFS_HINDCAST#
Comparison plots by year
2003
2004
2005
2006
2012
2013
2014
CIOFS_FRESH#
Comparison plots by year
2003
2004
2005
2006
2012
2013
2014
Sea water temperature:#
CIOFS_HINDCAST#
Comparison plots by year
2003
2004
2005

2006
2012
2013
2014
CIOFS_FRESH#
Comparison plots by year
2003
2004
2005
2006
2012
2013
2014
Sea water temperature: tidally-filtered#
CIOFS_HINDCAST#
Comparison plots by year
2003
2004
2005

2006
2012
2013
2014
CIOFS_FRESH#
Comparison plots by year
2003
2004
2005
2006
2012
2013

2014
Sea water temperature: tidally-filtered, then monthly mean from data subtracted#
CIOFS_HINDCAST#
Comparison plots by year
2003
2004
2005
2006
2012
2013
2014
CIOFS_FRESH#
Comparison plots by year
2003
2004
2005
2006
2012
2013
2014
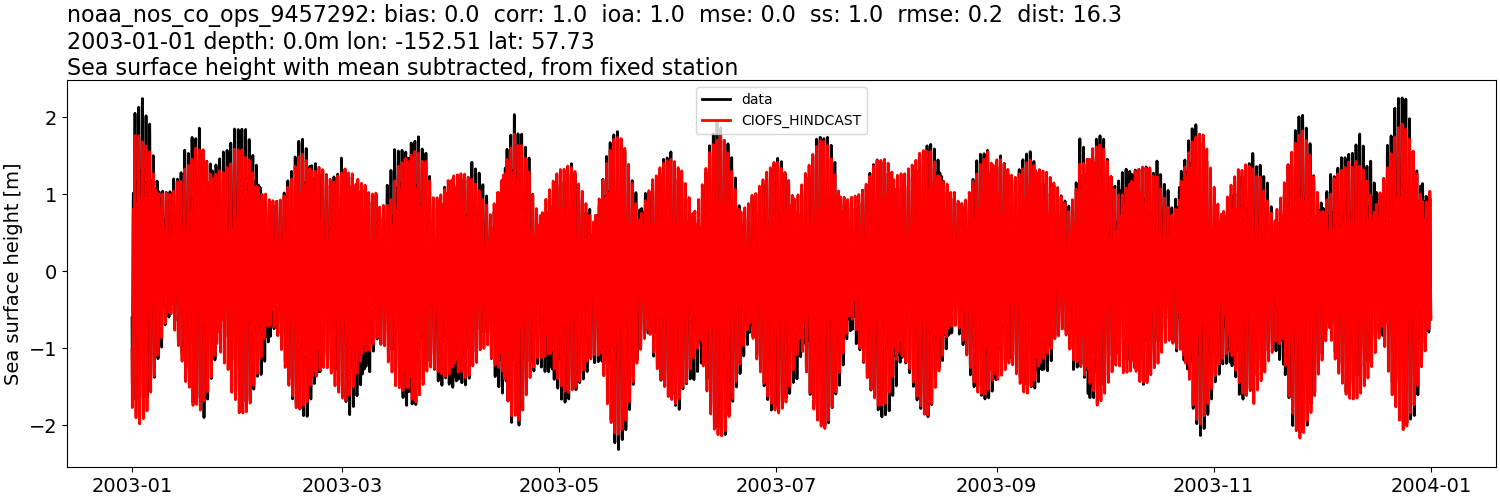
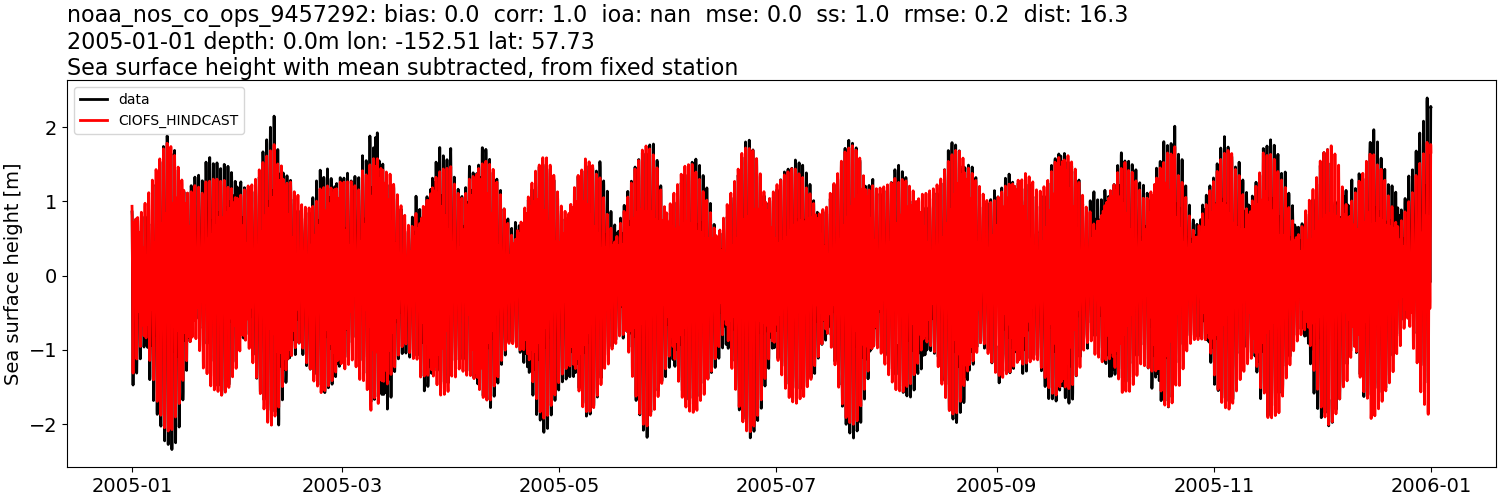
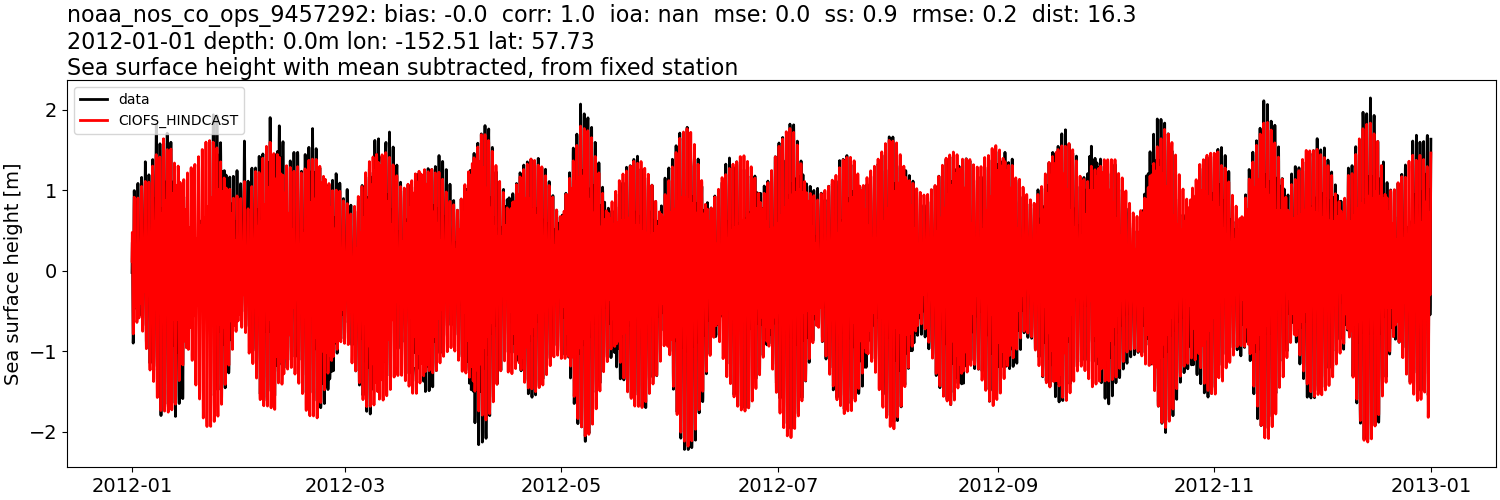
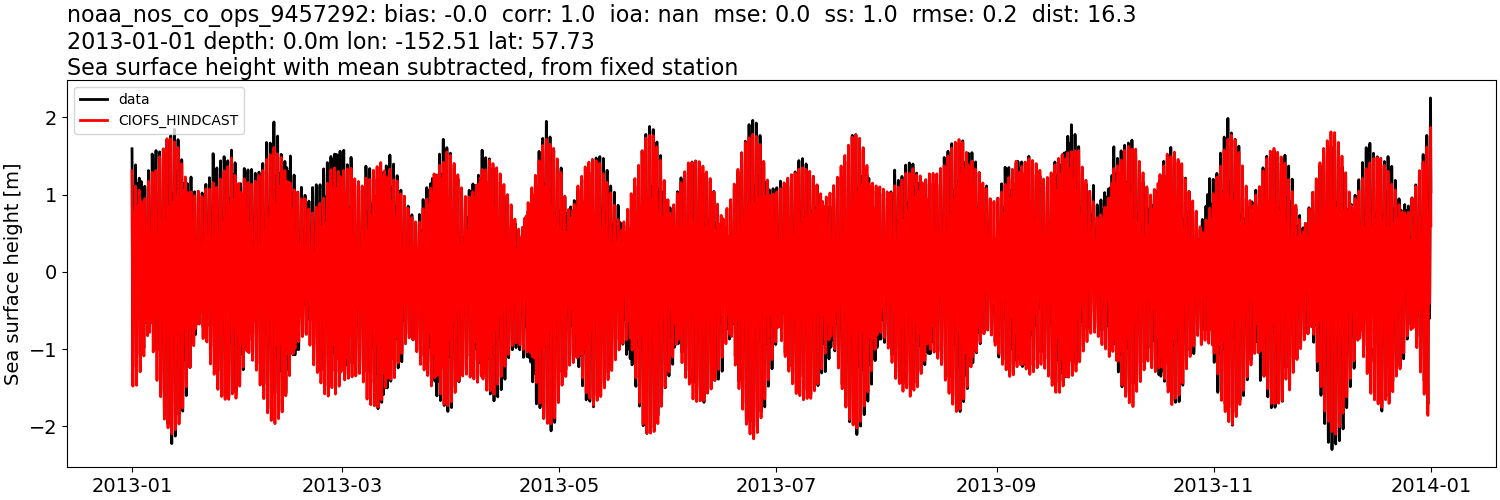
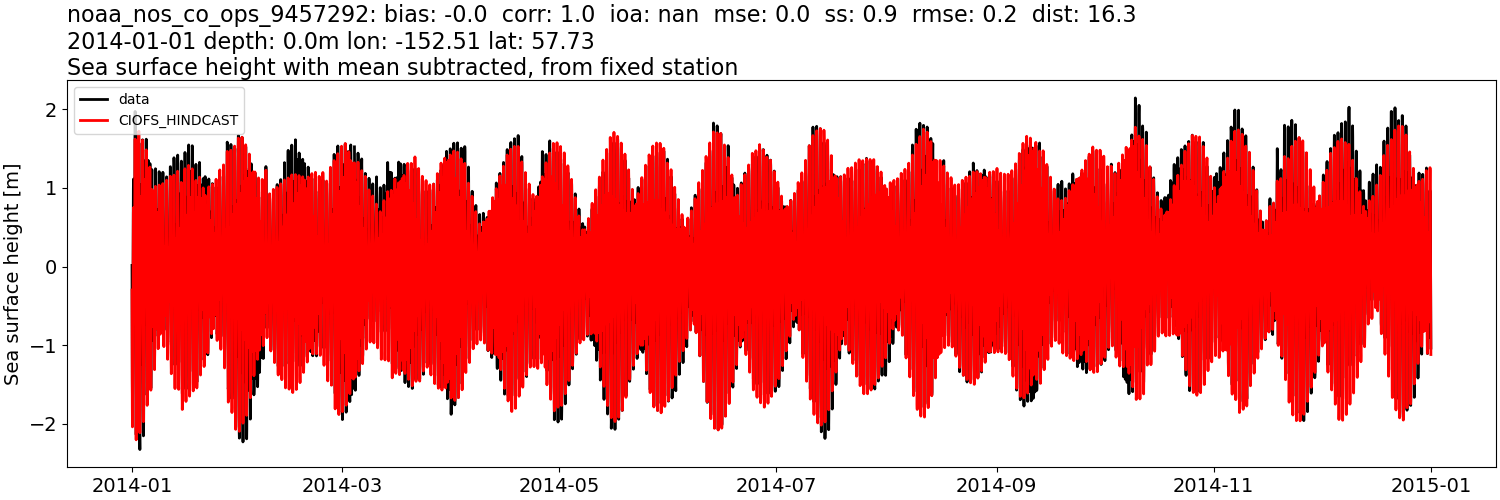
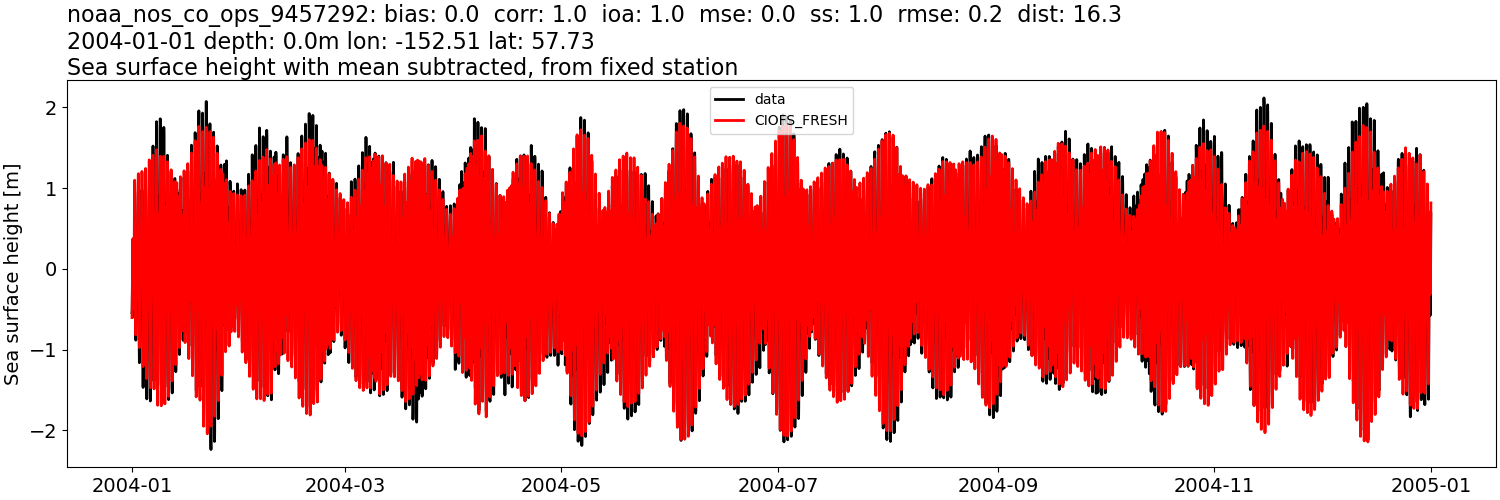
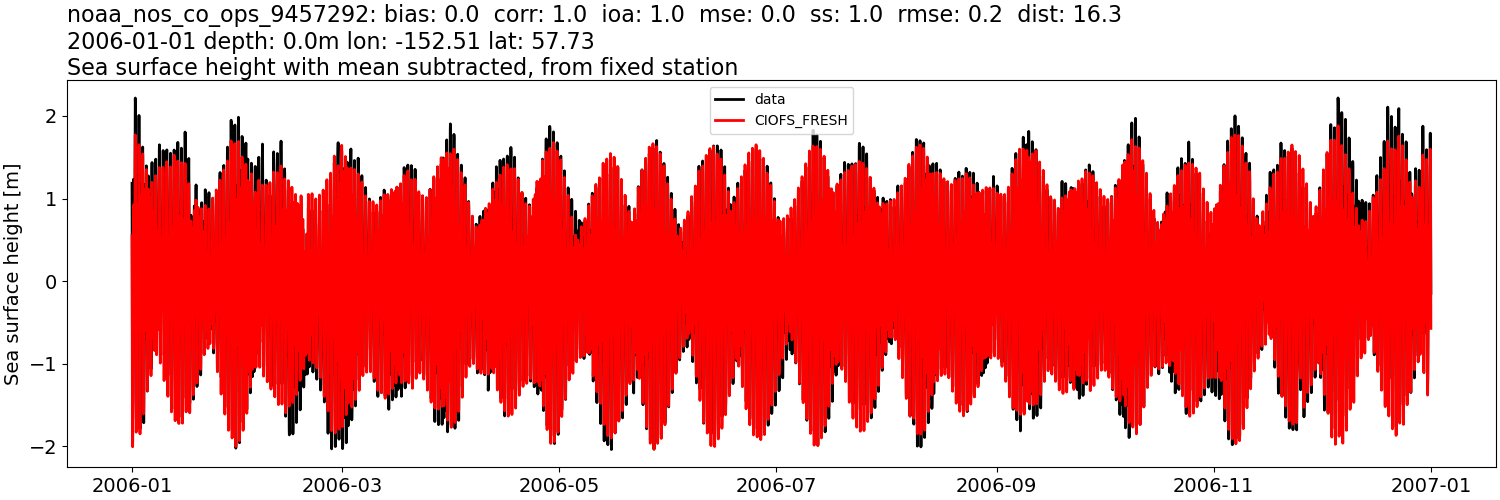
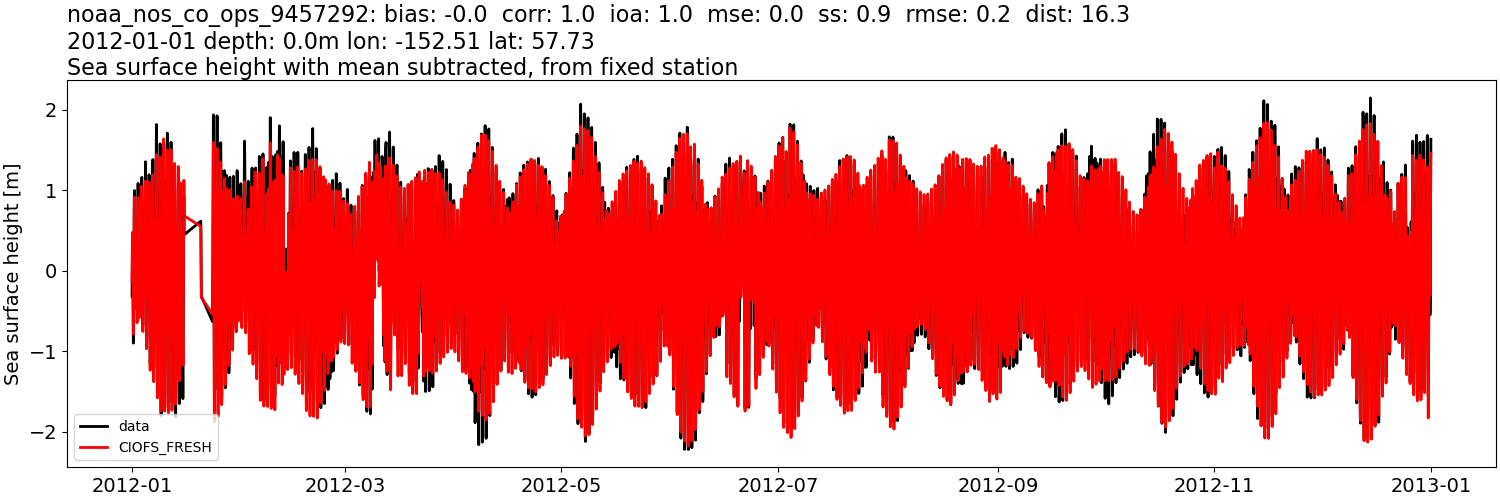
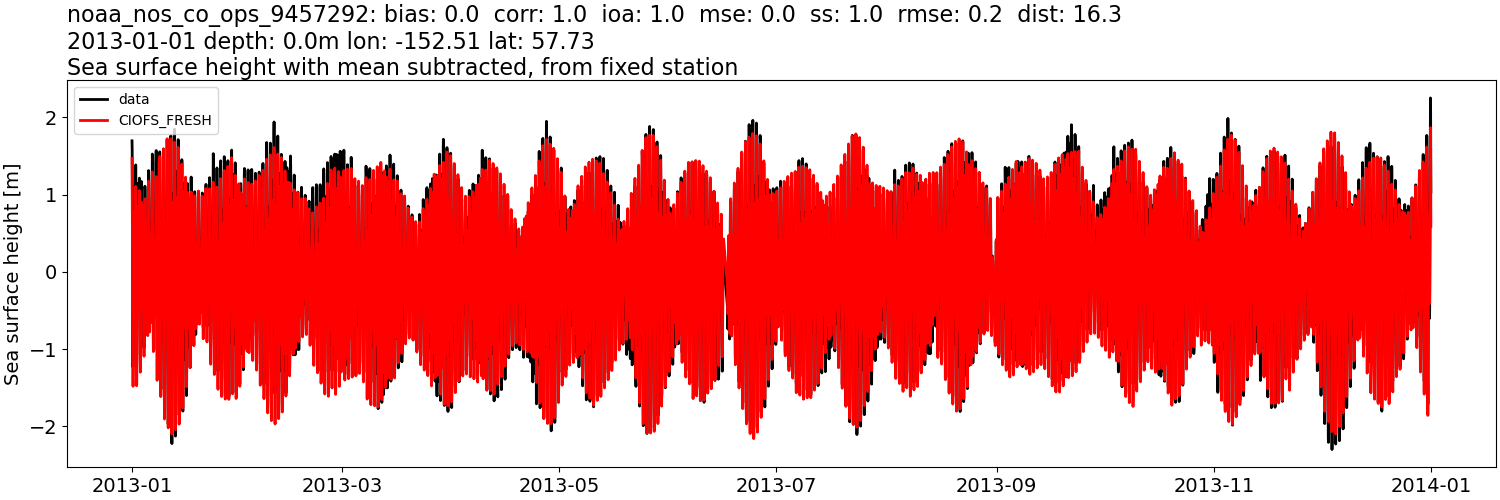
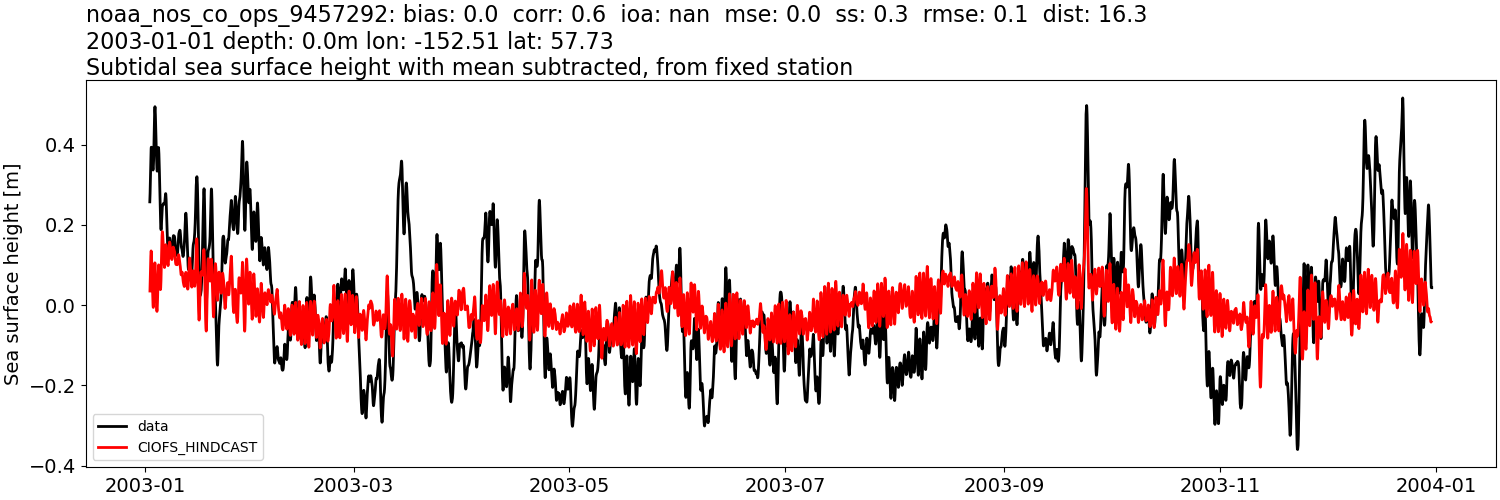
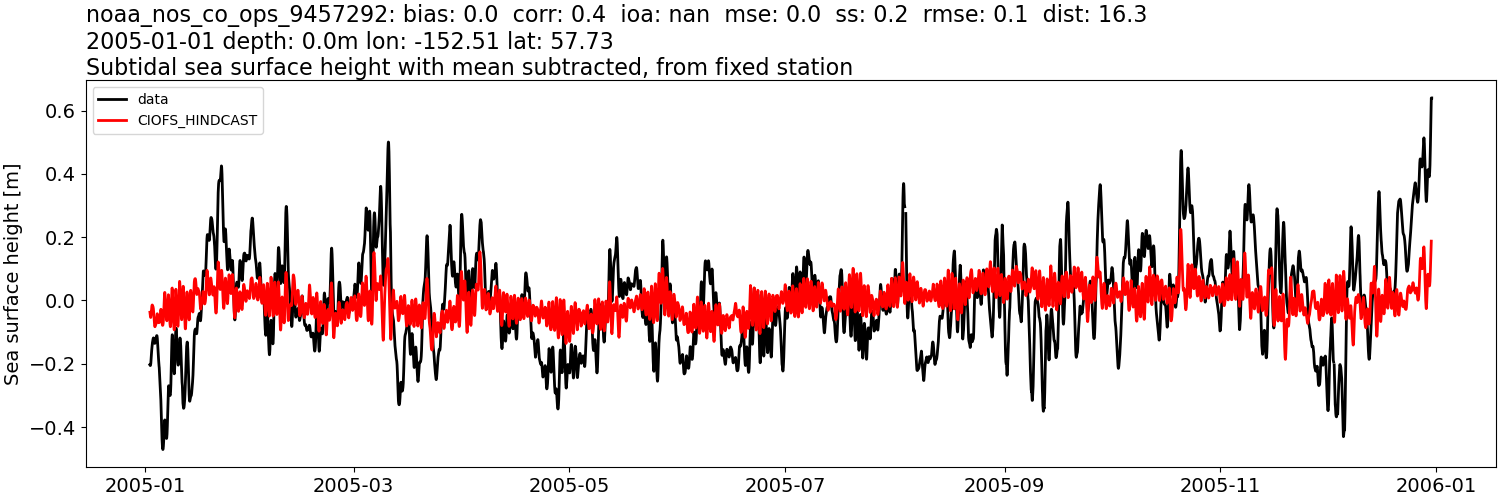
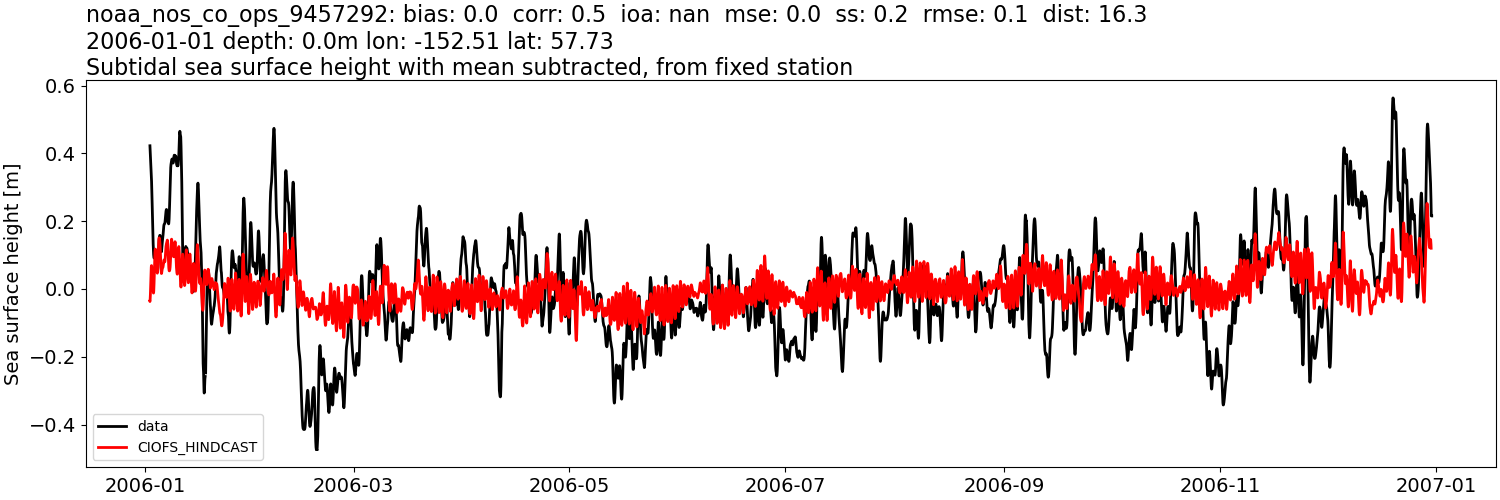
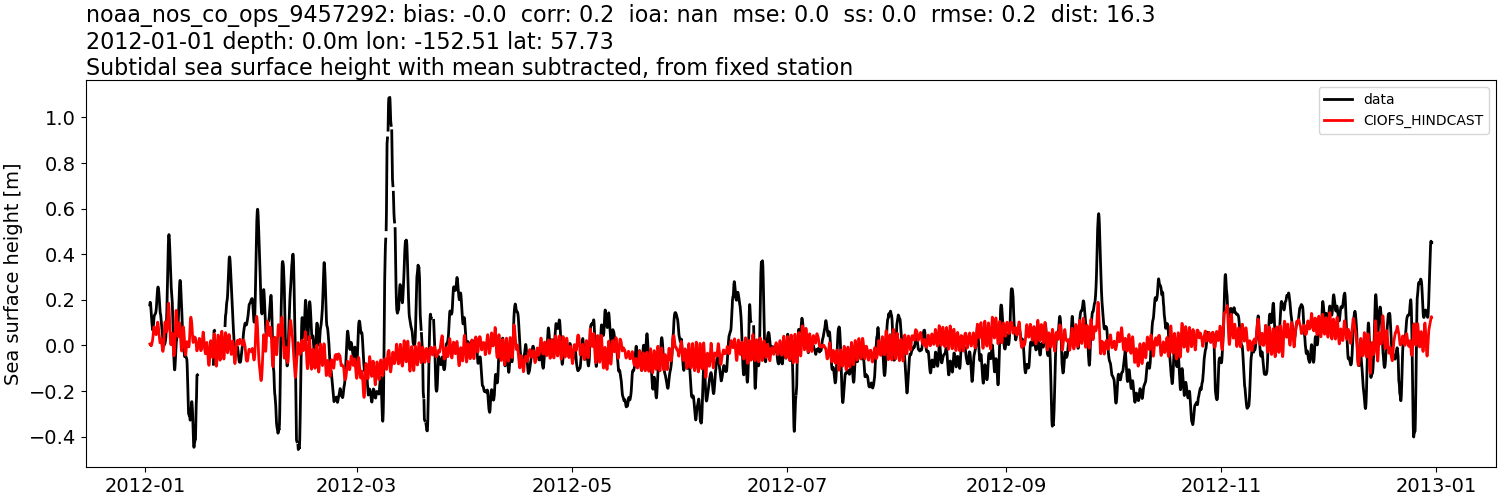
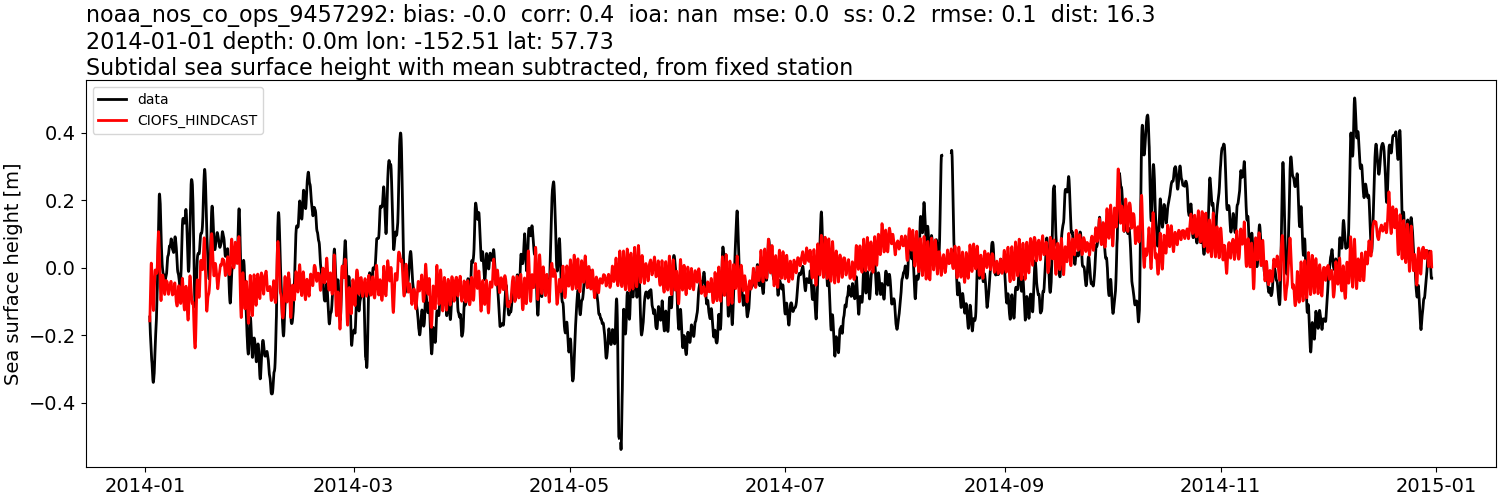
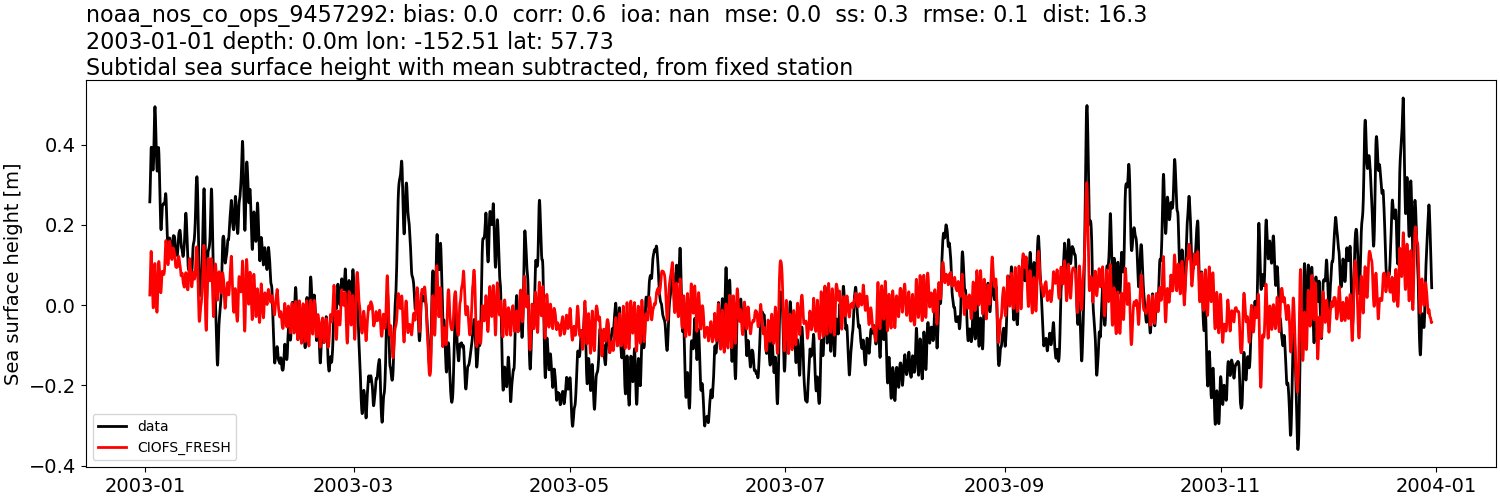
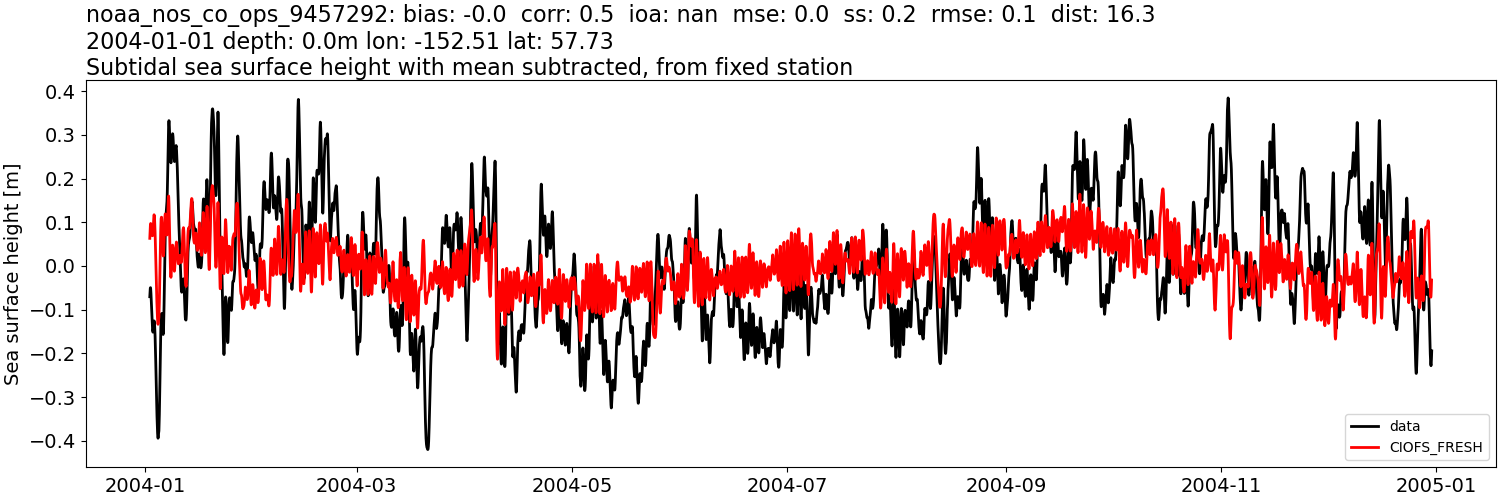
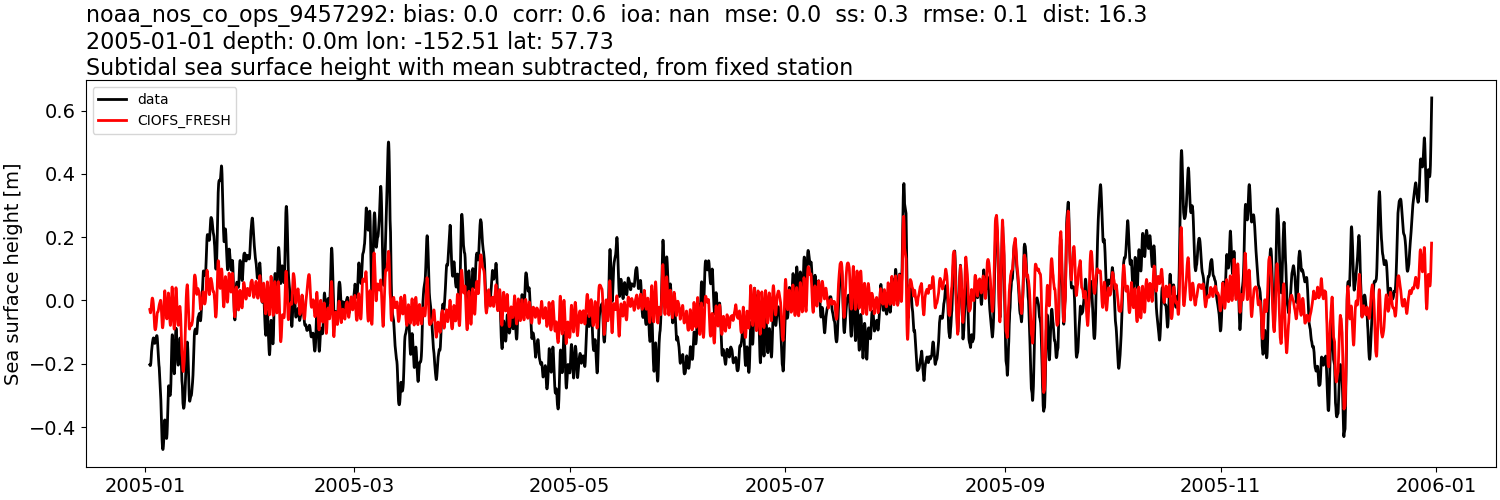
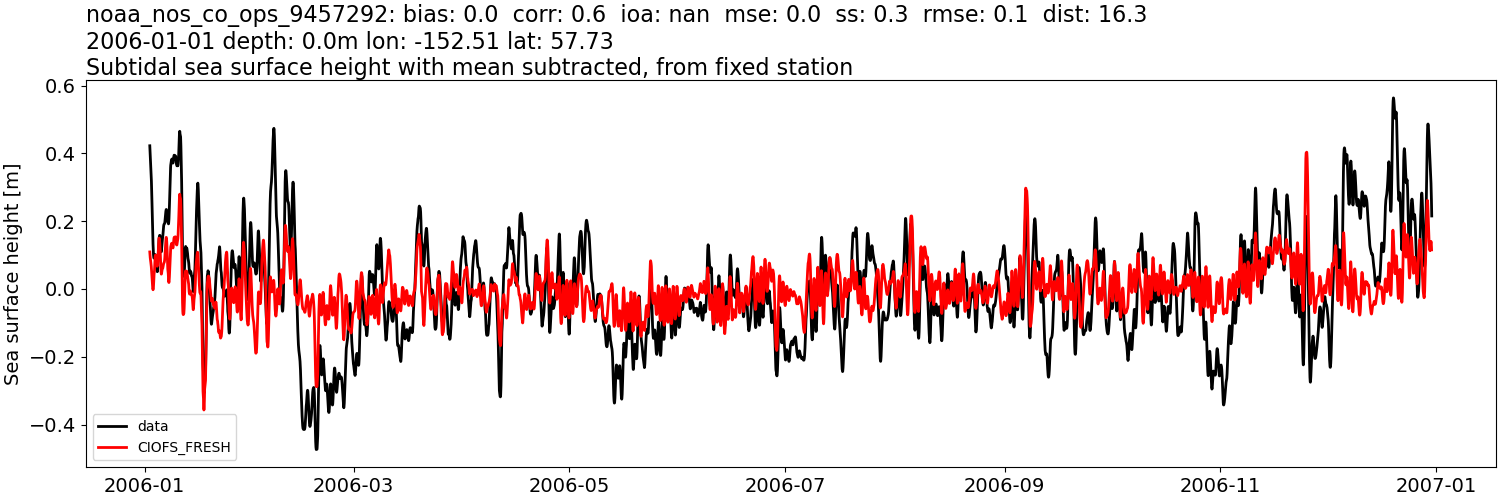
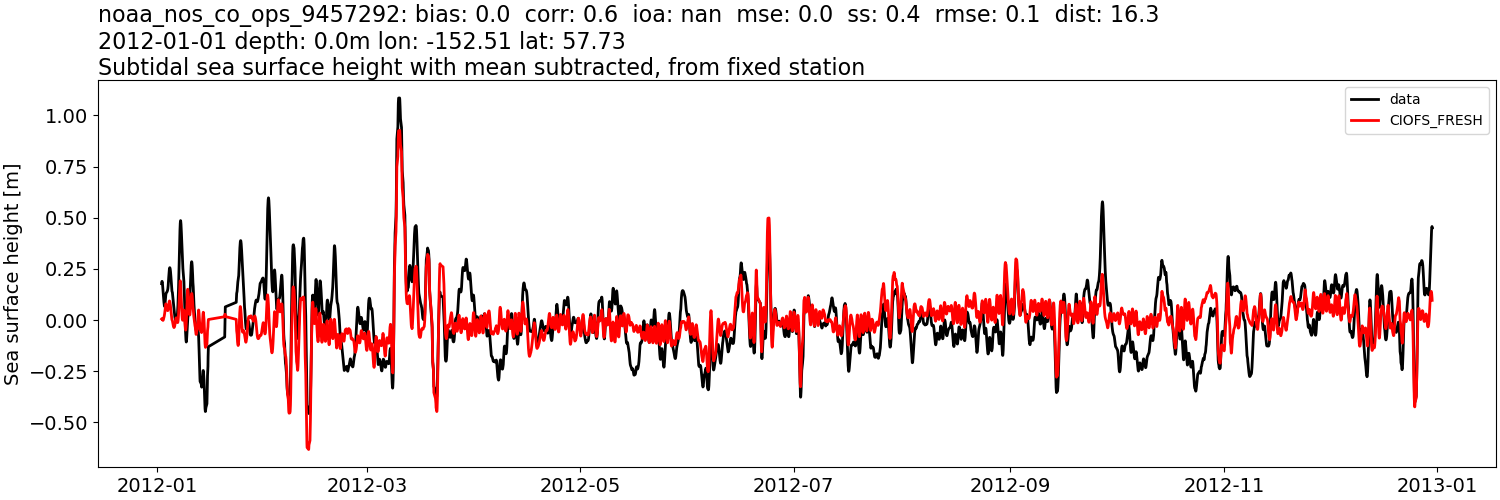
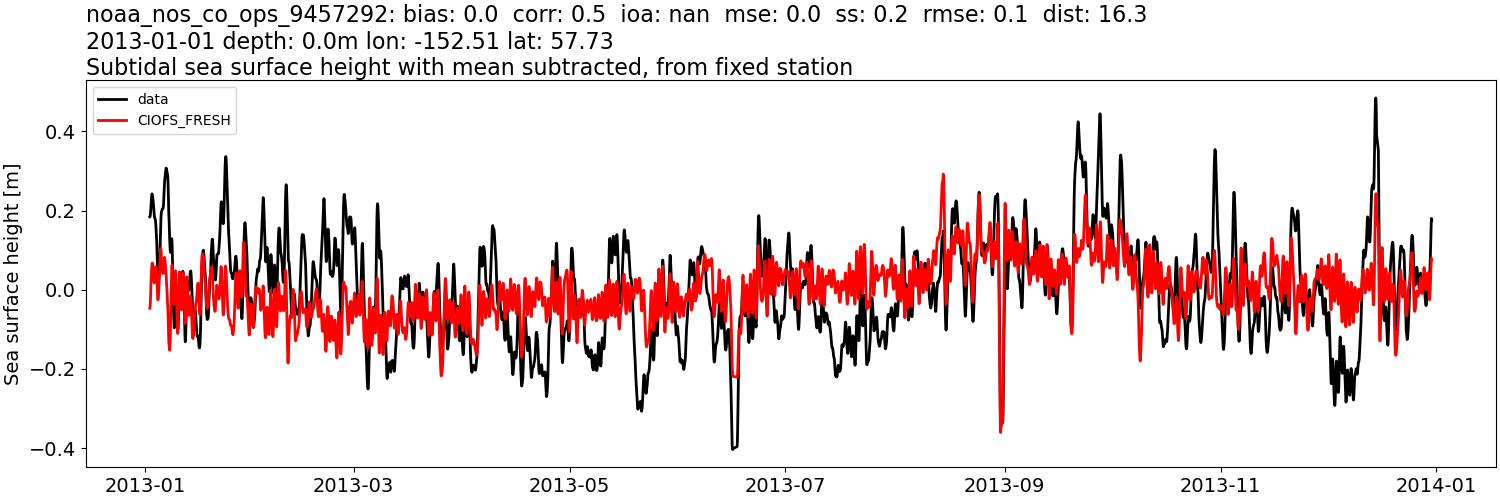
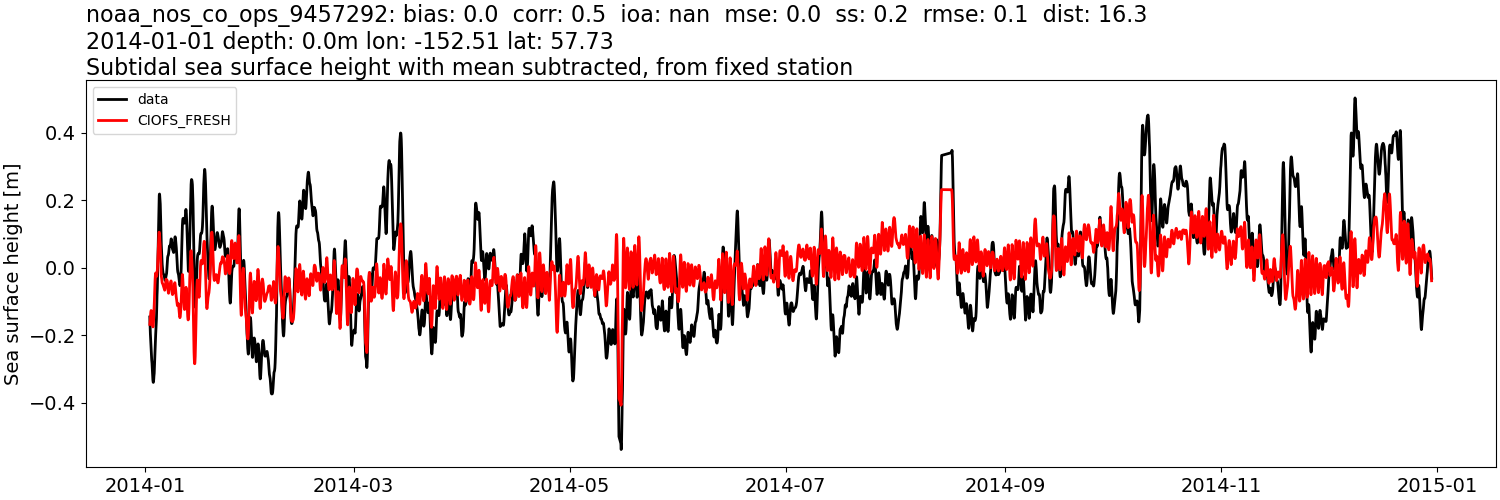
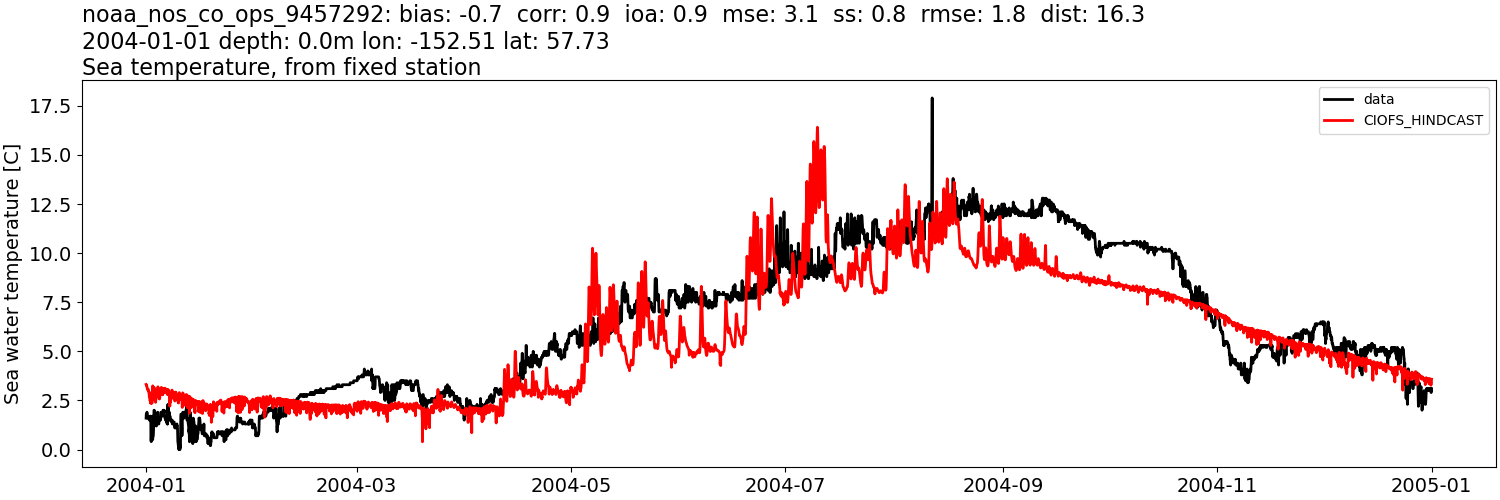
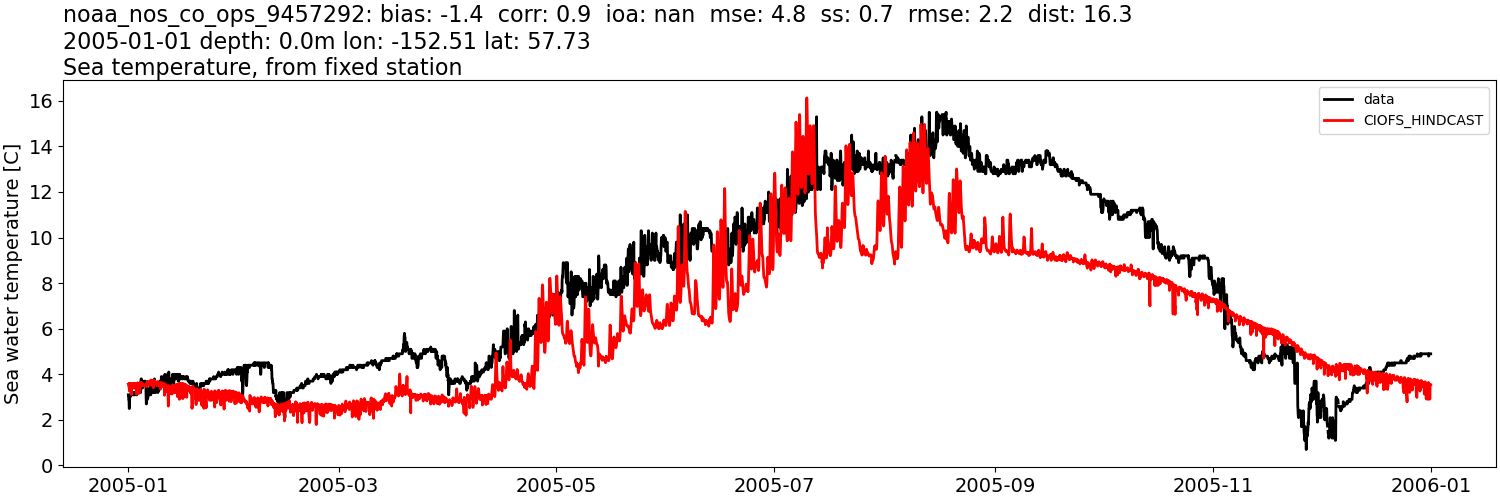
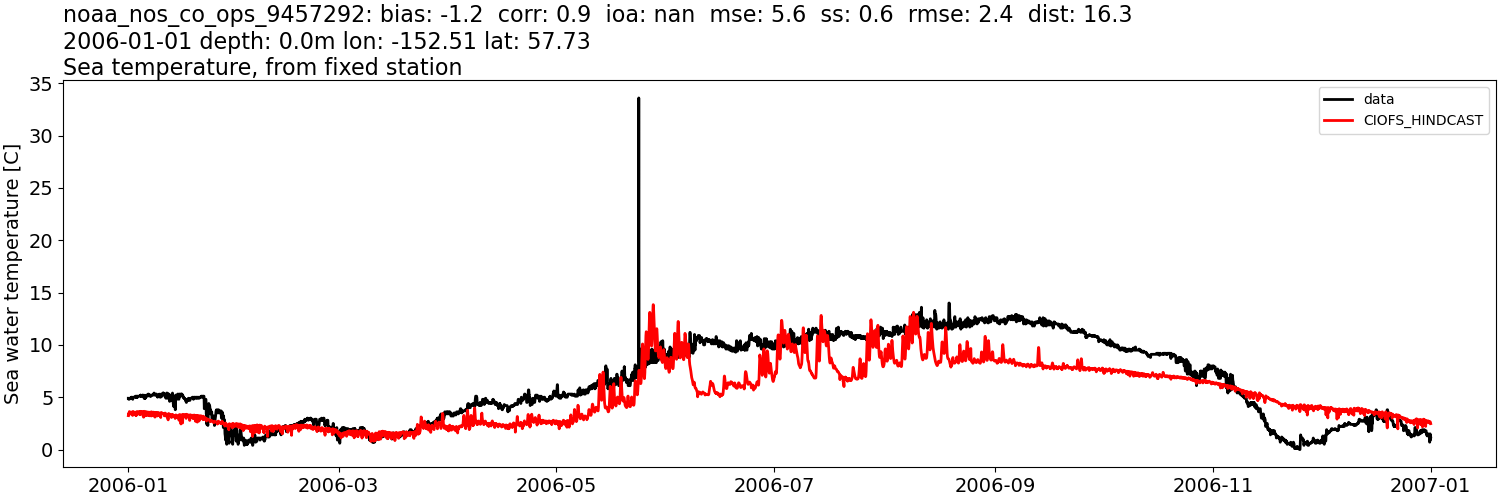
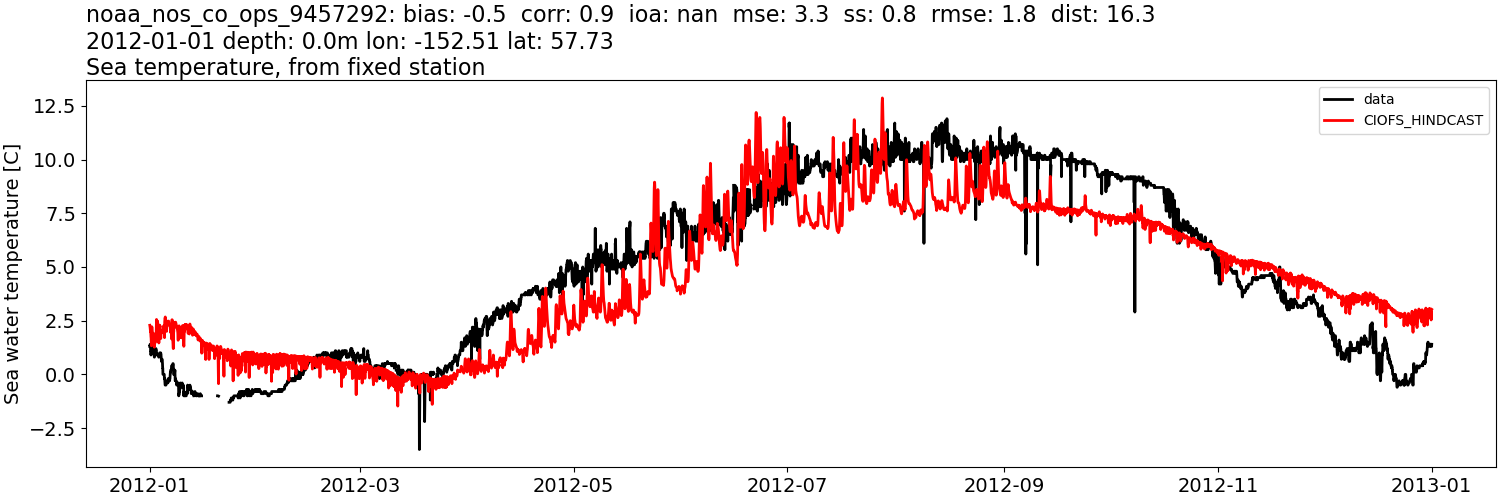
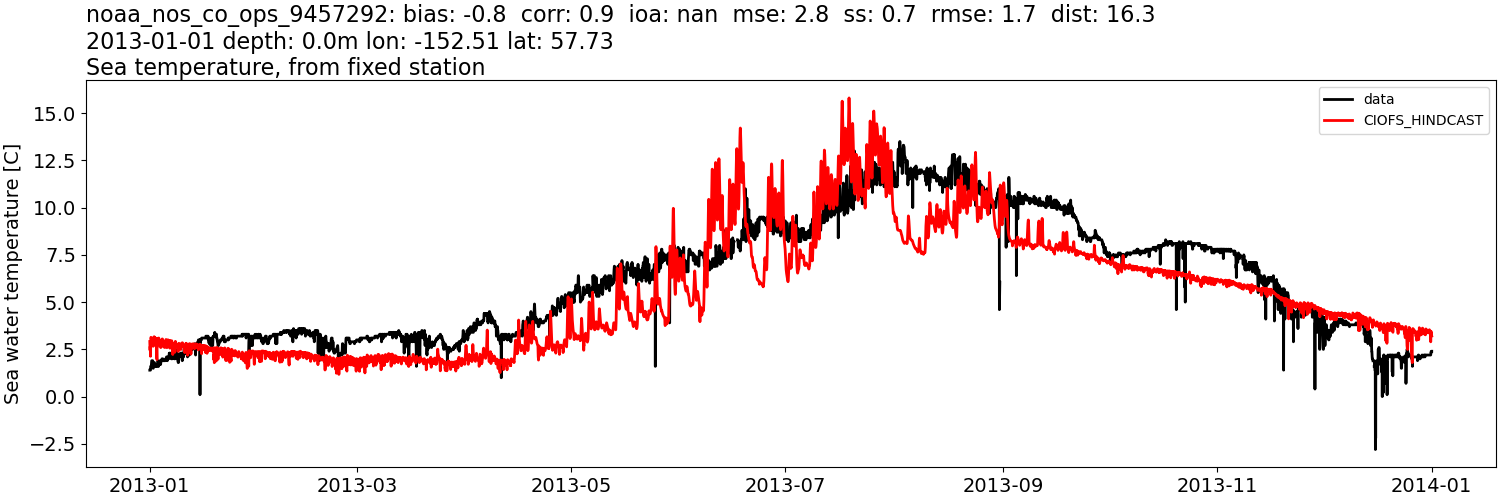
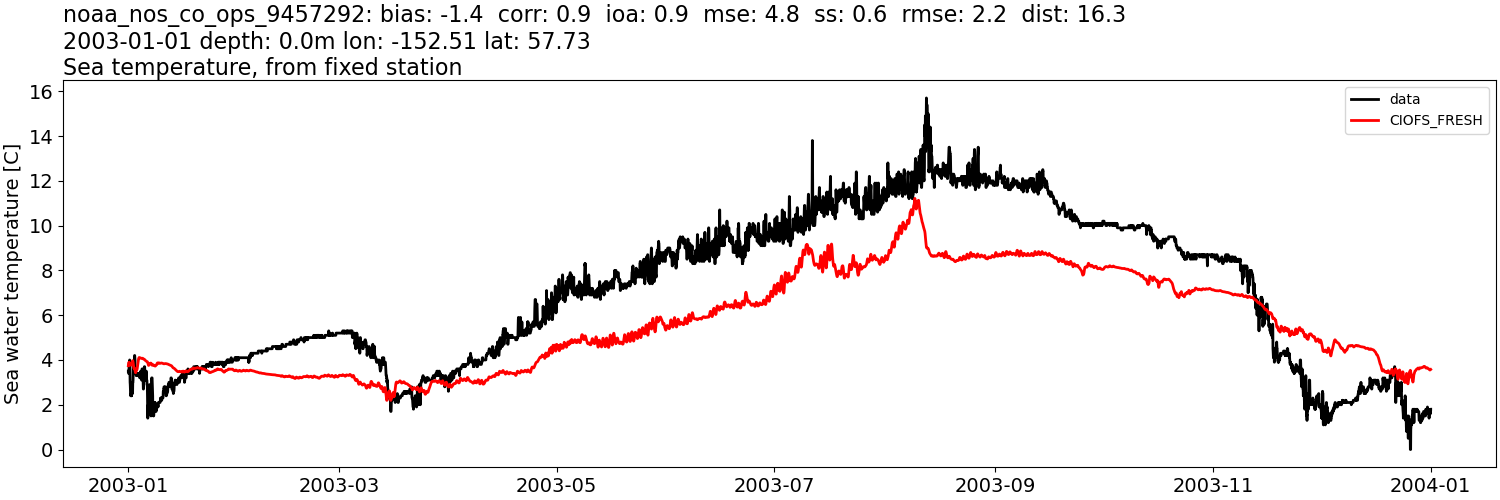
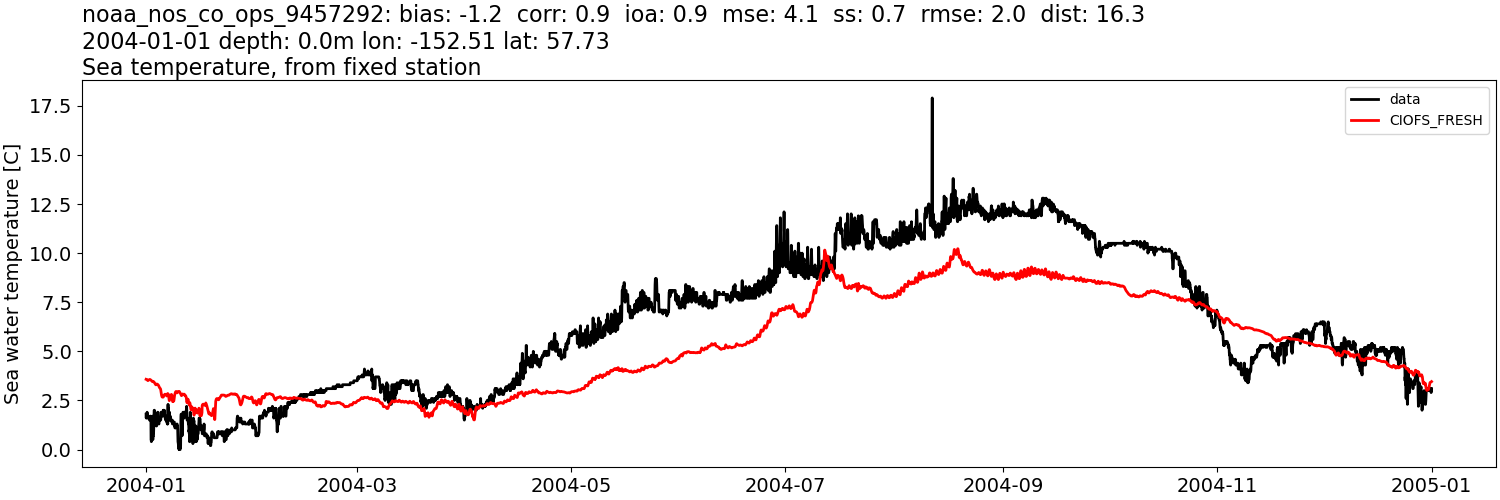
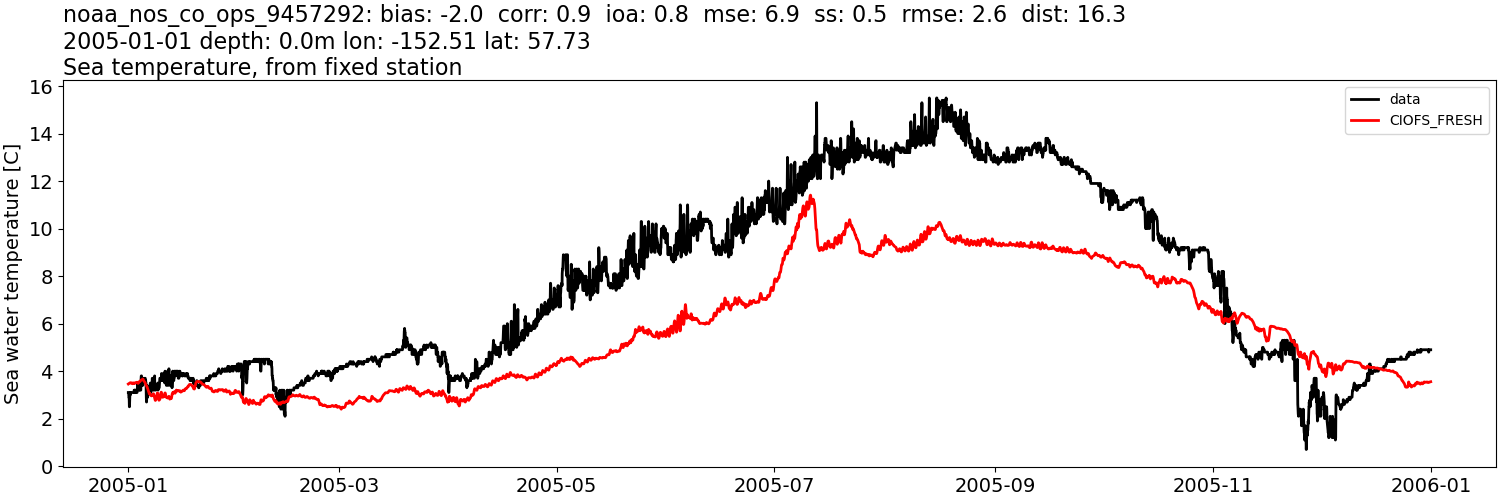
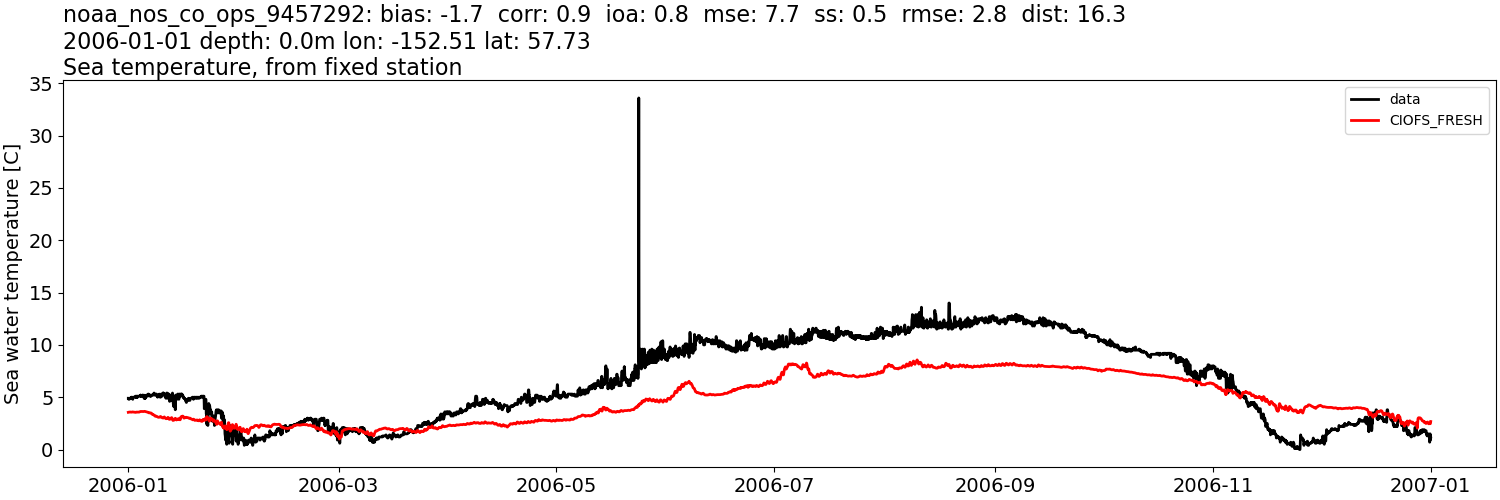
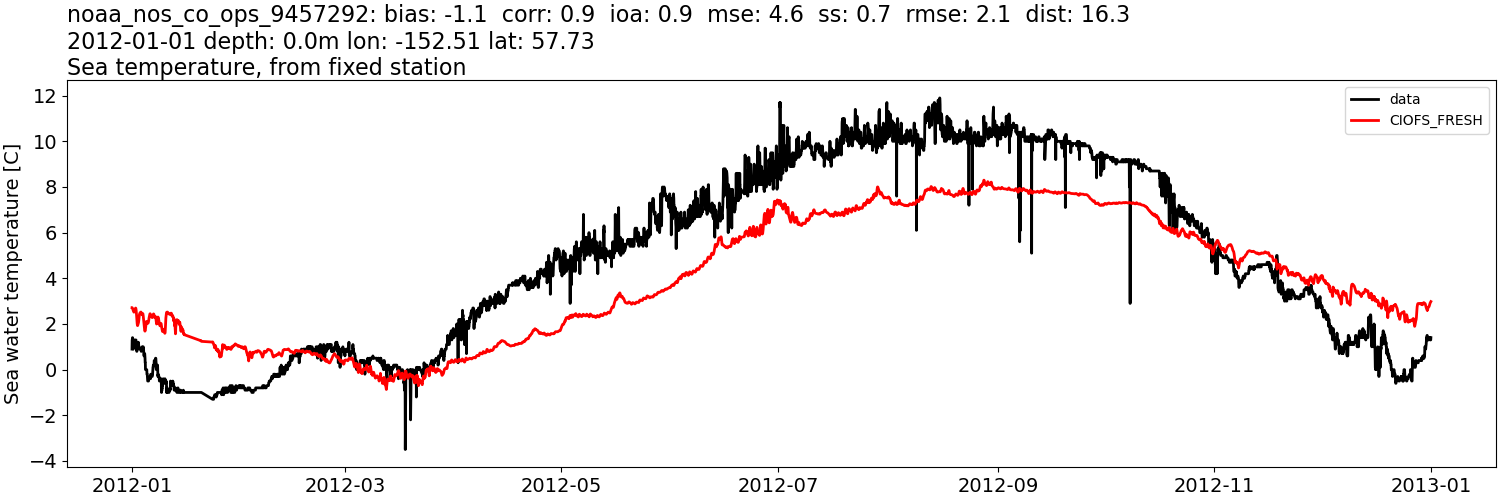
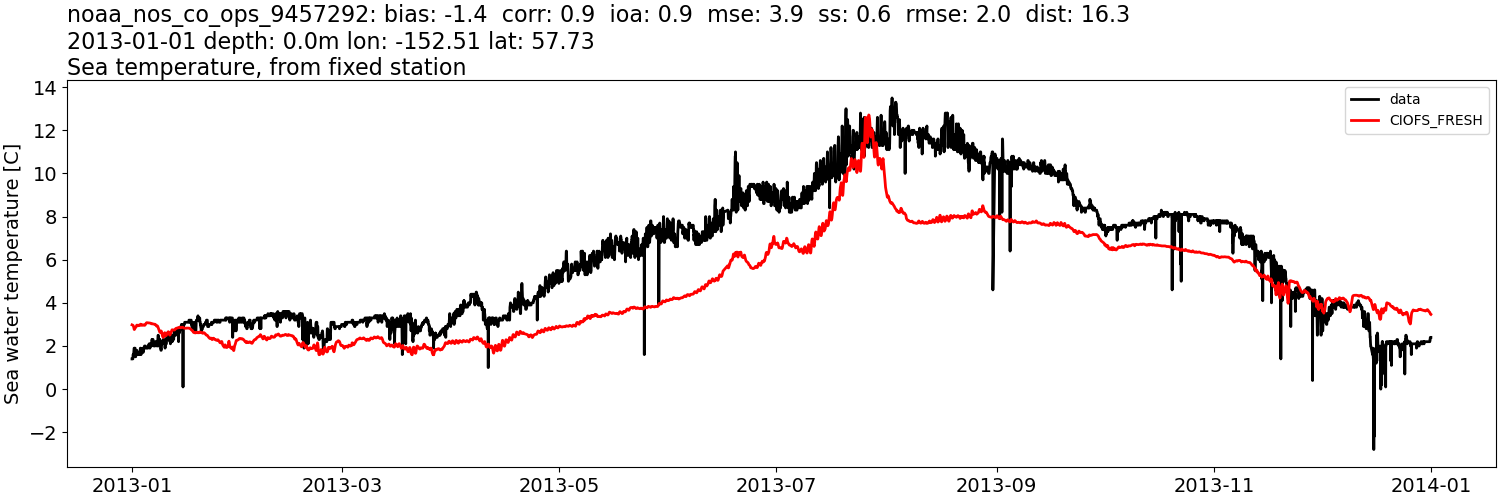
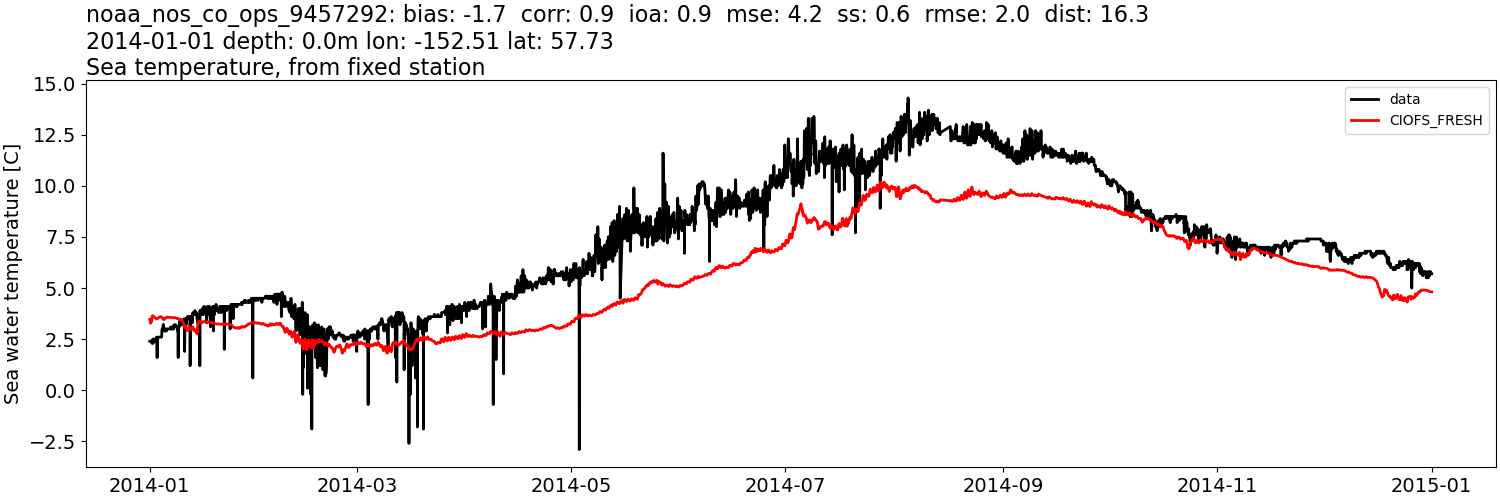
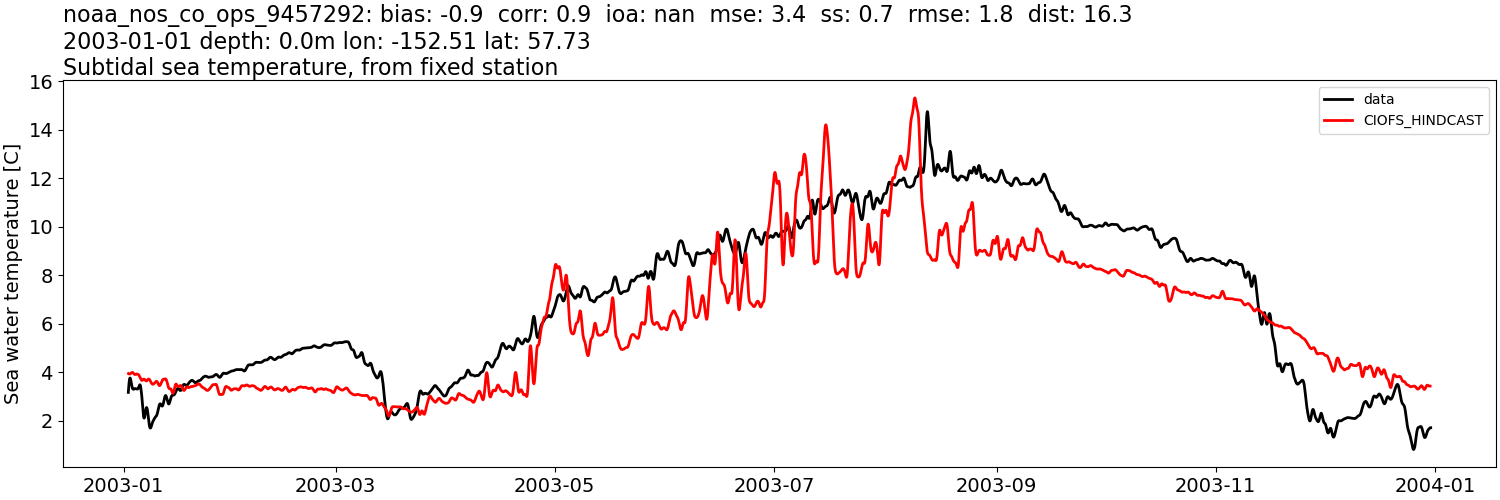
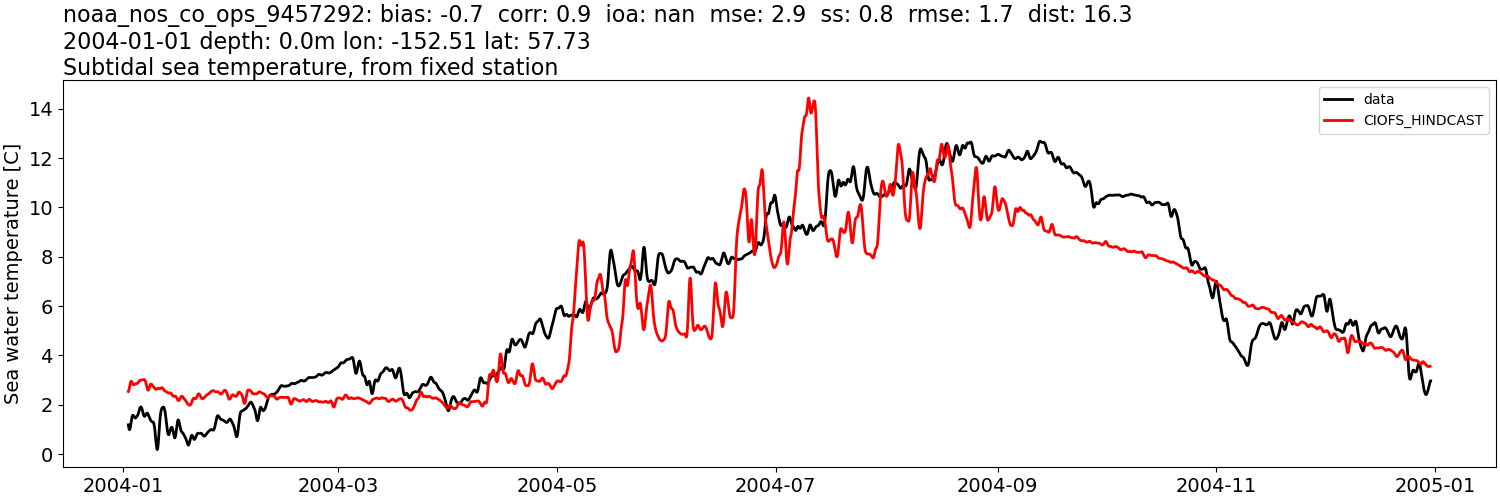
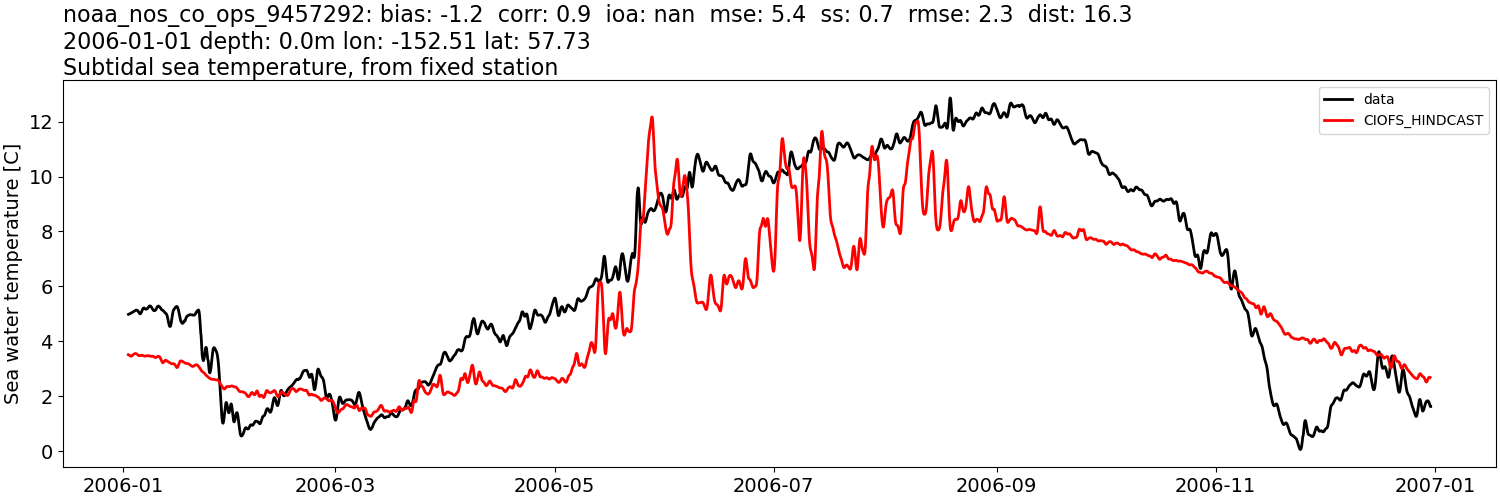
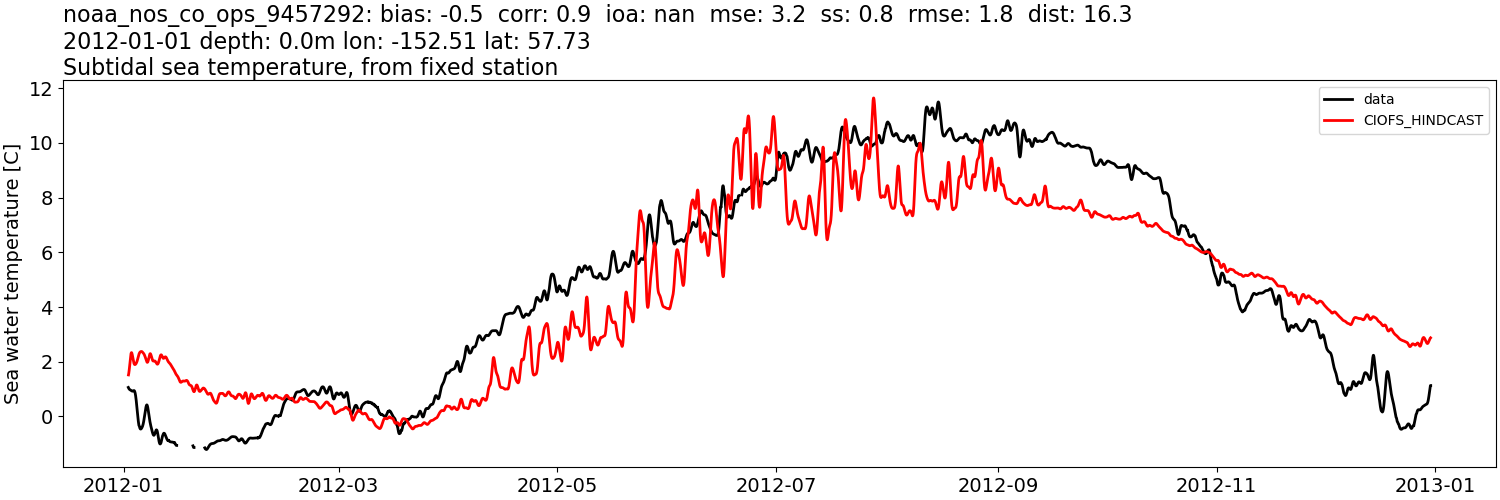
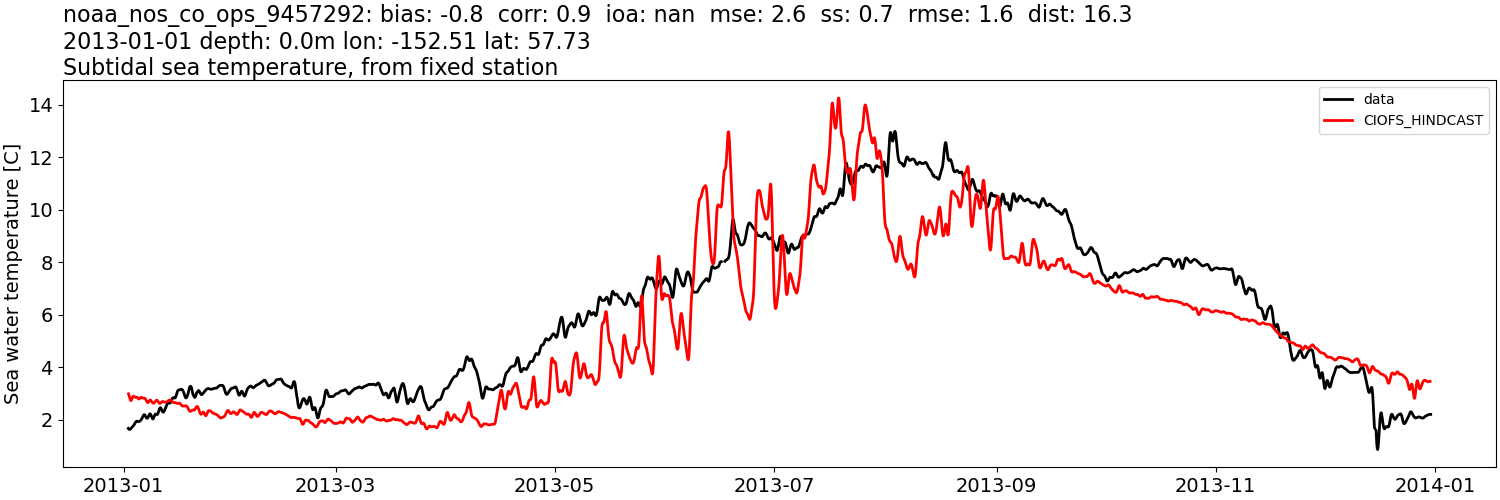
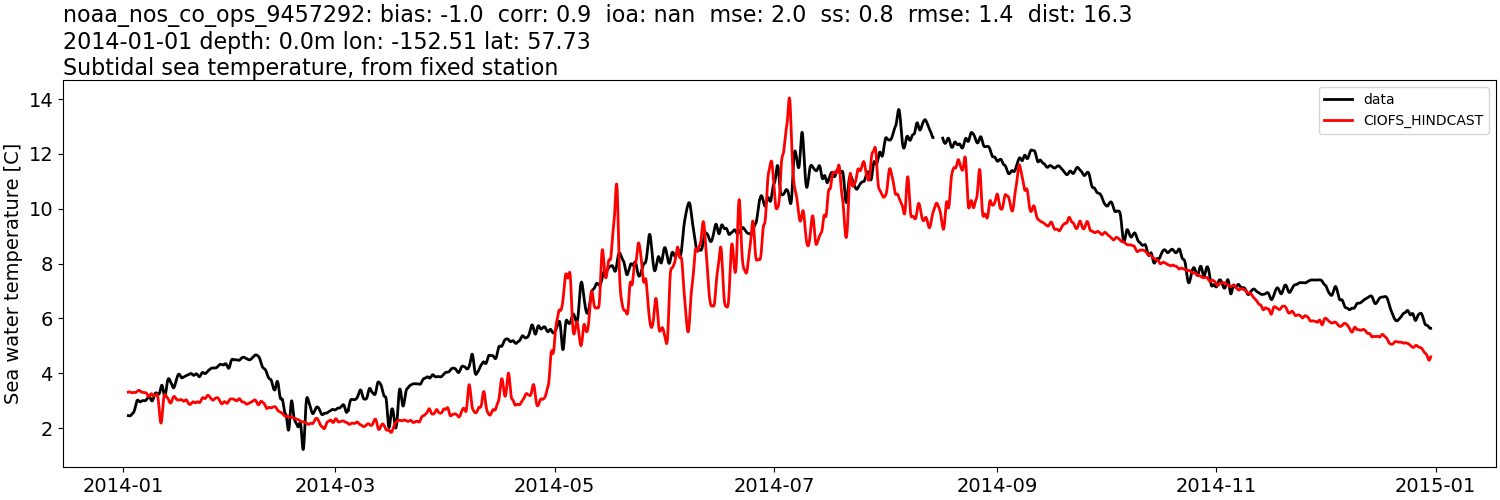
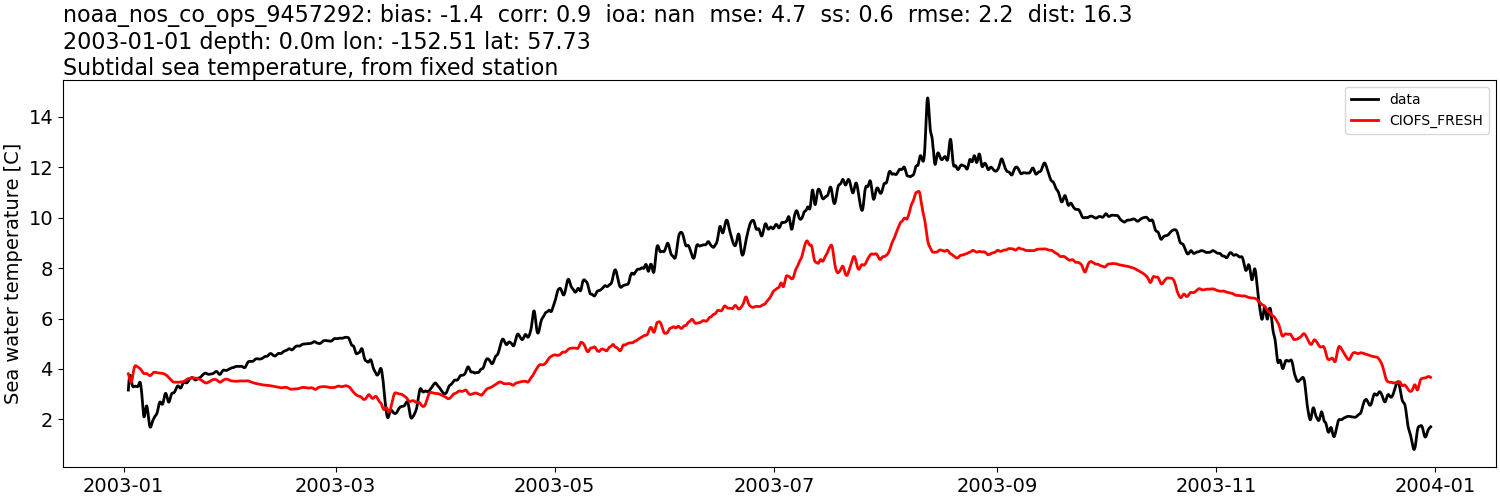
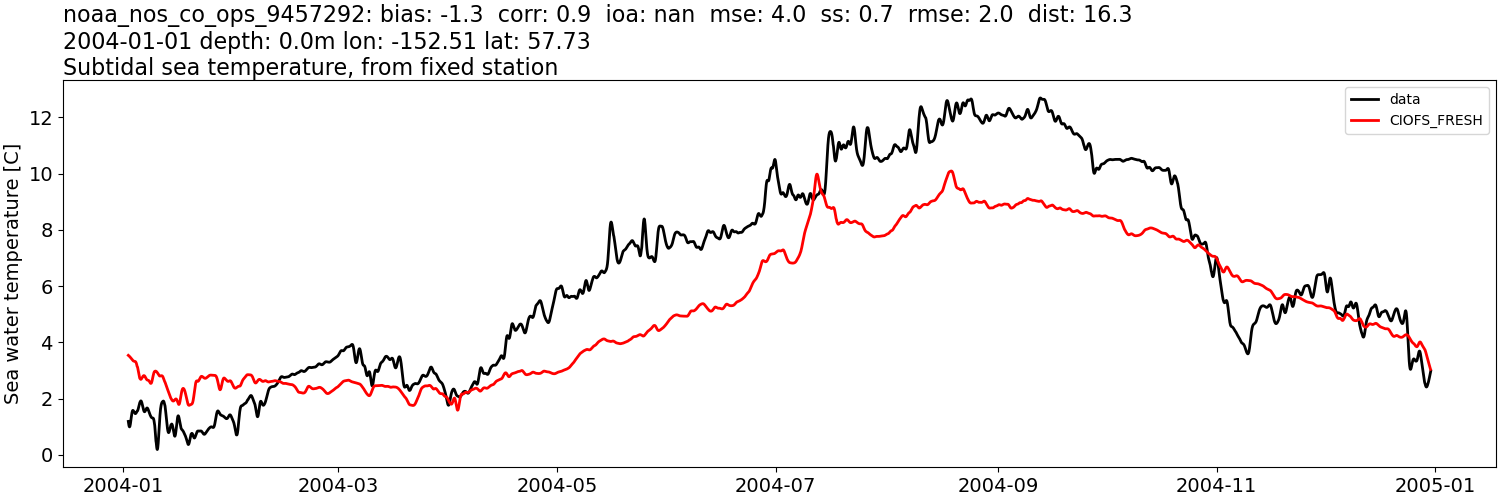
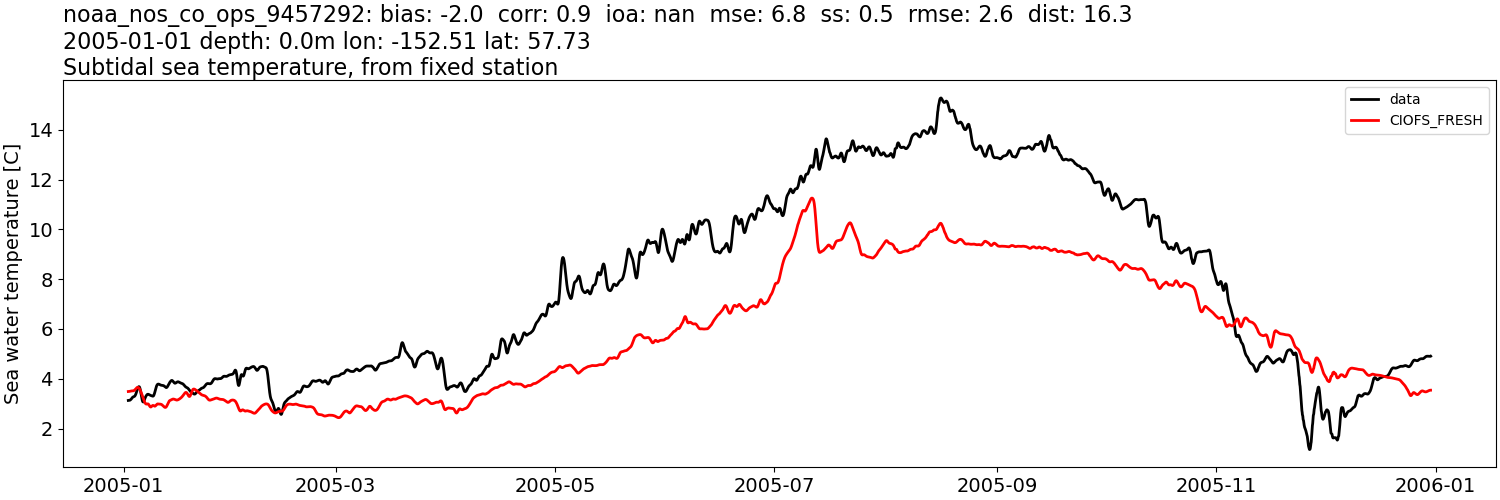
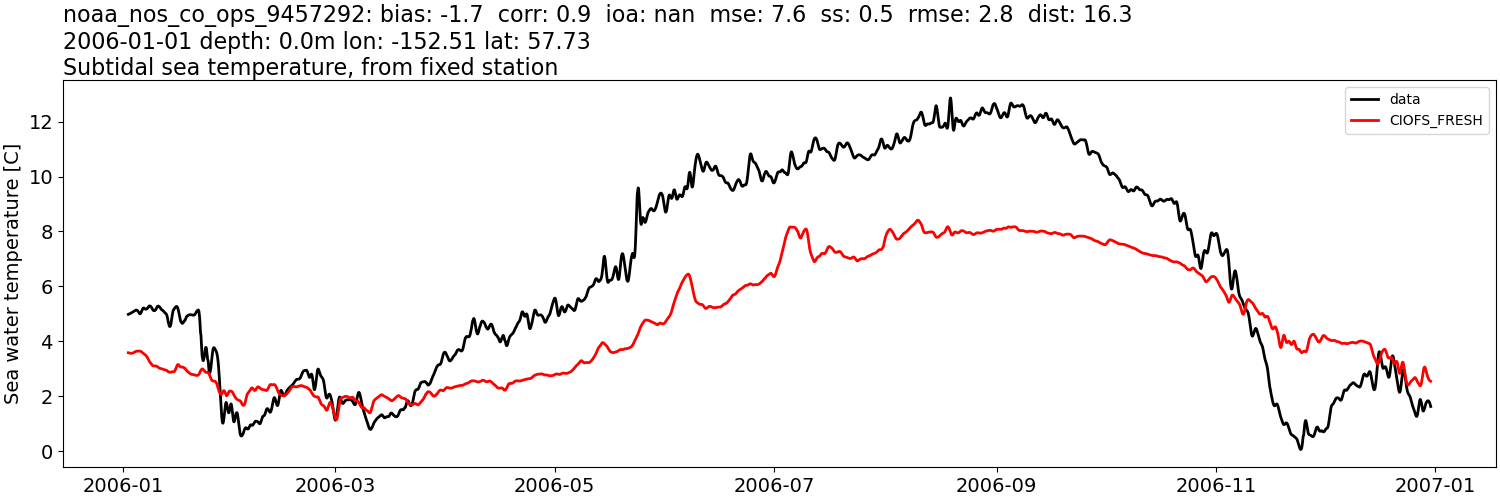
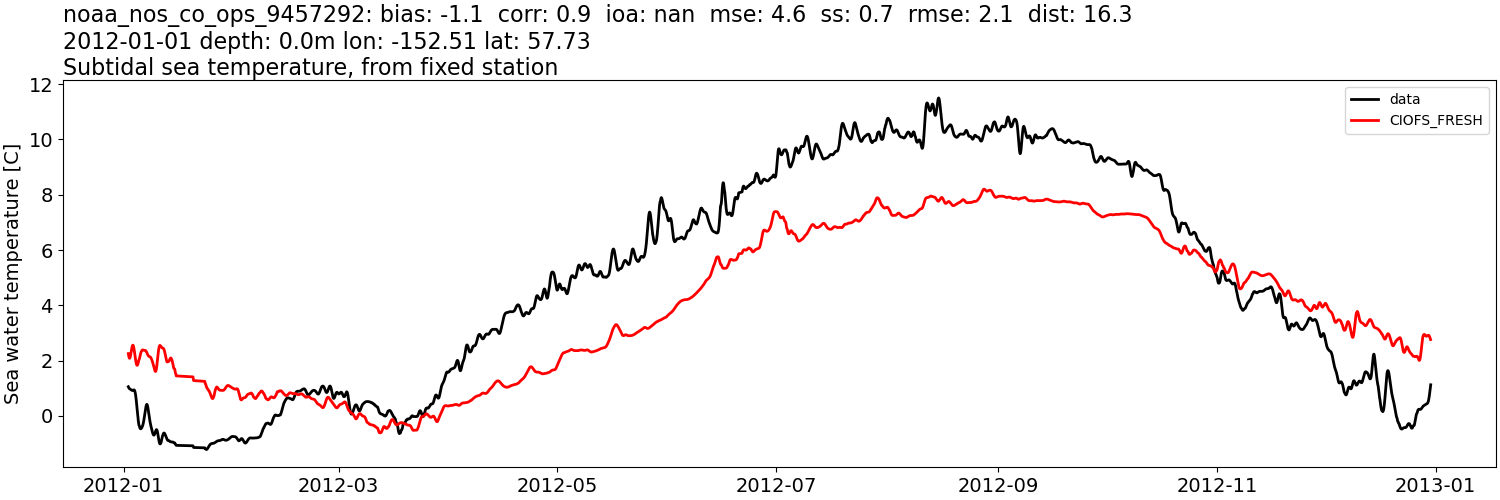
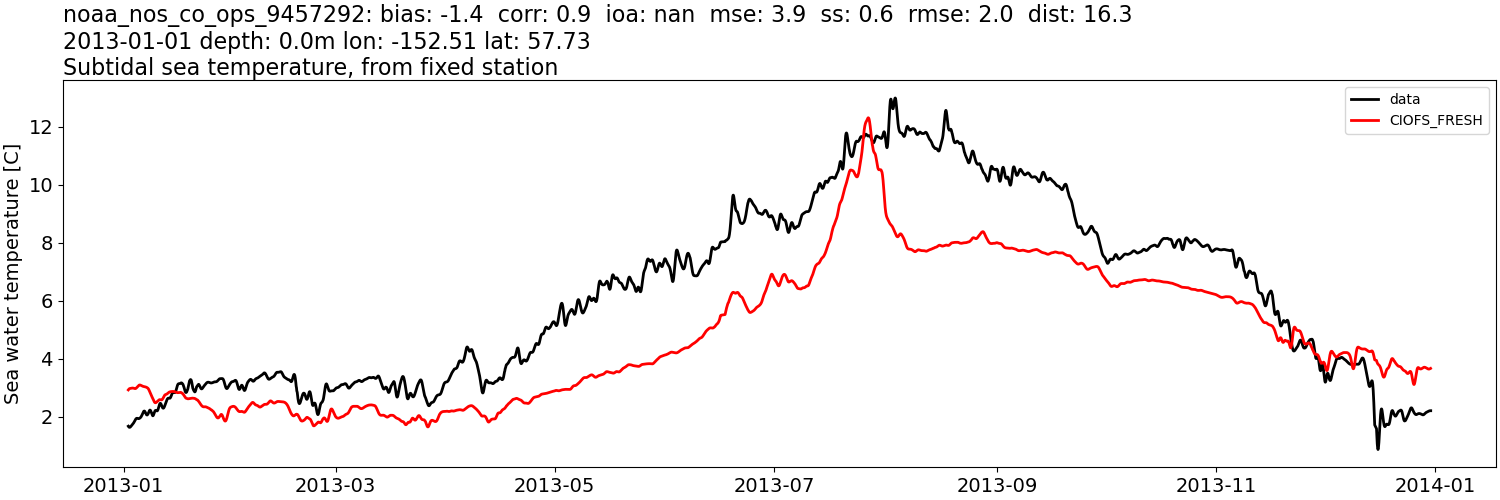
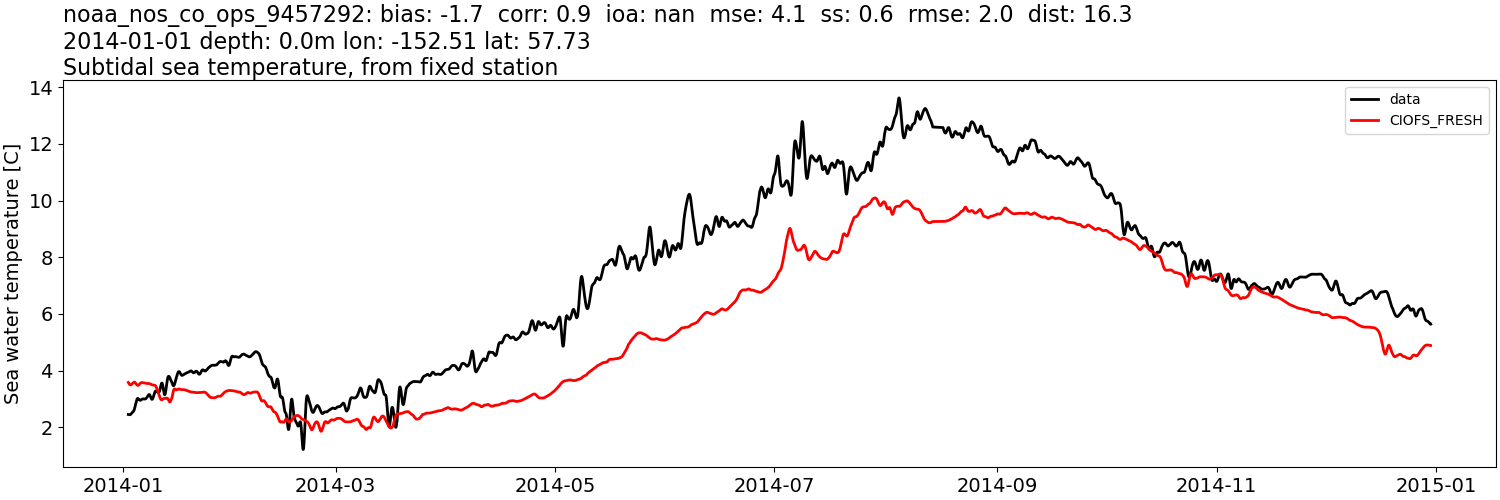
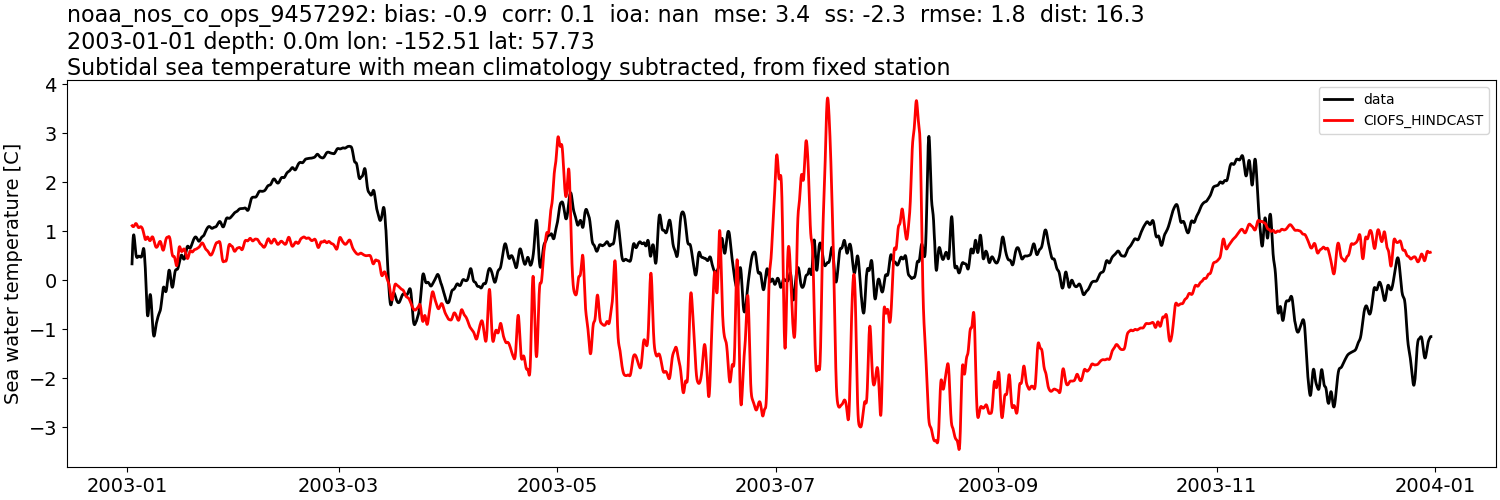
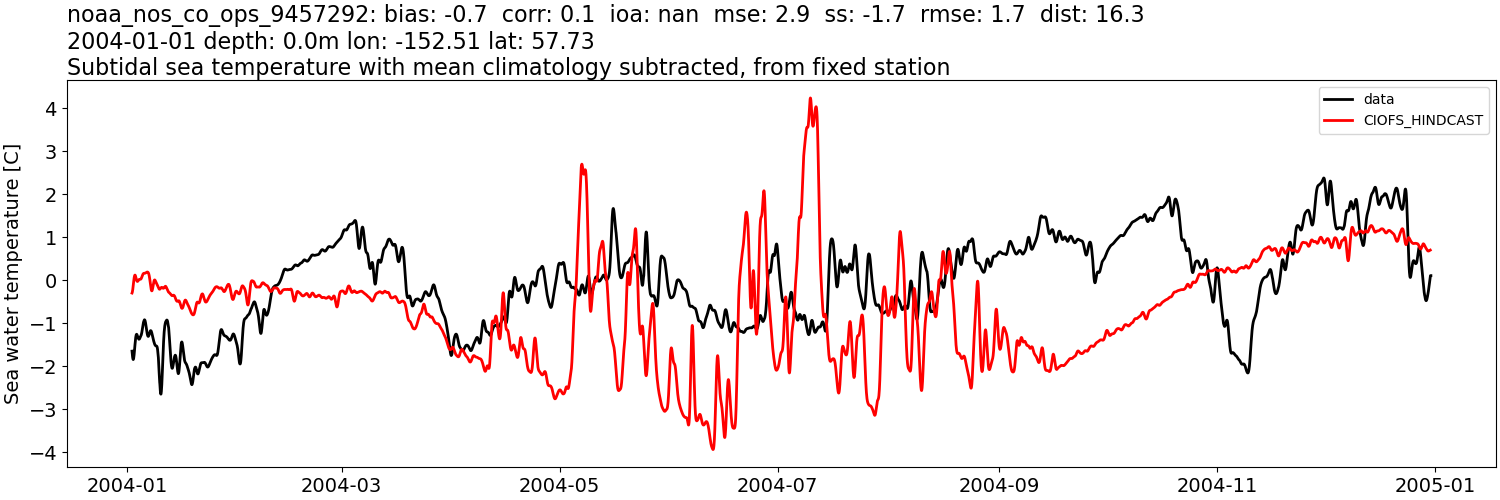
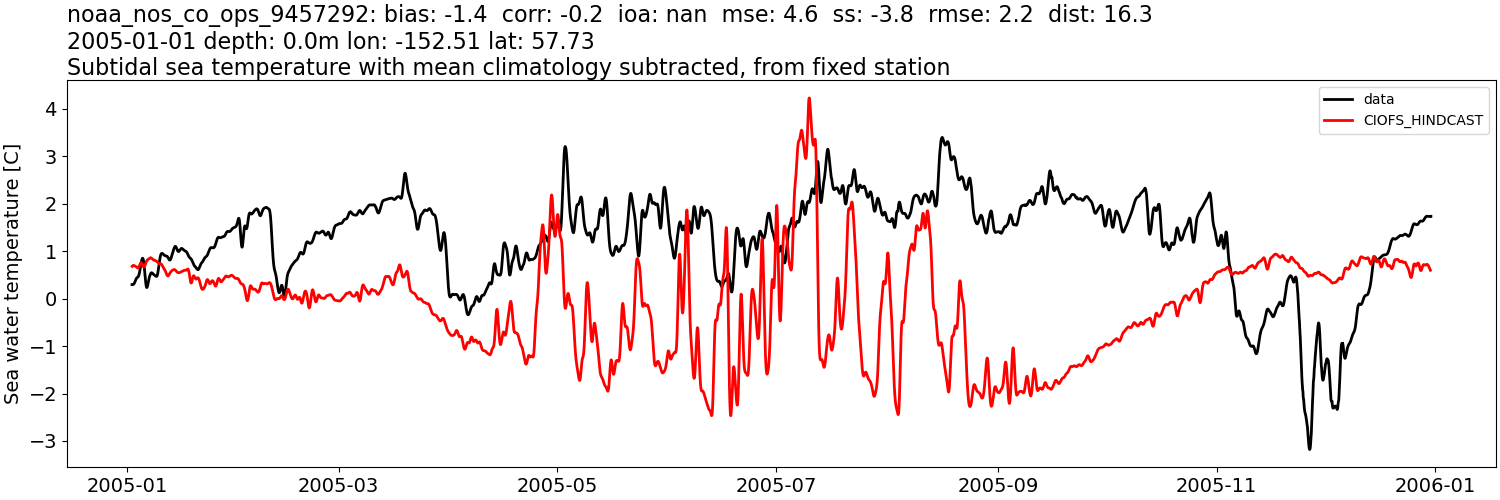
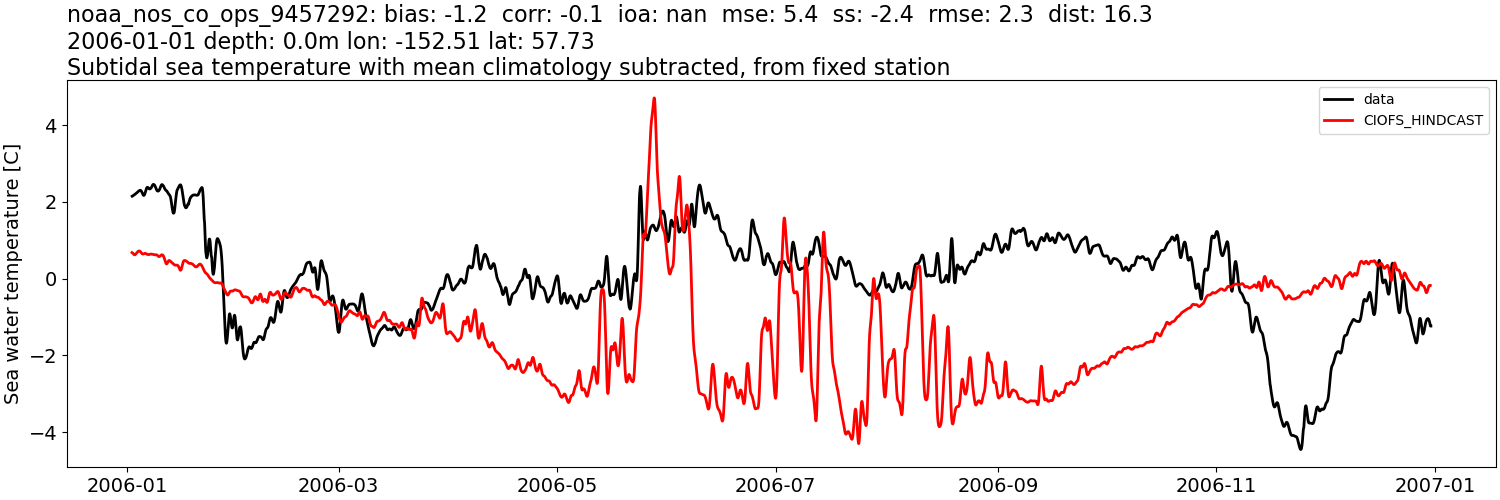
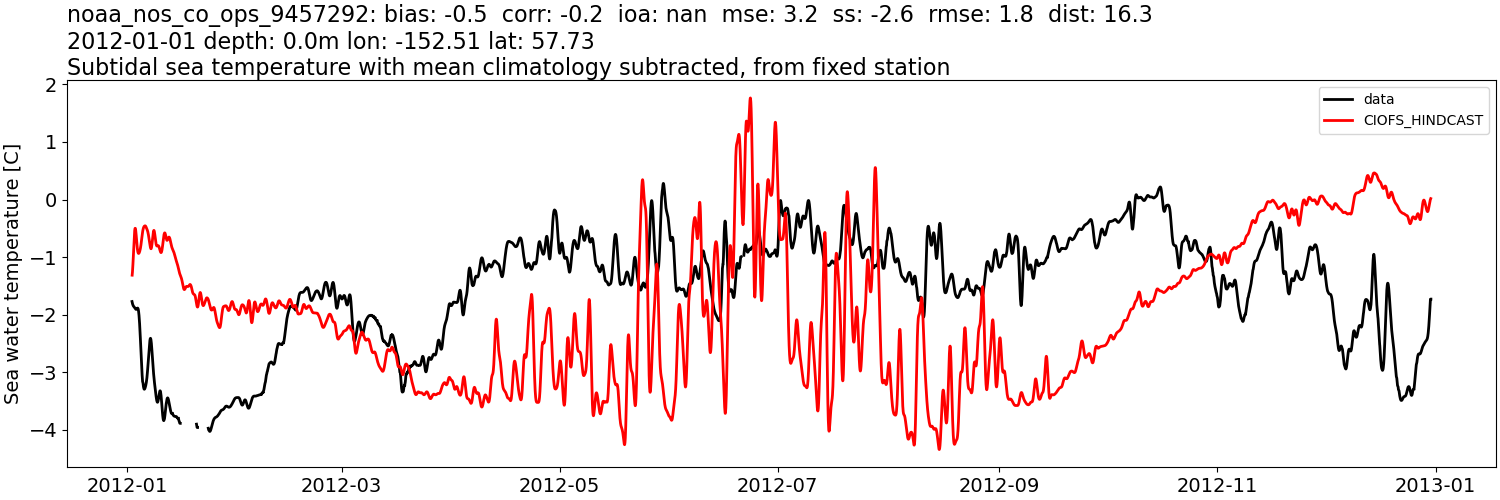
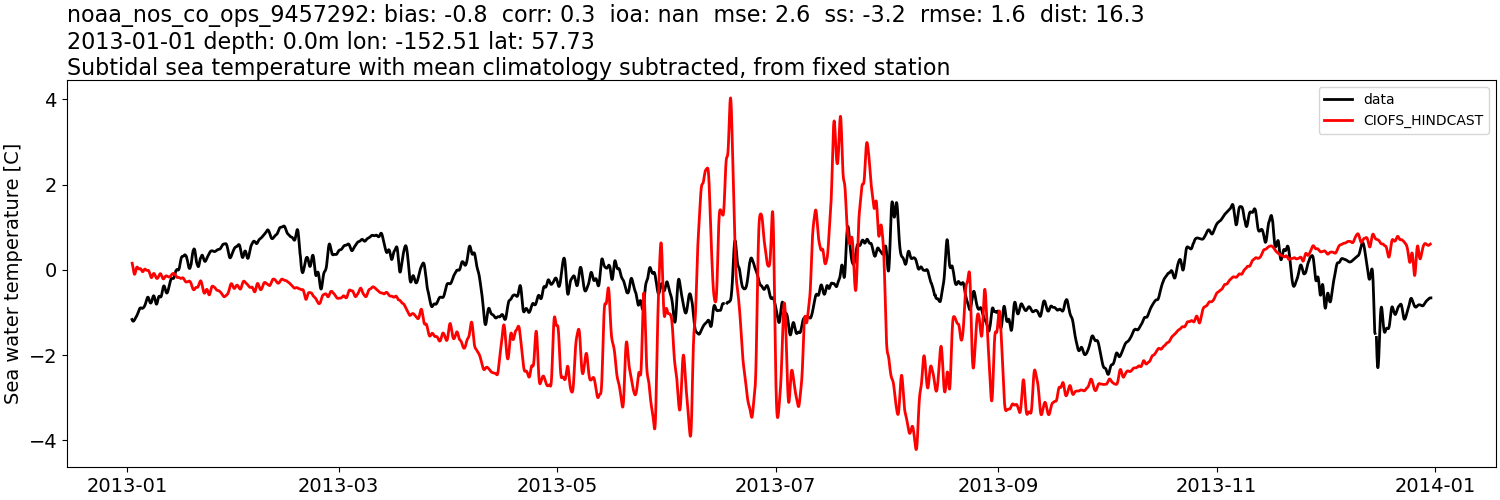
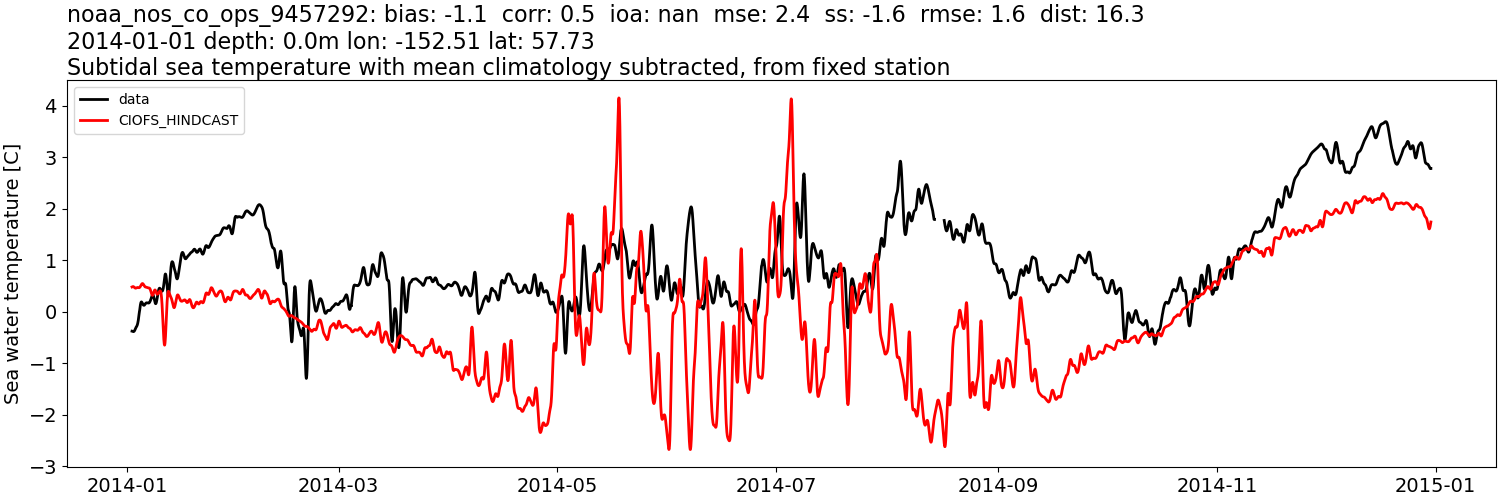
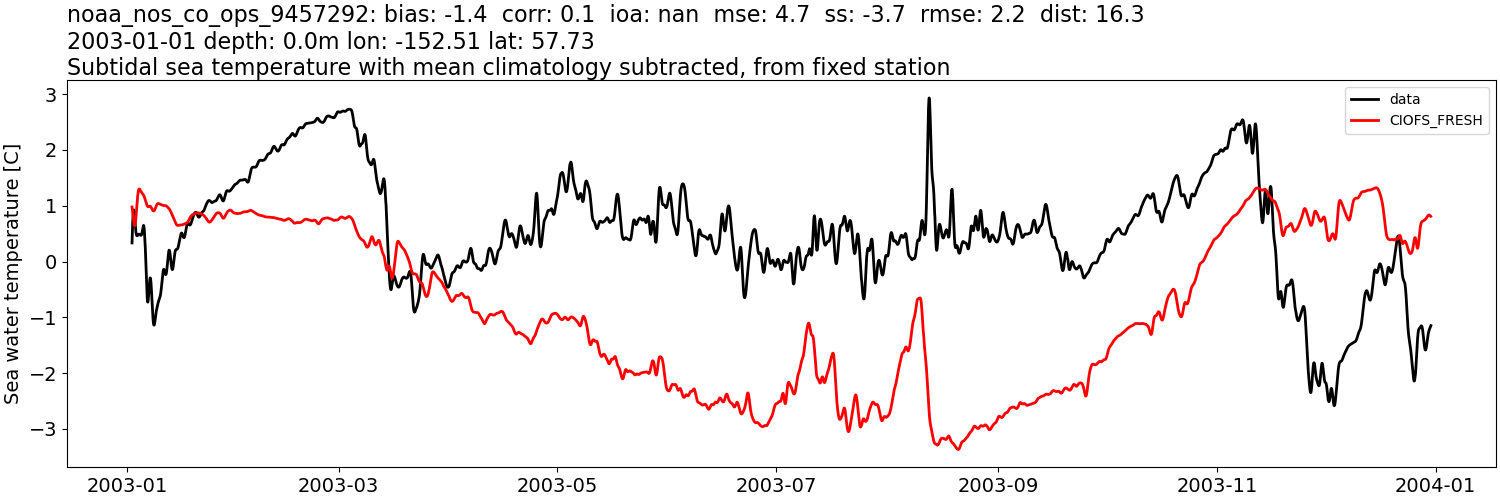
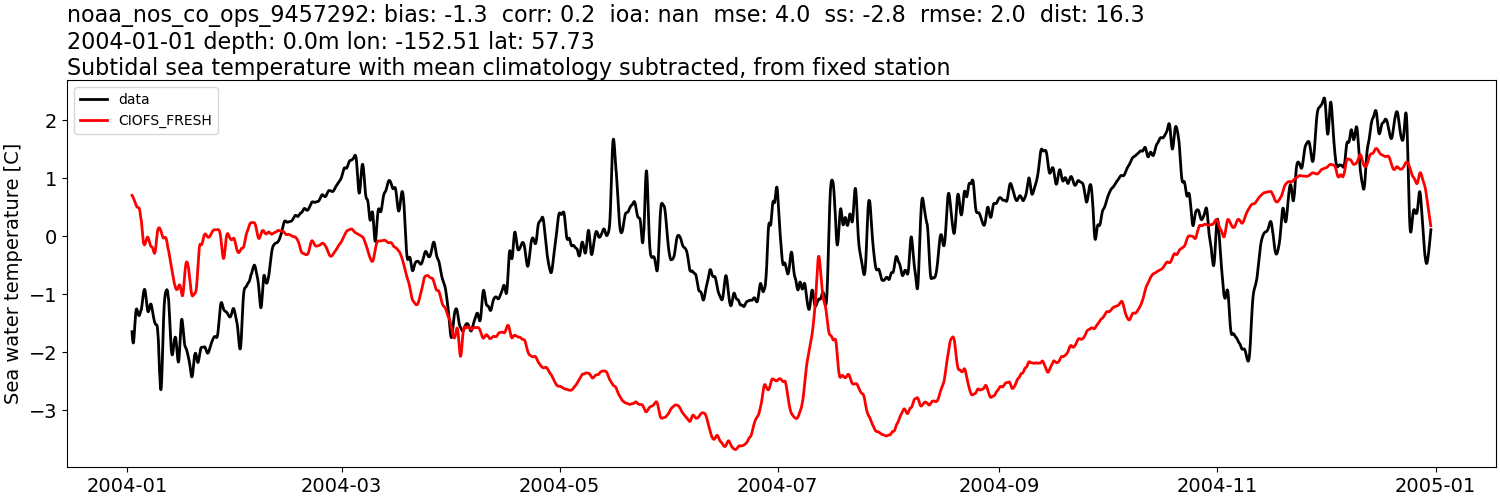
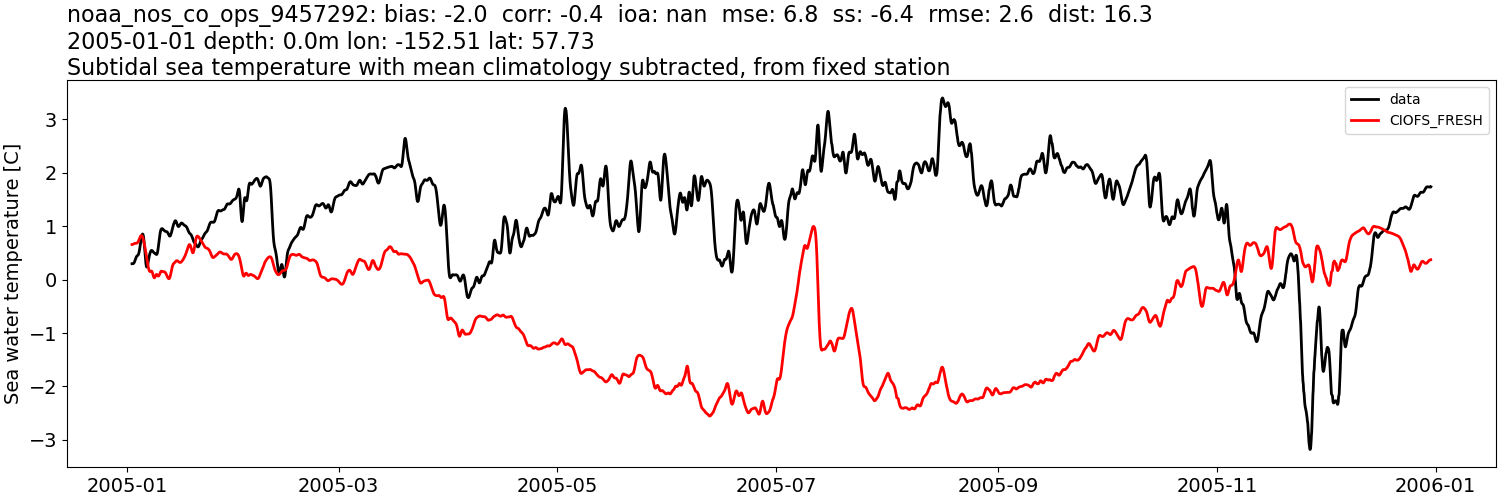
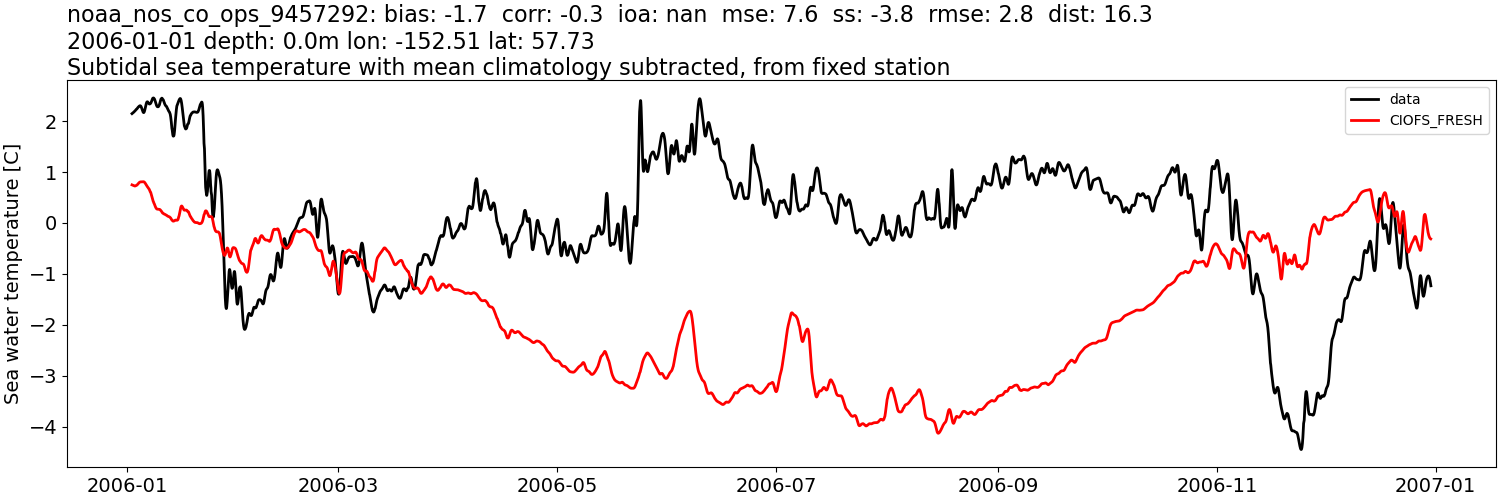
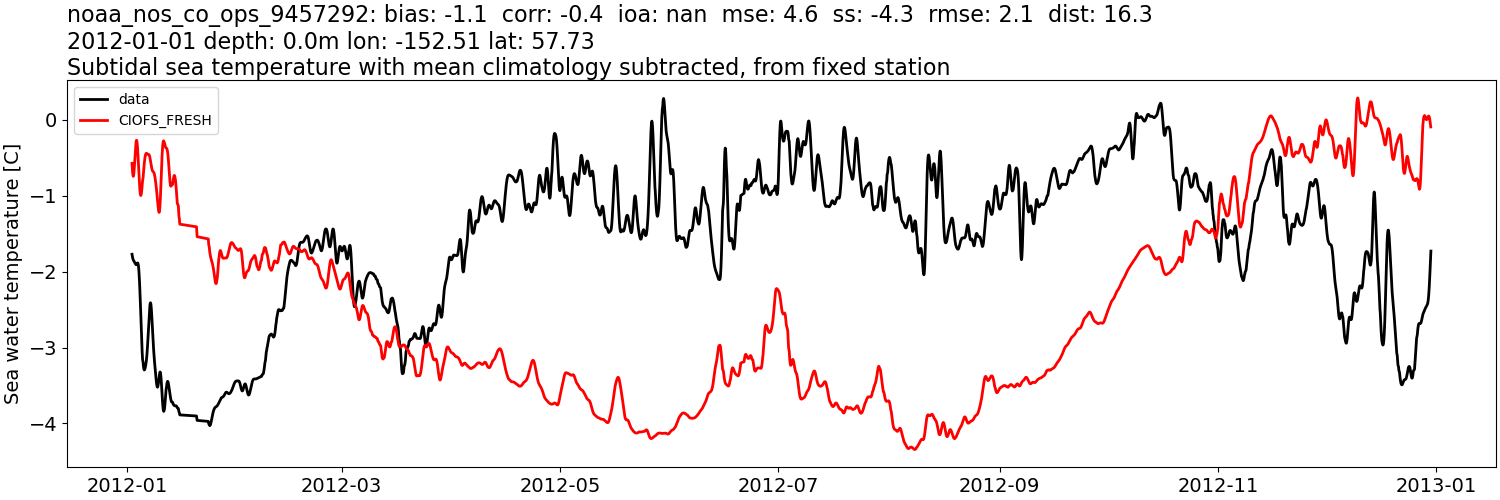
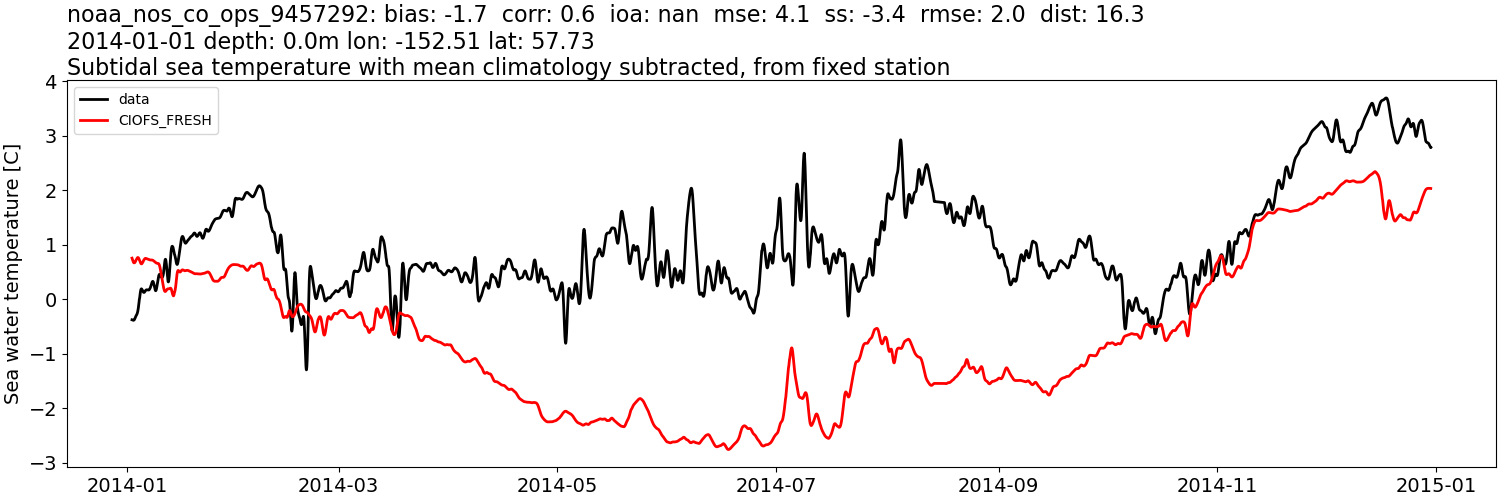
noaa_nos_co_ops_9457292#
Sea surface height: mean subtracted#
CIOFS_HINDCAST#
Comparison plots by year
2003
2004

2005
2006

2012
2013
2014
CIOFS_FRESH#
Comparison plots by year
2003

2004
2005

2006
2012
2013
2014

Sea surface height: mean subtracted, then tidally-filtered#
CIOFS_HINDCAST#
Comparison plots by year
2003
2004

2005
2006
2012
2013

2014
CIOFS_FRESH#
Comparison plots by year
2003
2004
2005
2006
2012
2013
2014
Sea water temperature:#
CIOFS_HINDCAST#
Comparison plots by year
2003

2004
2005
2006
2012
2013
2014

CIOFS_FRESH#
Comparison plots by year
2003
2004
2005
2006
2012
2013
2014
Sea water temperature: tidally-filtered#
CIOFS_HINDCAST#
Comparison plots by year
2003
2004
2005

2006
2012
2013
2014
CIOFS_FRESH#
Comparison plots by year
2003
2004
2005
2006
2012
2013
2014
Sea water temperature: tidally-filtered, then monthly mean from data subtracted#
CIOFS_HINDCAST#
Comparison plots by year
2003
2004
2005
2006
2012
2013
2014
CIOFS_FRESH#
Comparison plots by year
2003
2004
2005
2006
2012
2013

2014
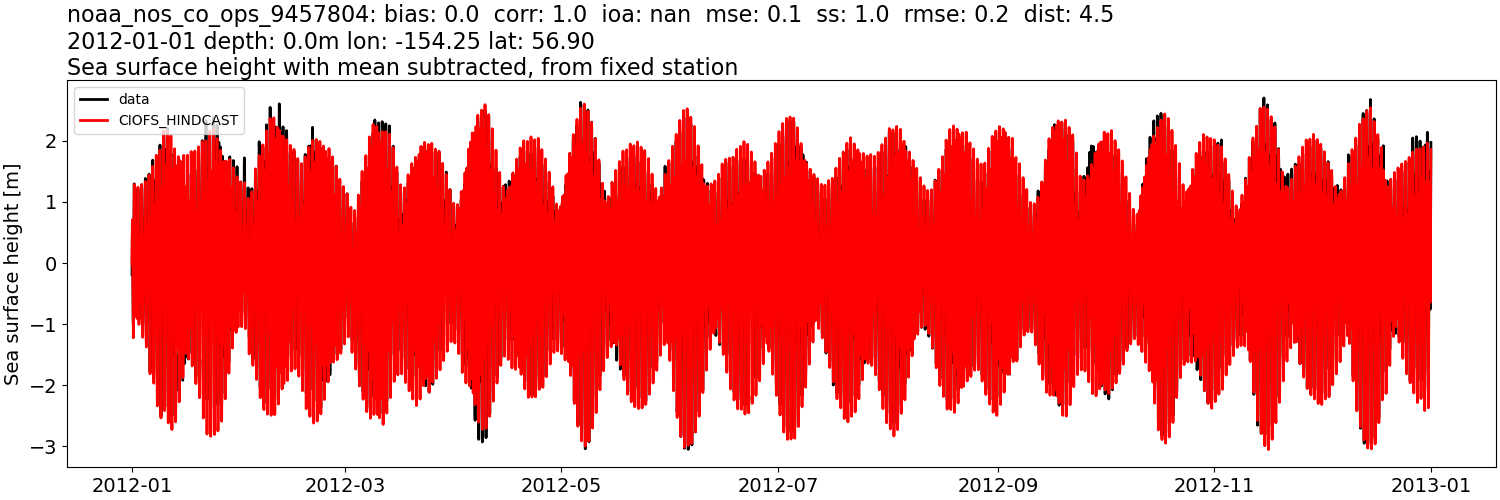
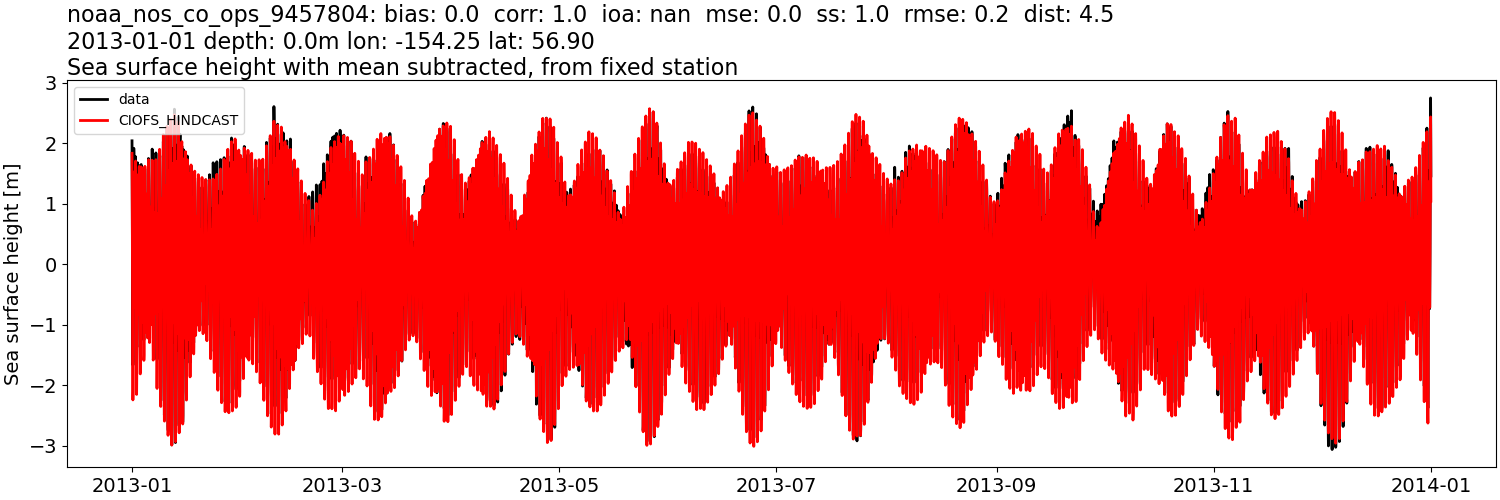
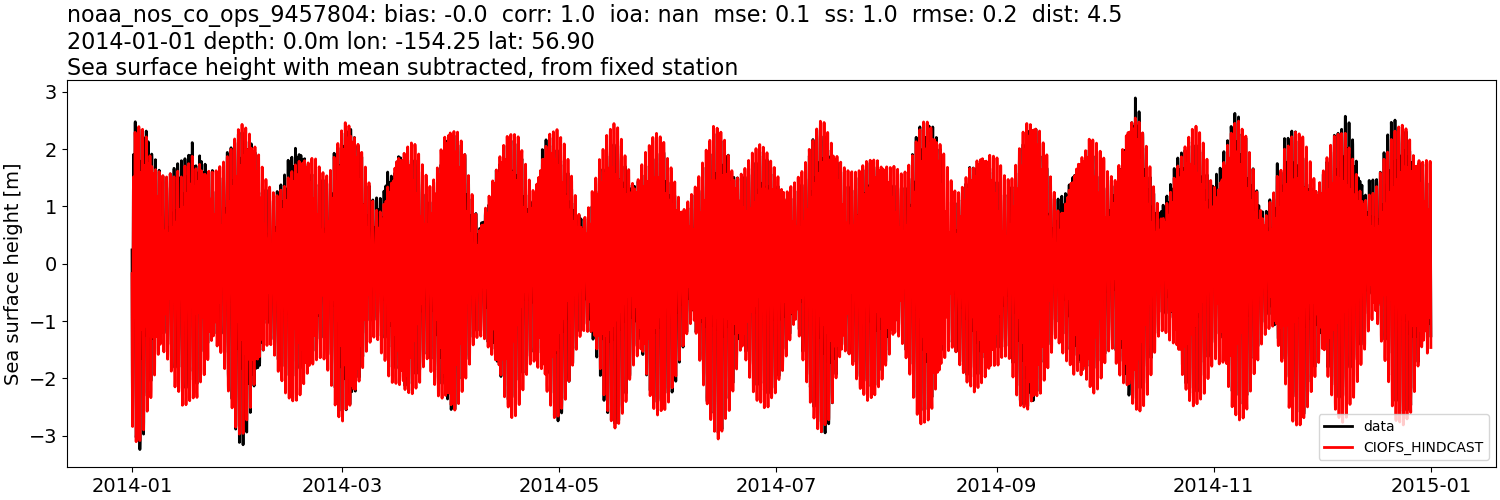
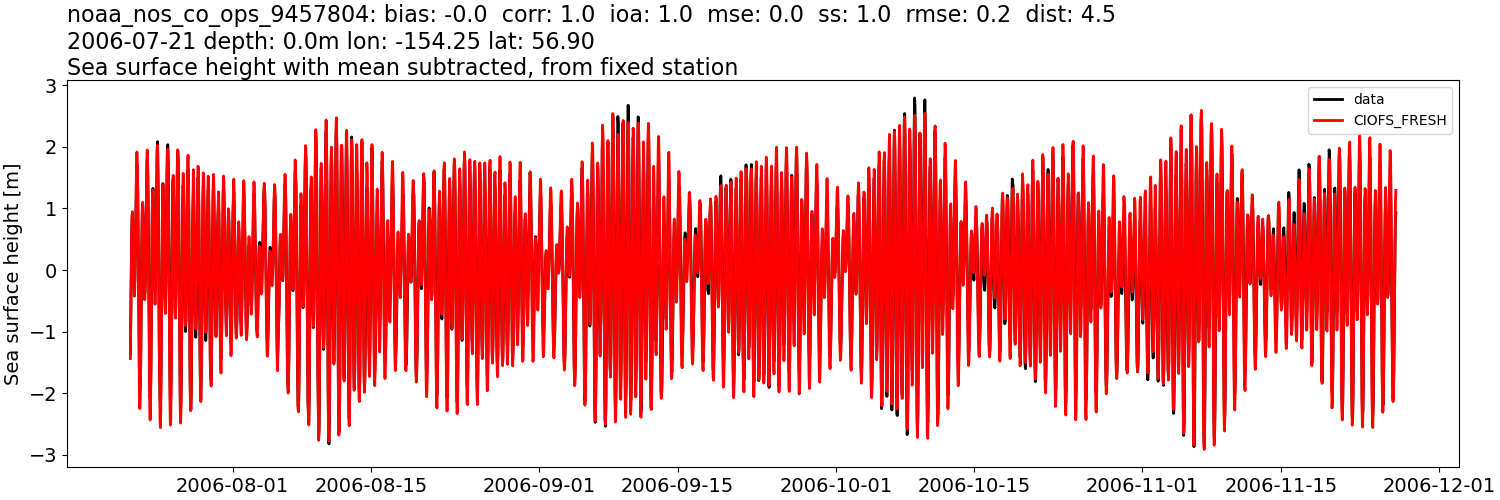
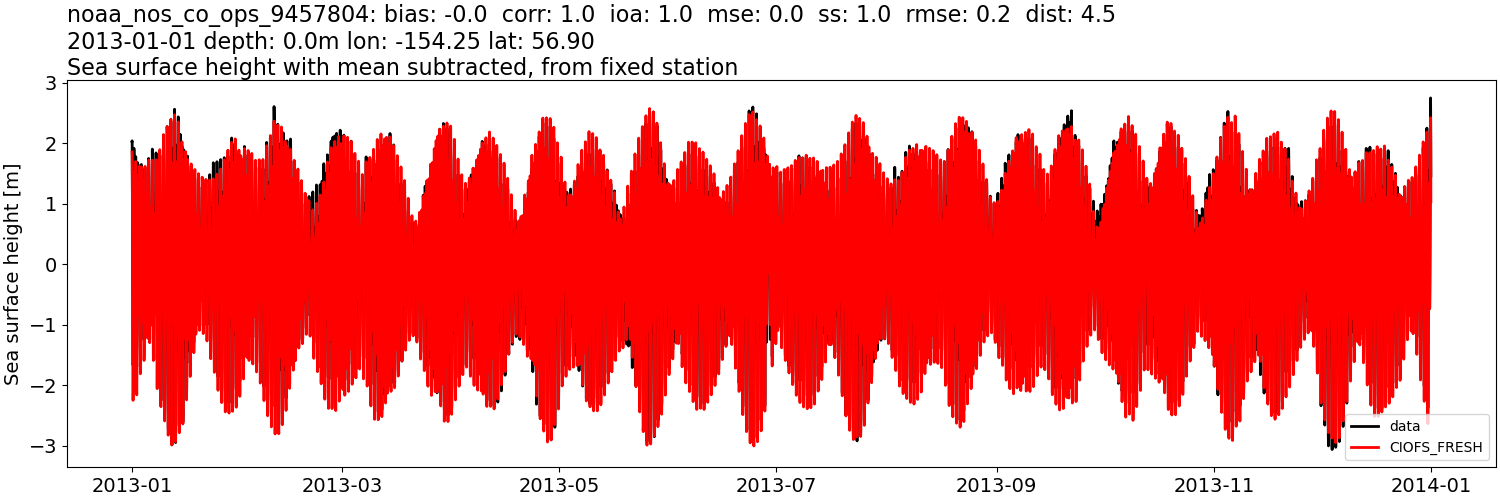
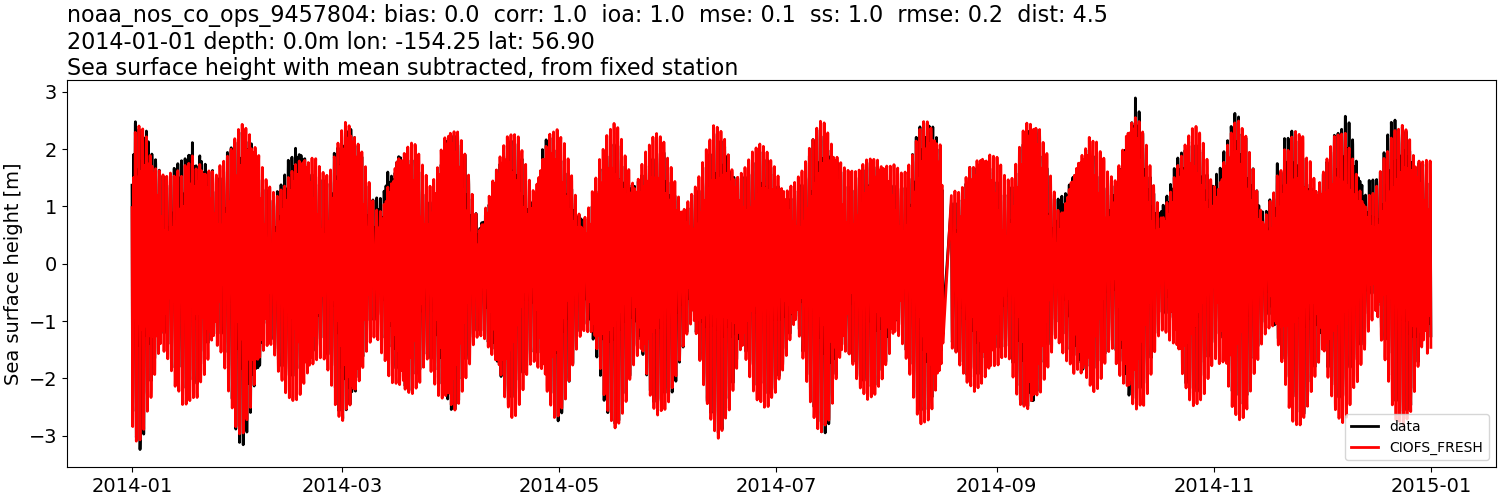
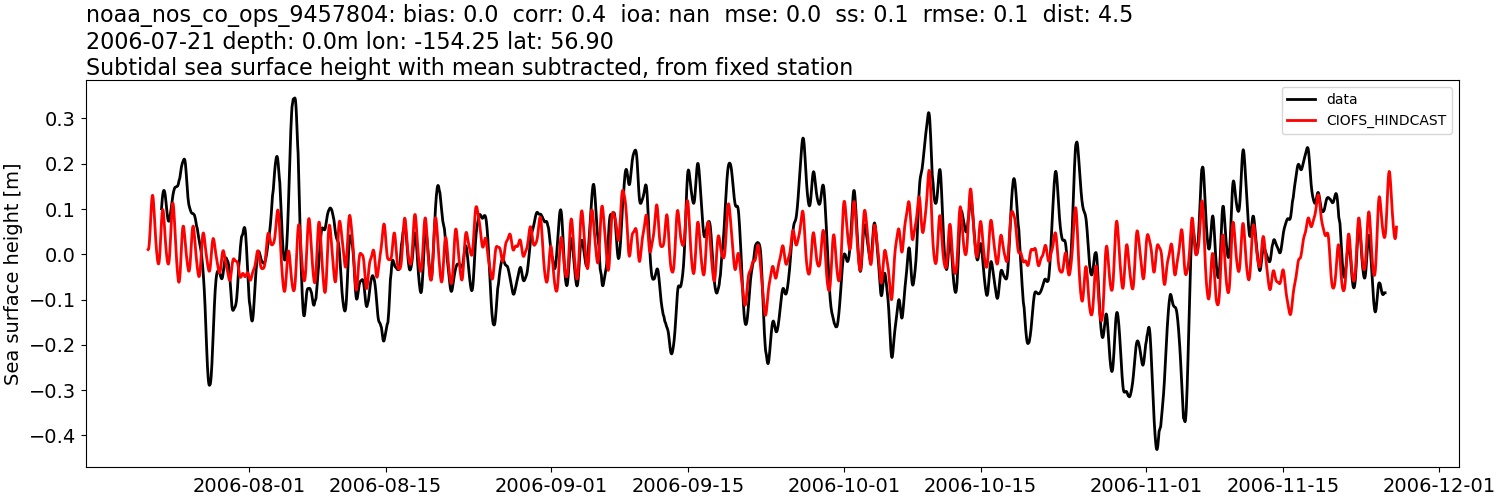
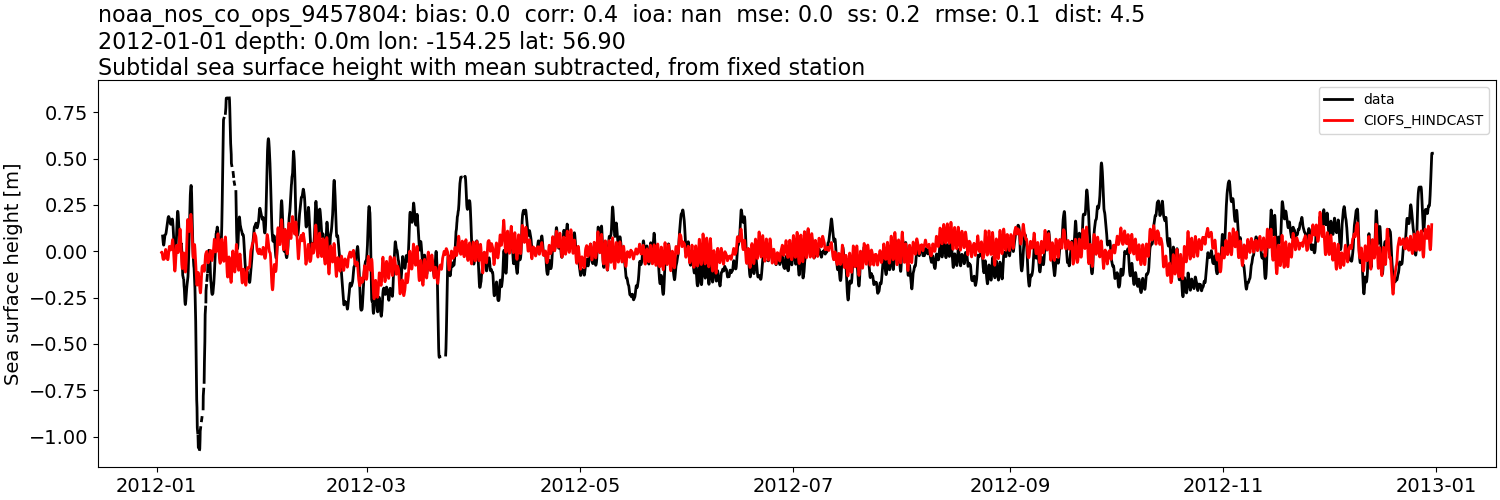
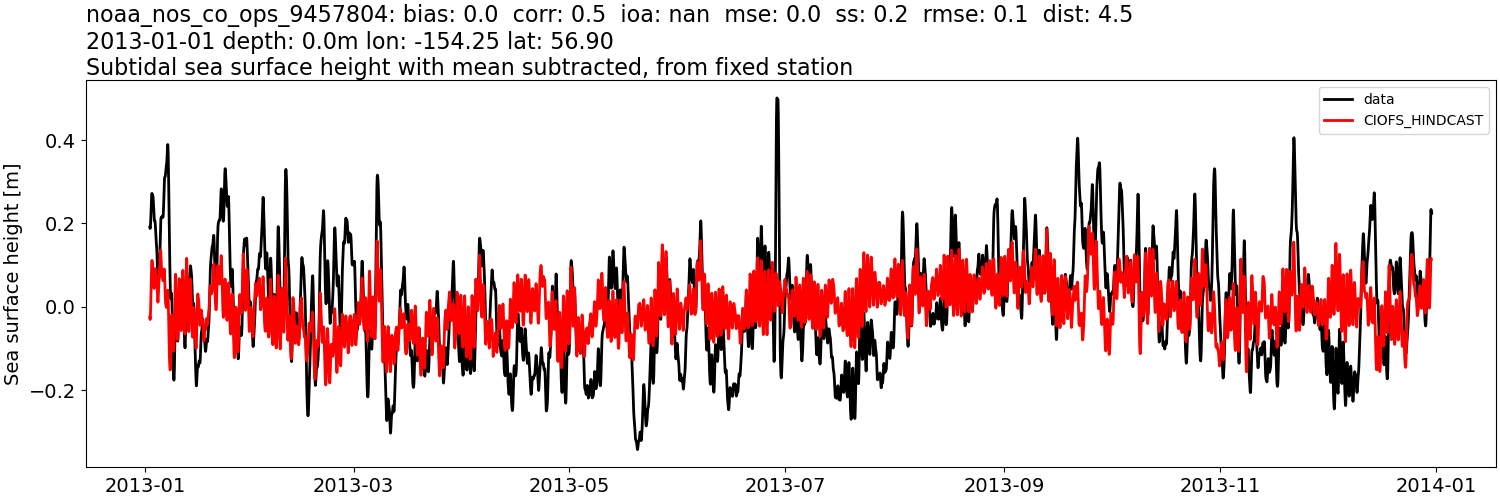
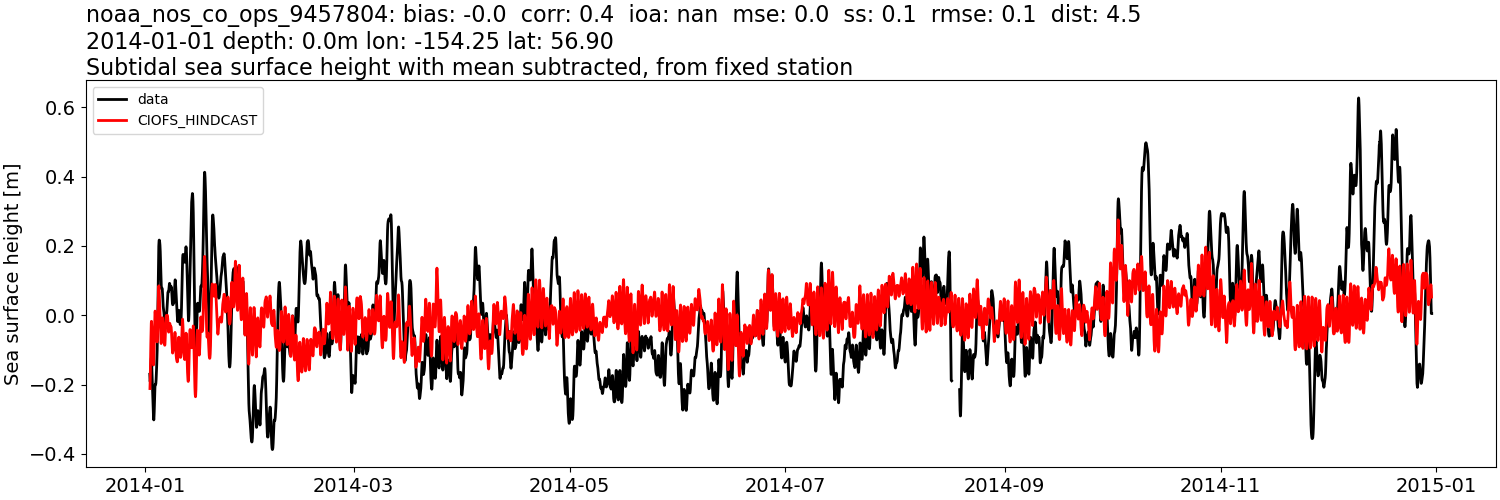
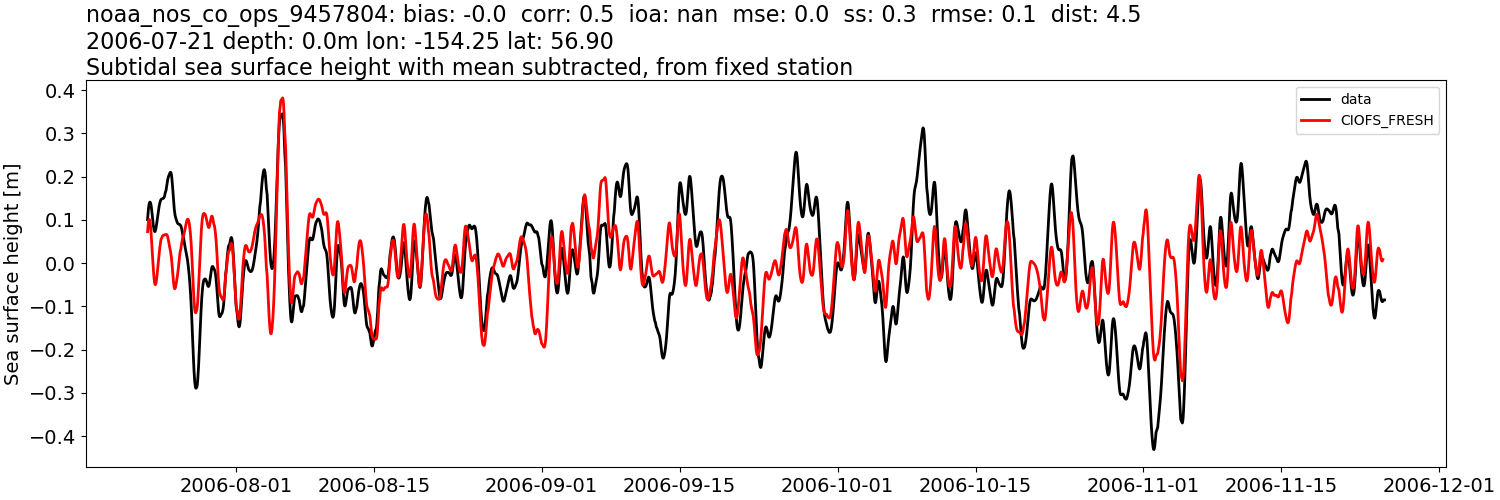
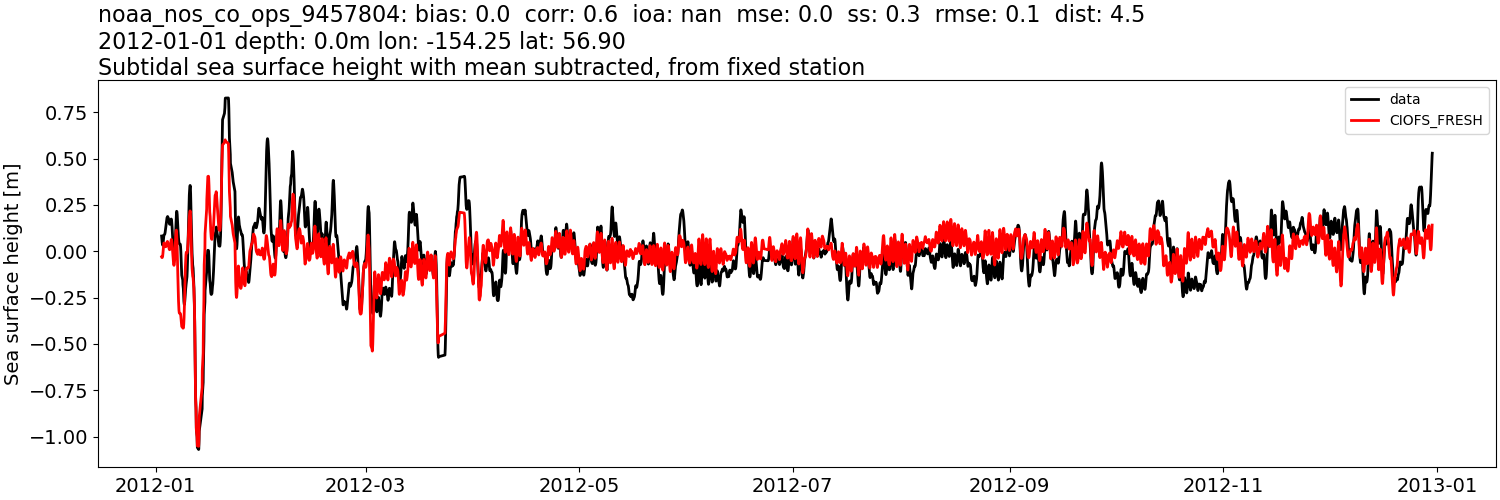
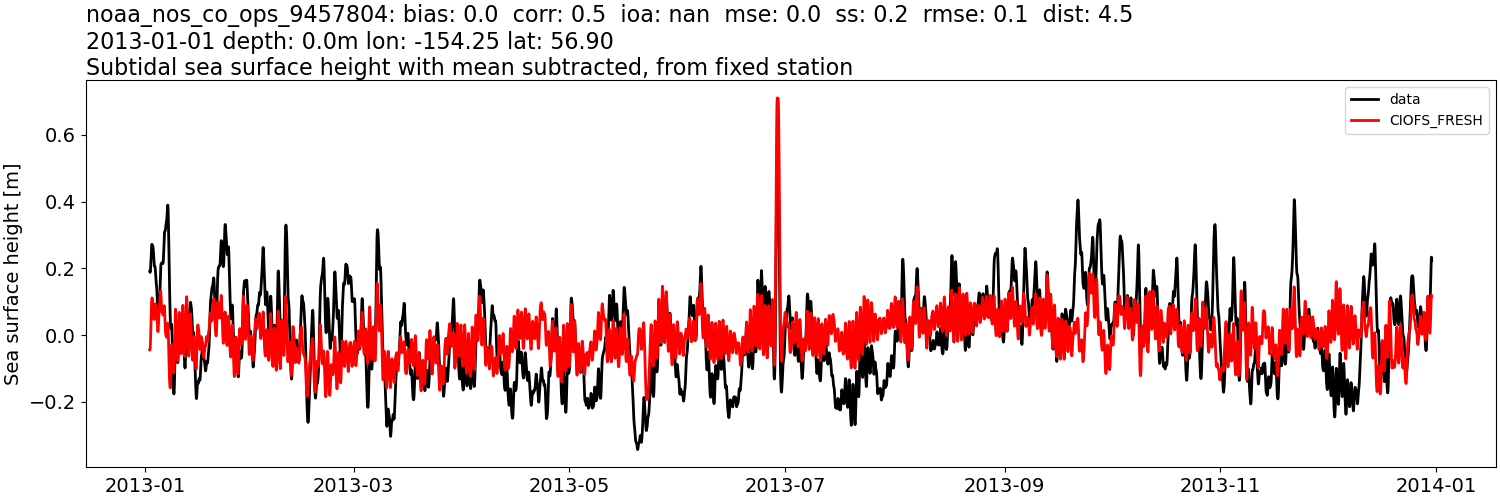
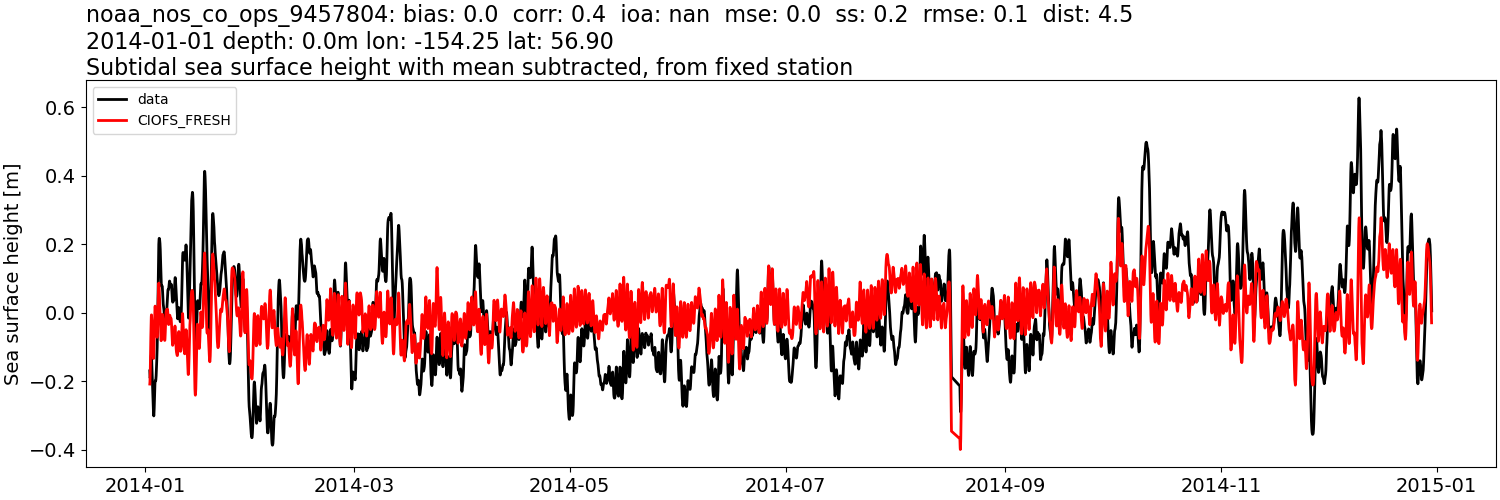
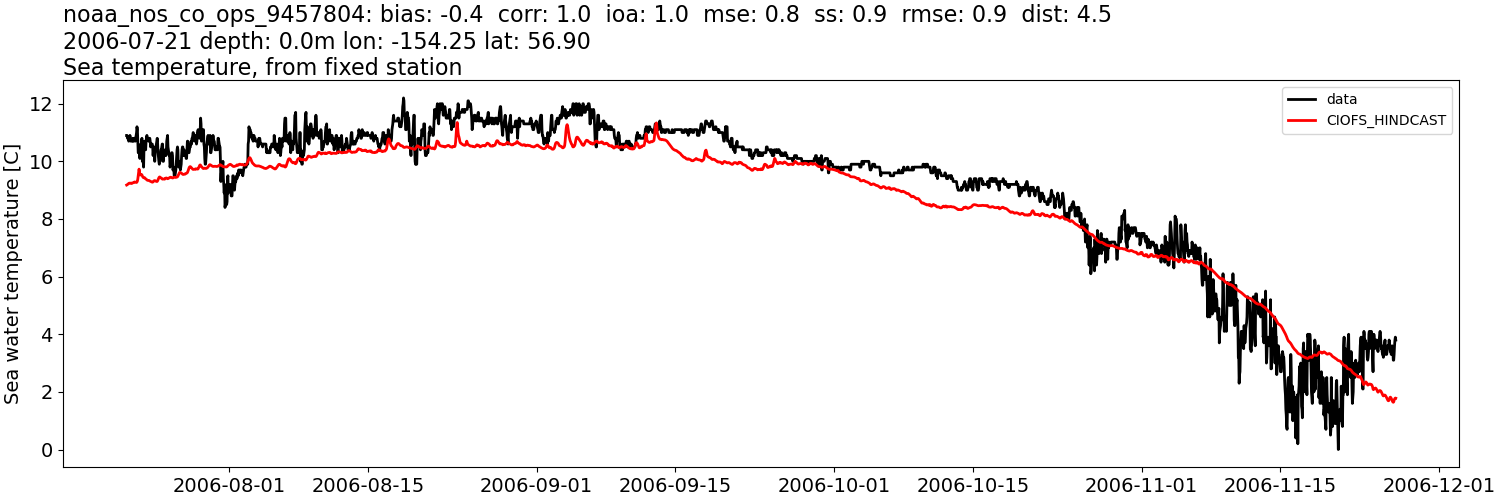
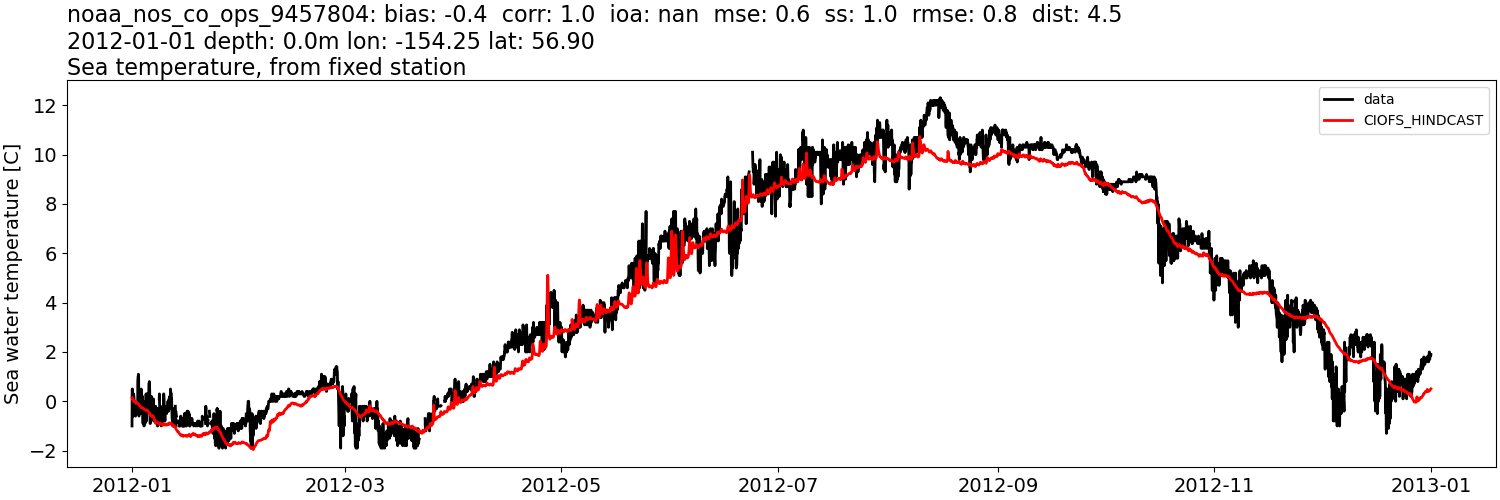
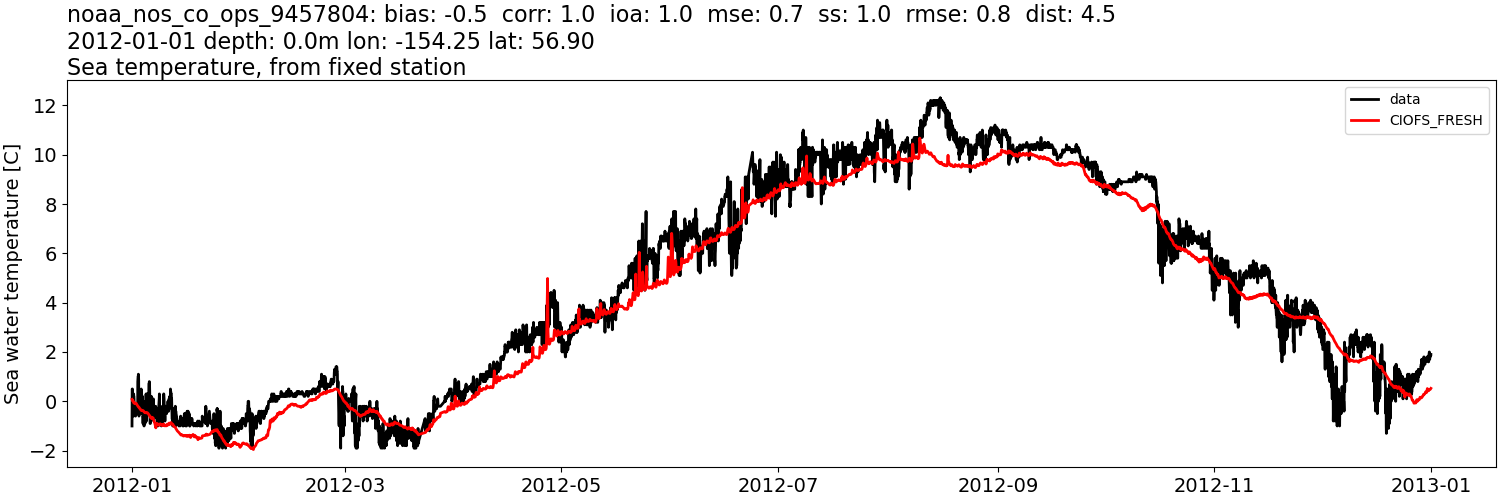
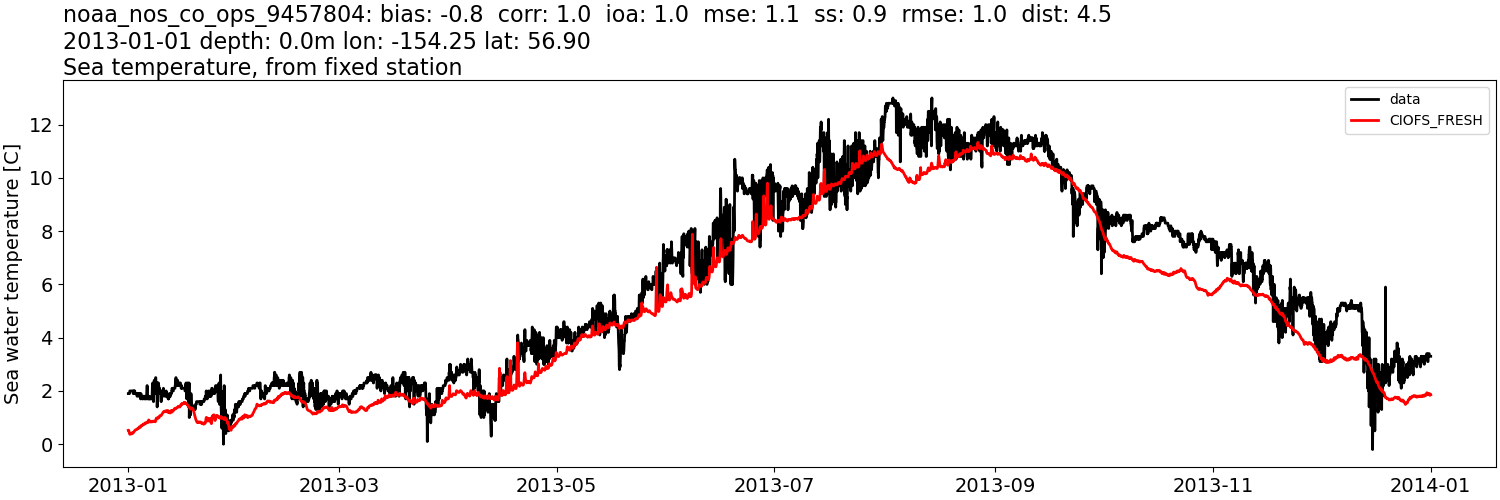
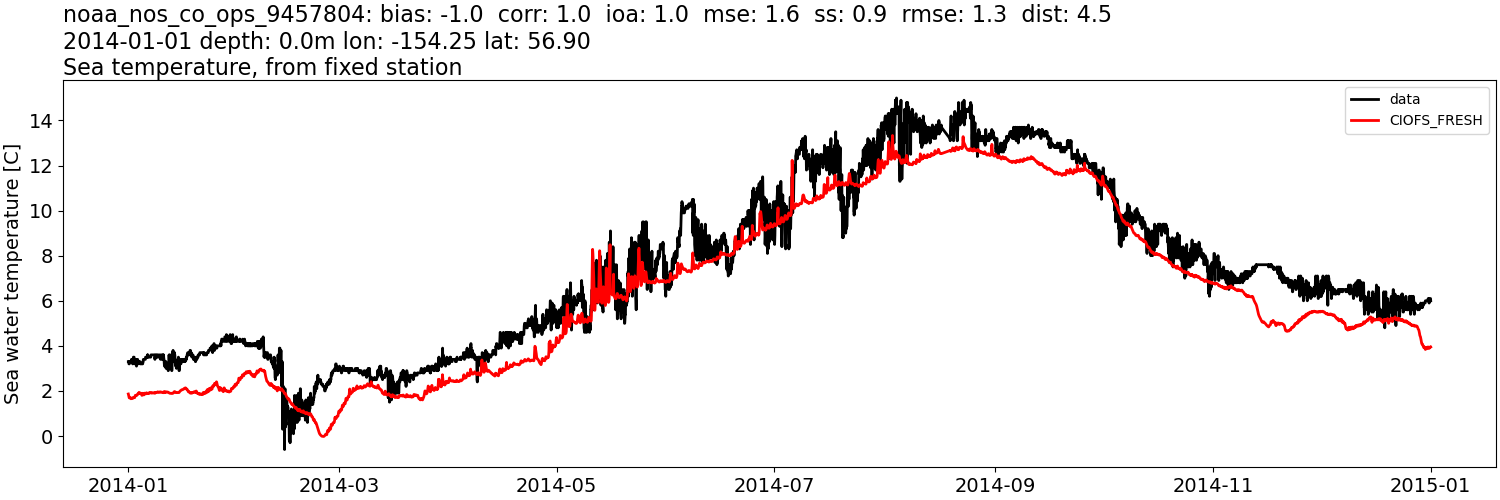
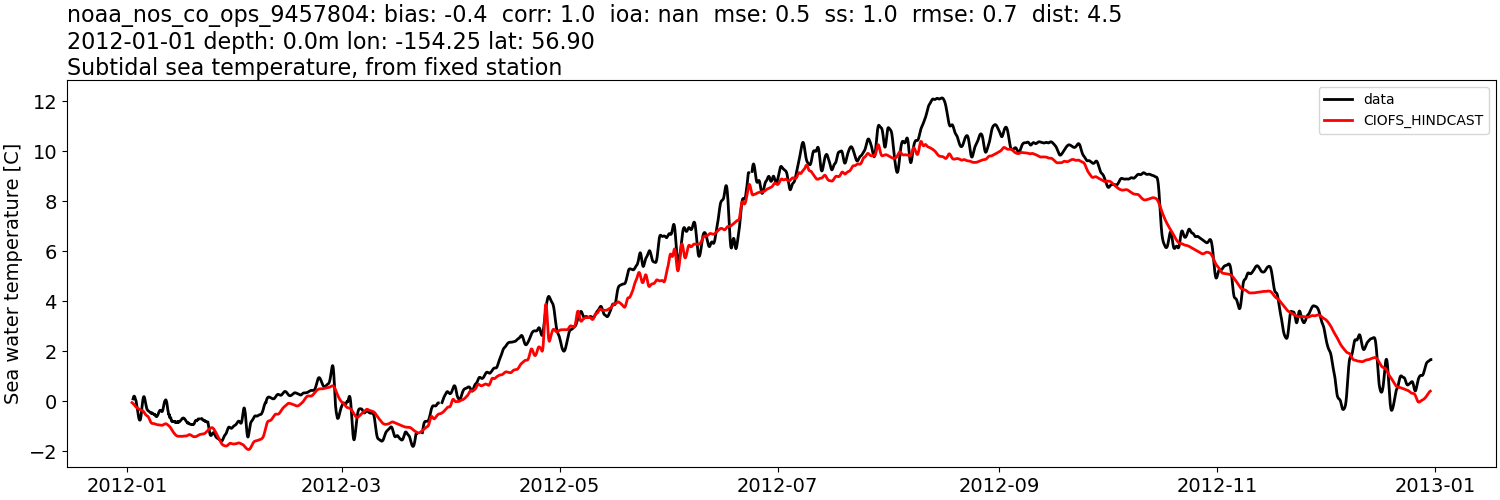
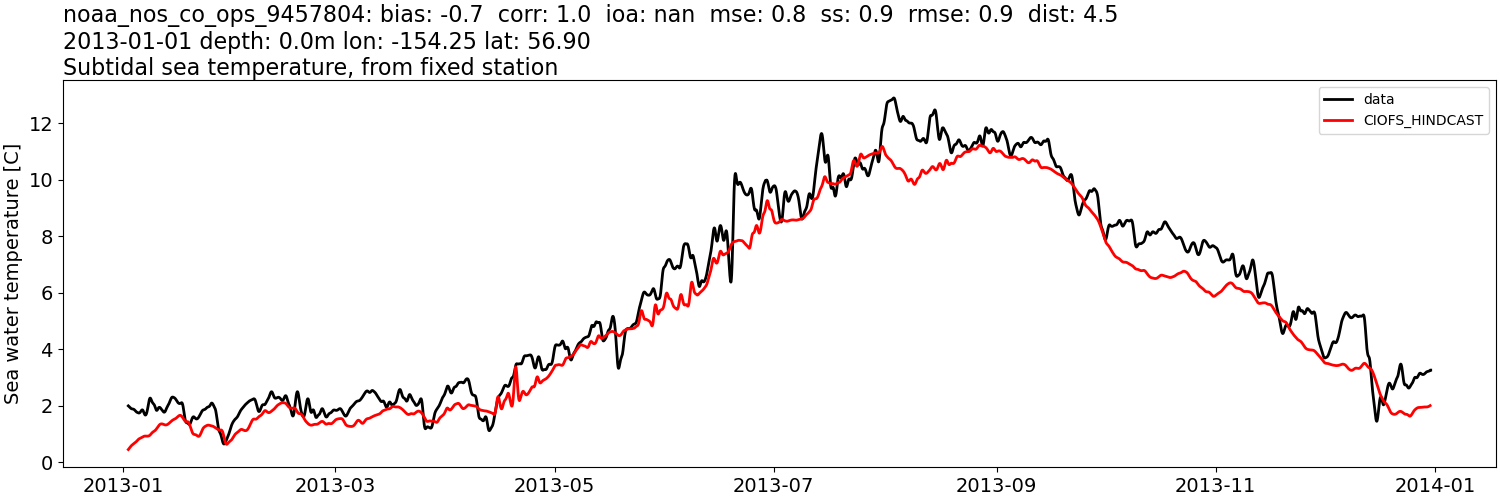
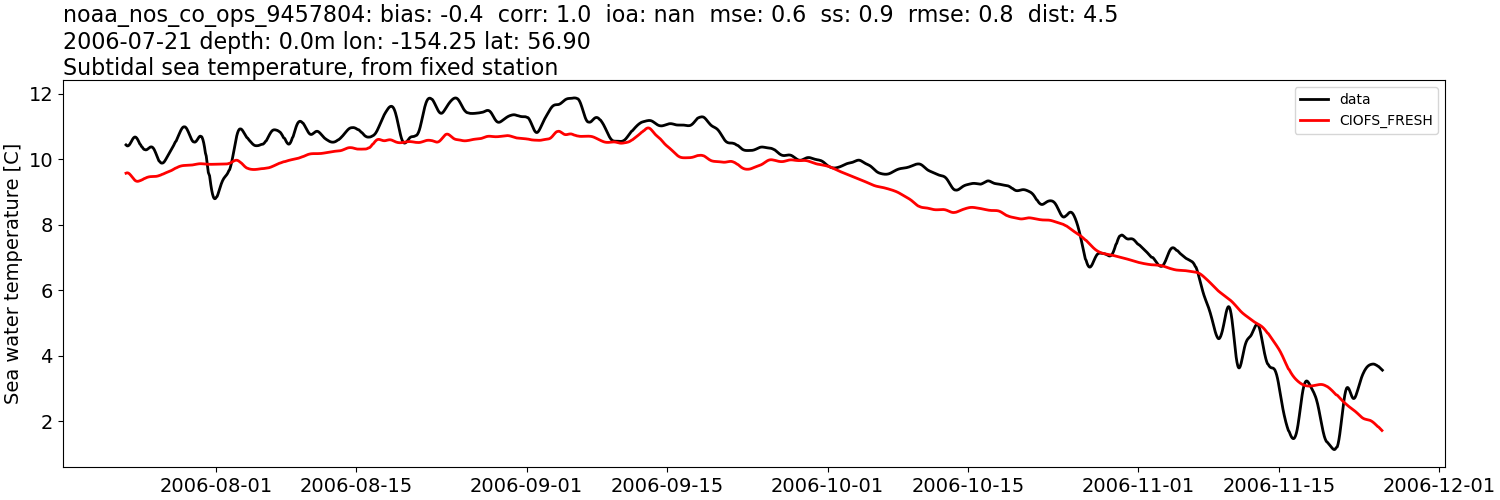
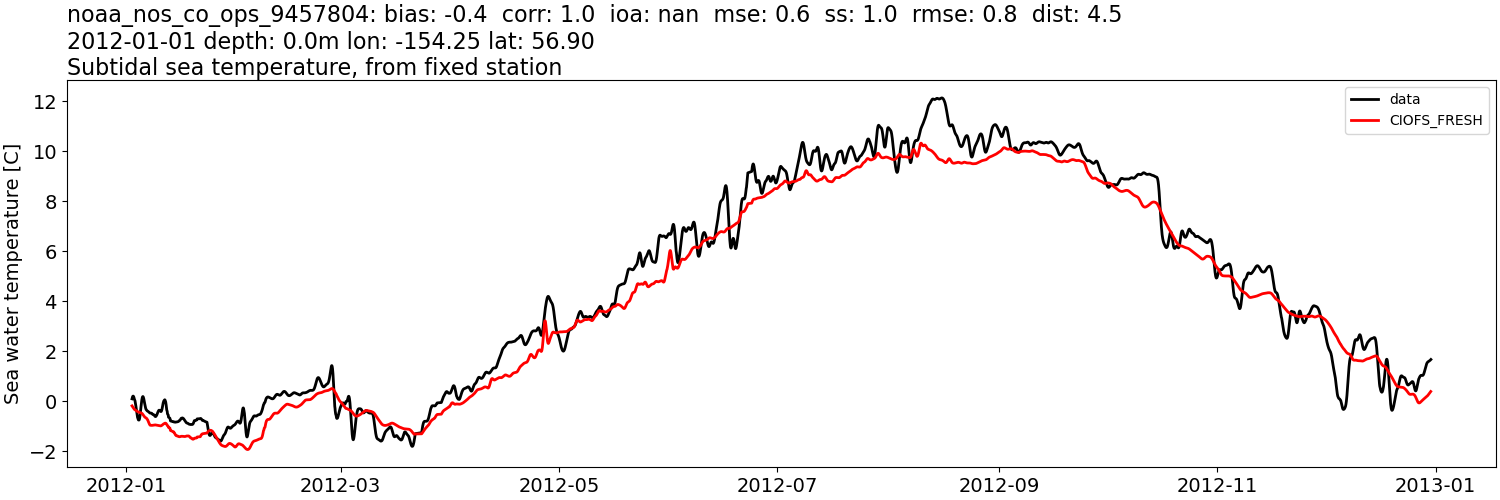
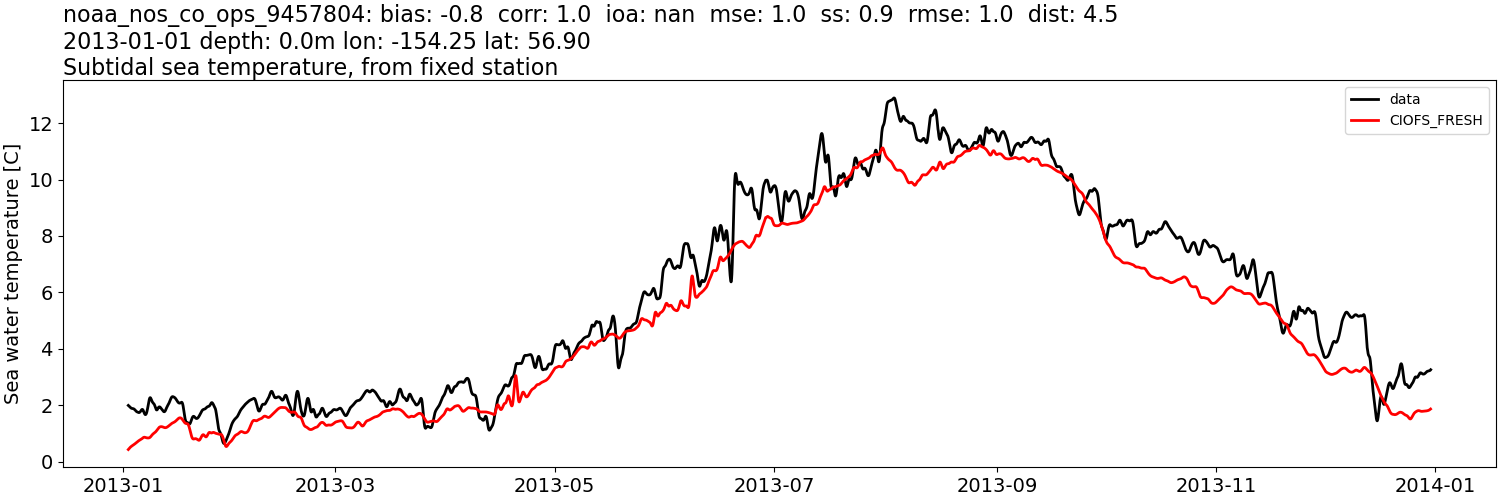
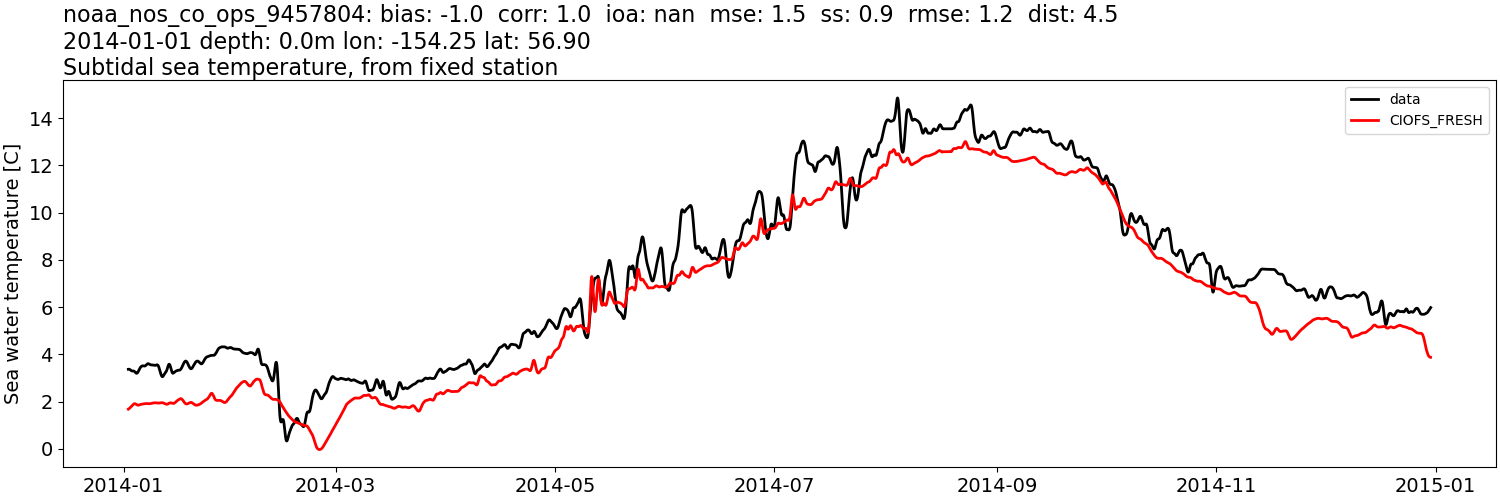
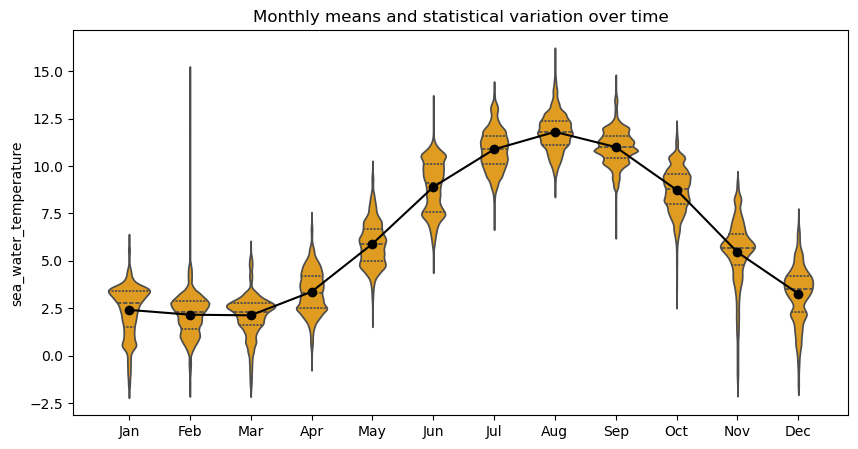
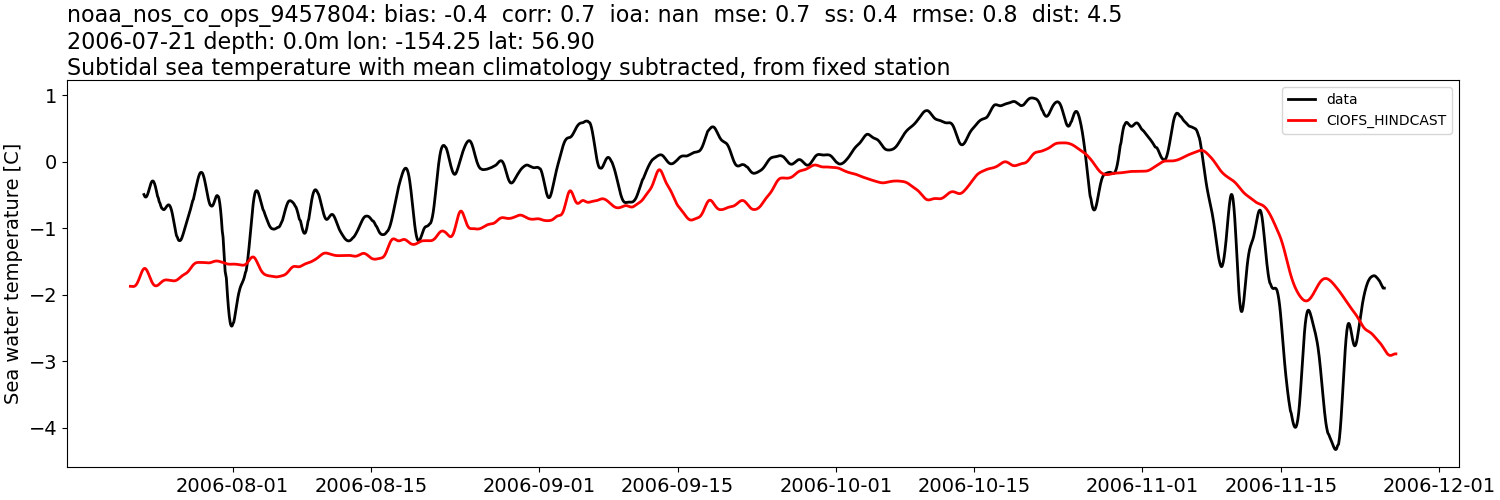
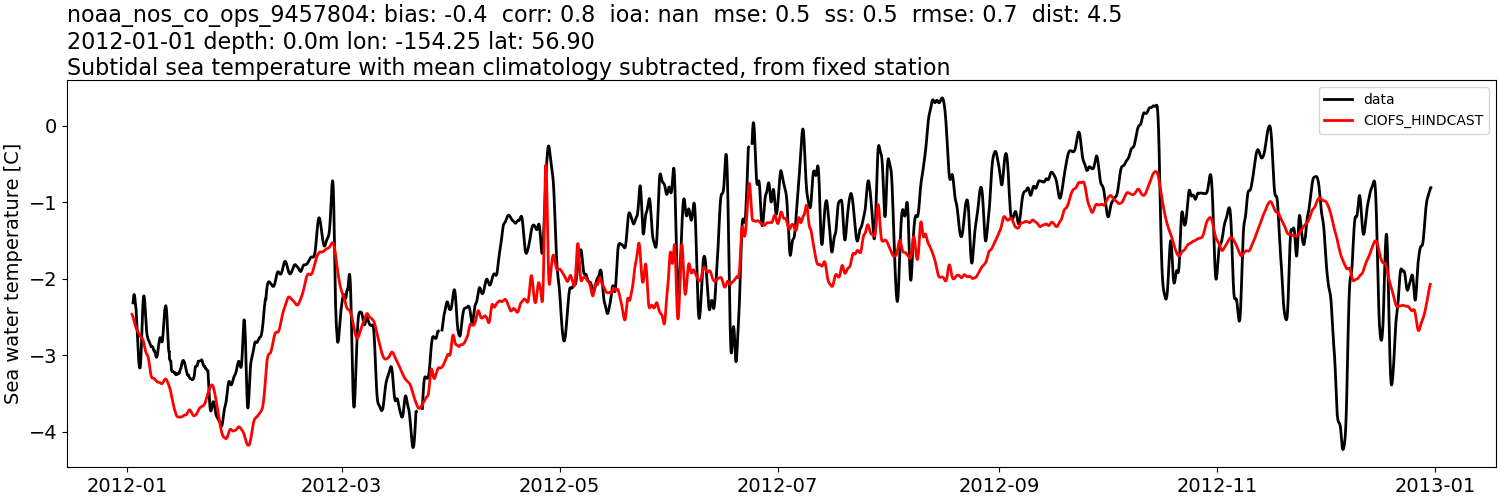
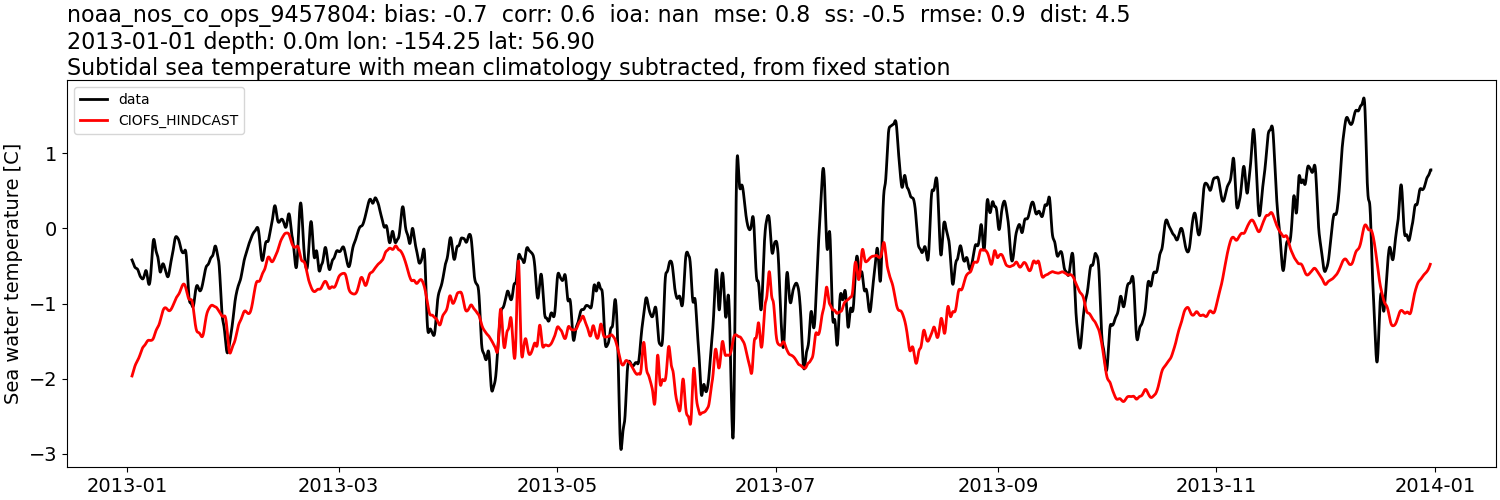
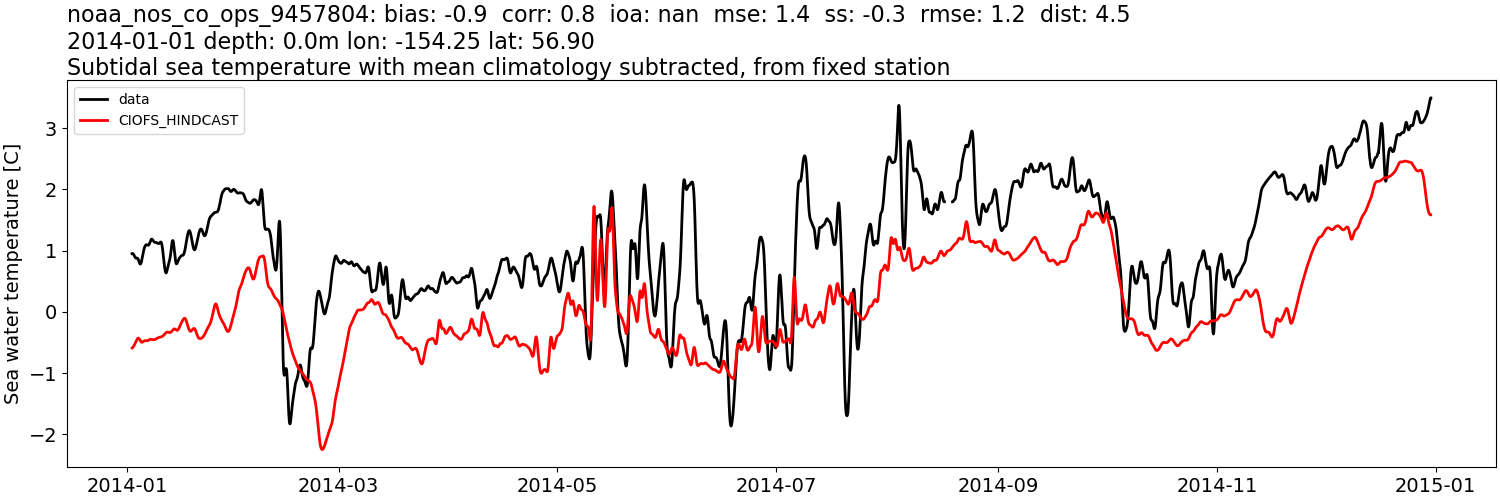
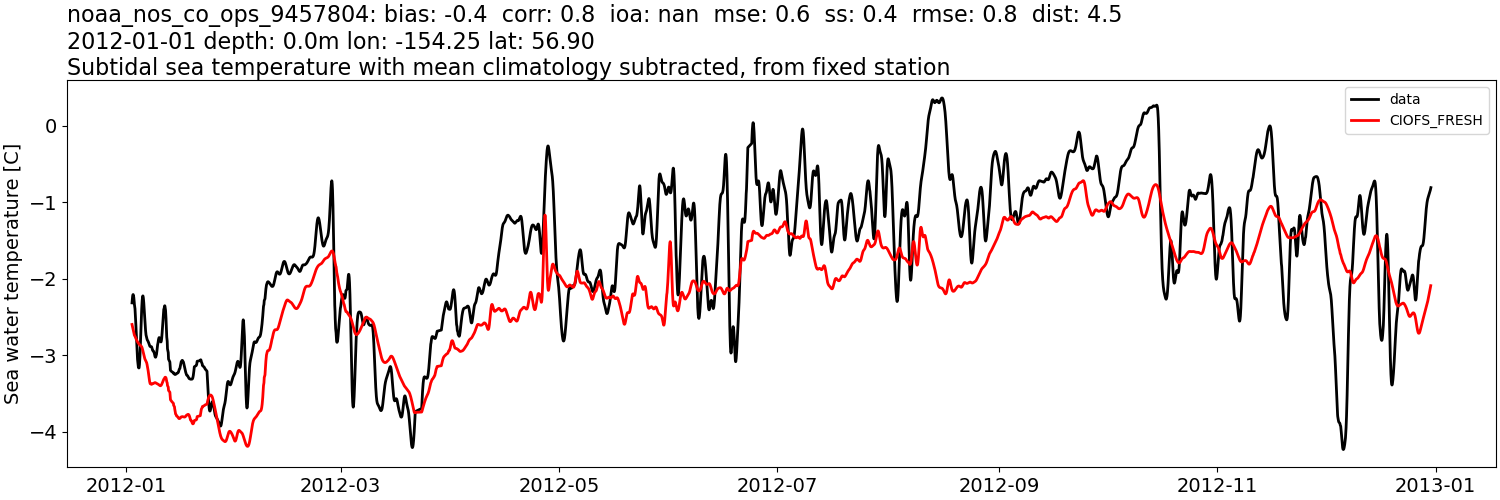
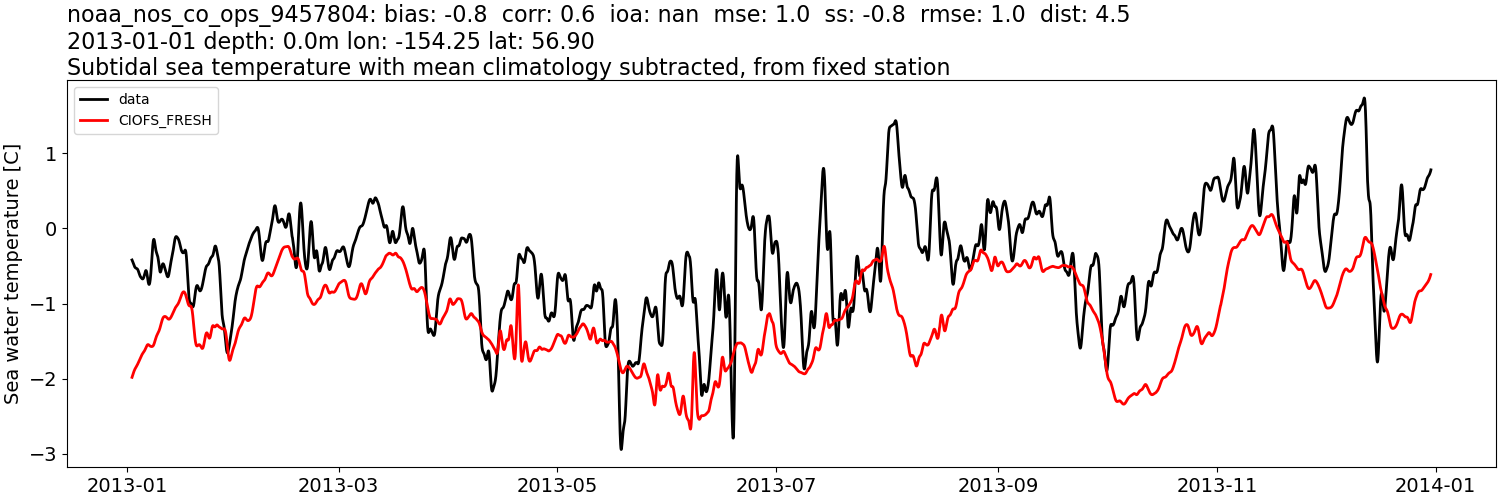
noaa_nos_co_ops_9457804#
Sea surface height: mean subtracted#
CIOFS_HINDCAST#
Comparison plots by year
2006

2012
2013
2014
CIOFS_FRESH#
Comparison plots by year
2006
2012

2013
2014
Sea surface height: mean subtracted, then tidally-filtered#
CIOFS_HINDCAST#
Comparison plots by year
2006
2012
2013
2014
CIOFS_FRESH#
Comparison plots by year
2006
2012
2013
2014
Sea water temperature:#
CIOFS_HINDCAST#
Comparison plots by year
2006
2012
2013

2014

CIOFS_FRESH#
Comparison plots by year
2006

2012
2013
2014
Sea water temperature: tidally-filtered#
CIOFS_HINDCAST#
Comparison plots by year
2006

2012
2013
2014

CIOFS_FRESH#
Comparison plots by year
2006
2012
2013
2014
Sea water temperature: tidally-filtered, then monthly mean from data subtracted#
CIOFS_HINDCAST#
Comparison plots by year
2006
2012
2013
2014
CIOFS_FRESH#
Comparison plots by year
2006

2012
2013
2014

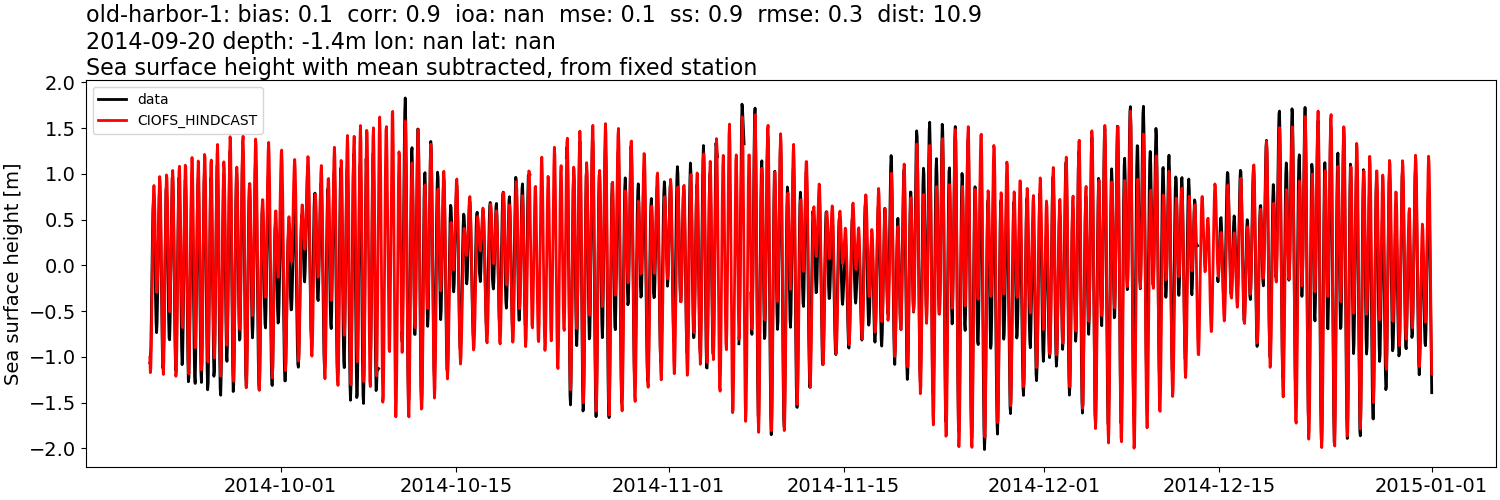
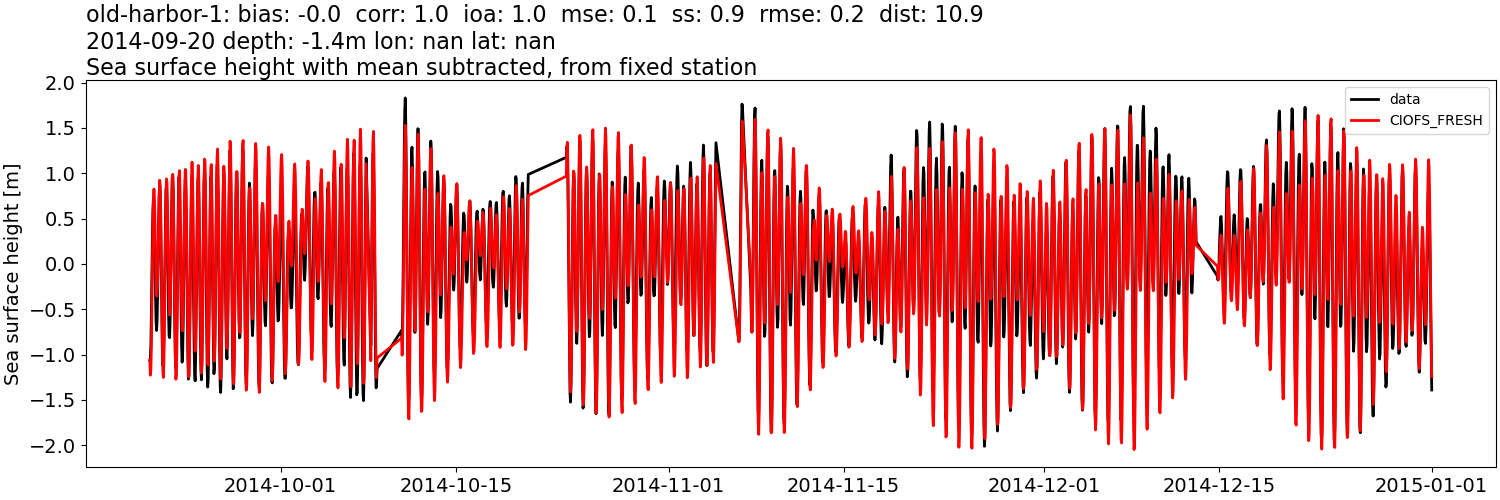
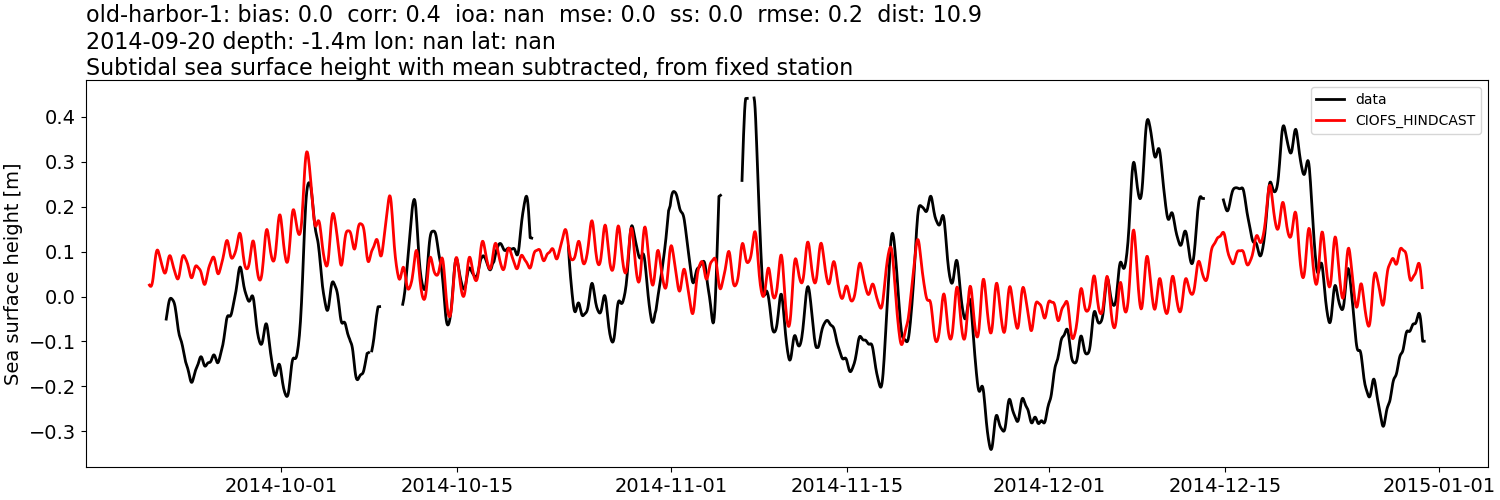
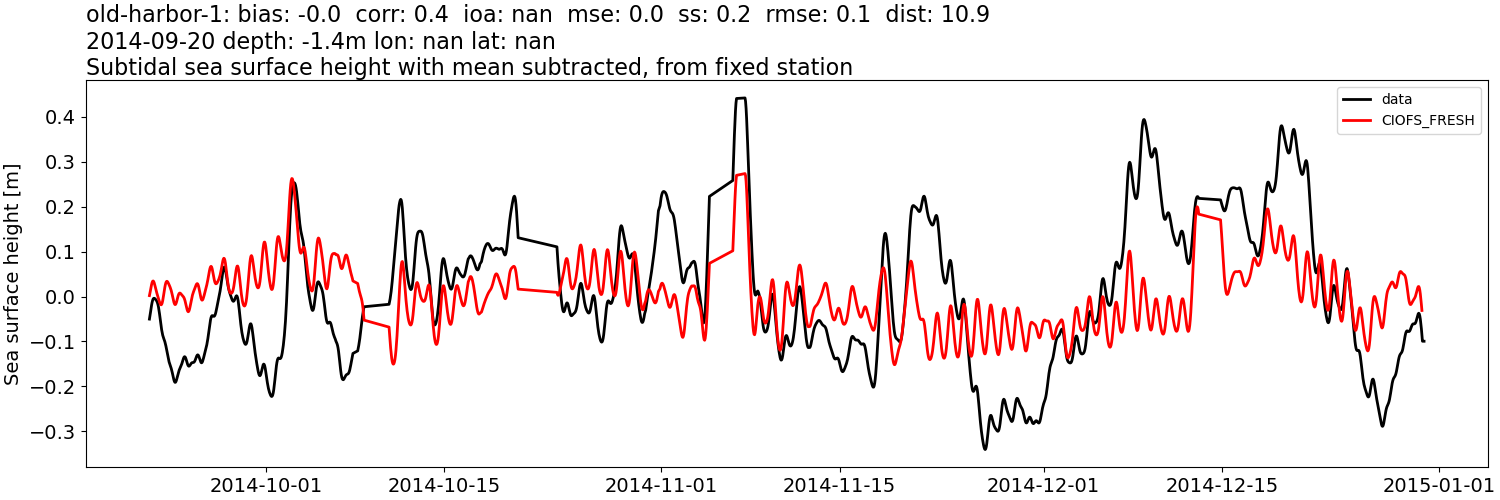
old-harbor-1#
Sea surface height: mean subtracted#
CIOFS_HINDCAST#
CIOFS_FRESH#
Sea surface height: mean subtracted, then tidally-filtered#
CIOFS_HINDCAST#
CIOFS_FRESH#
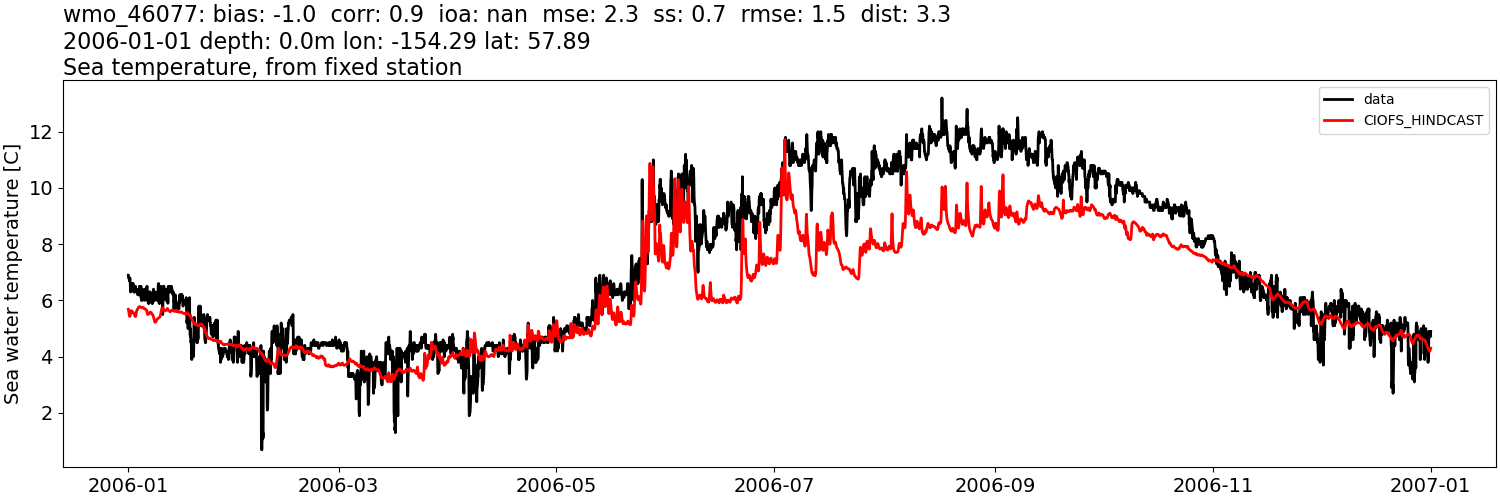
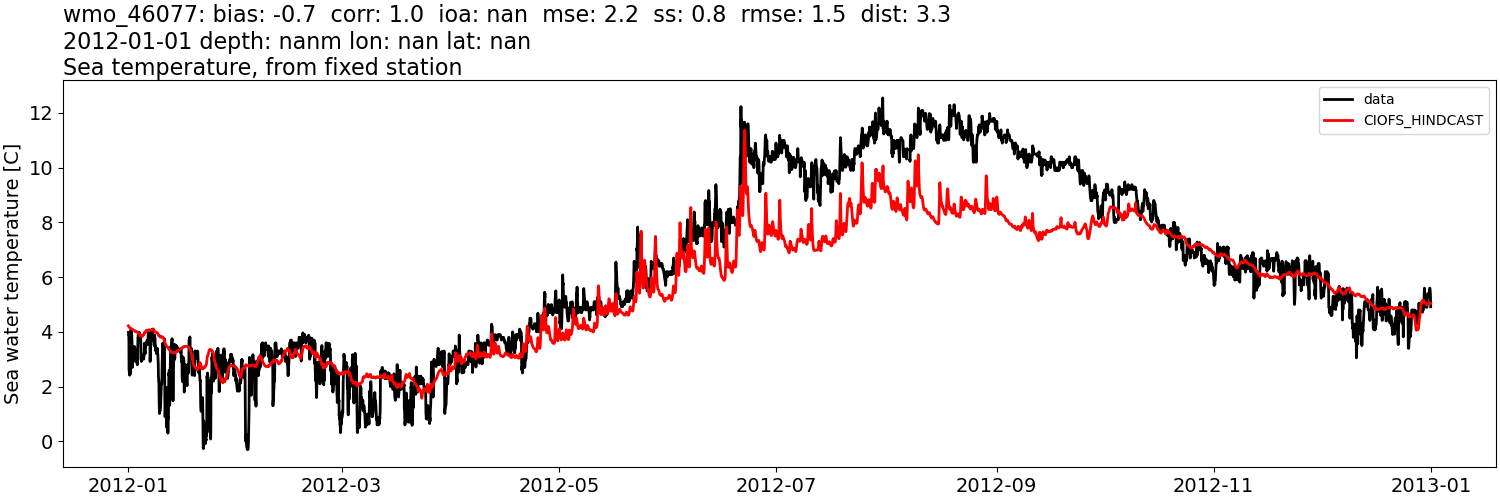
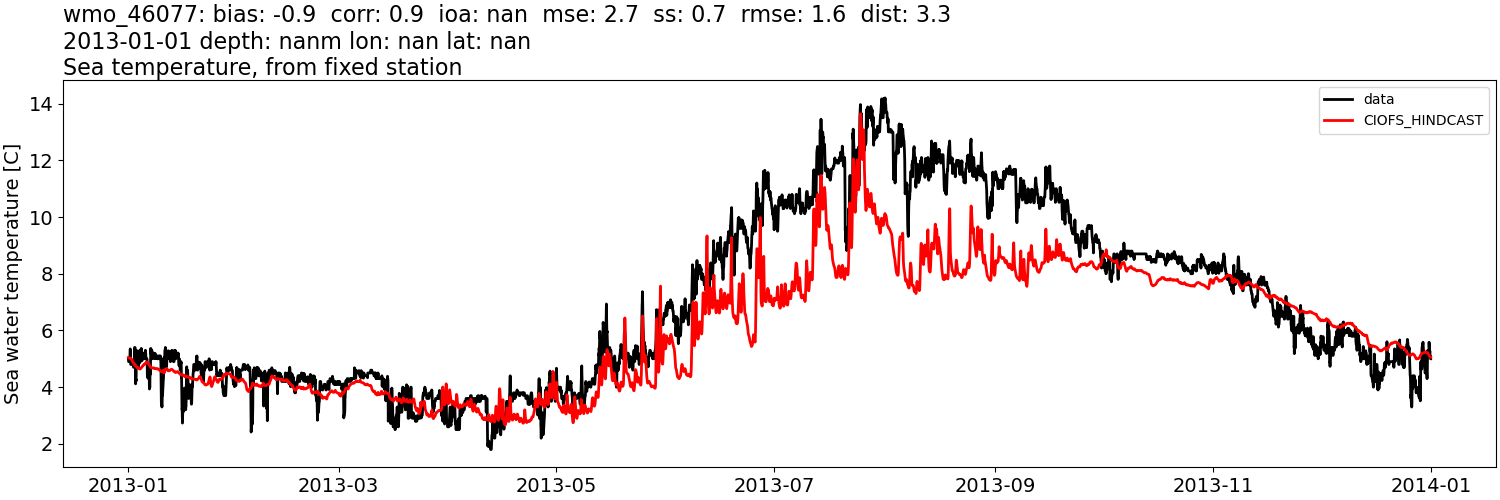
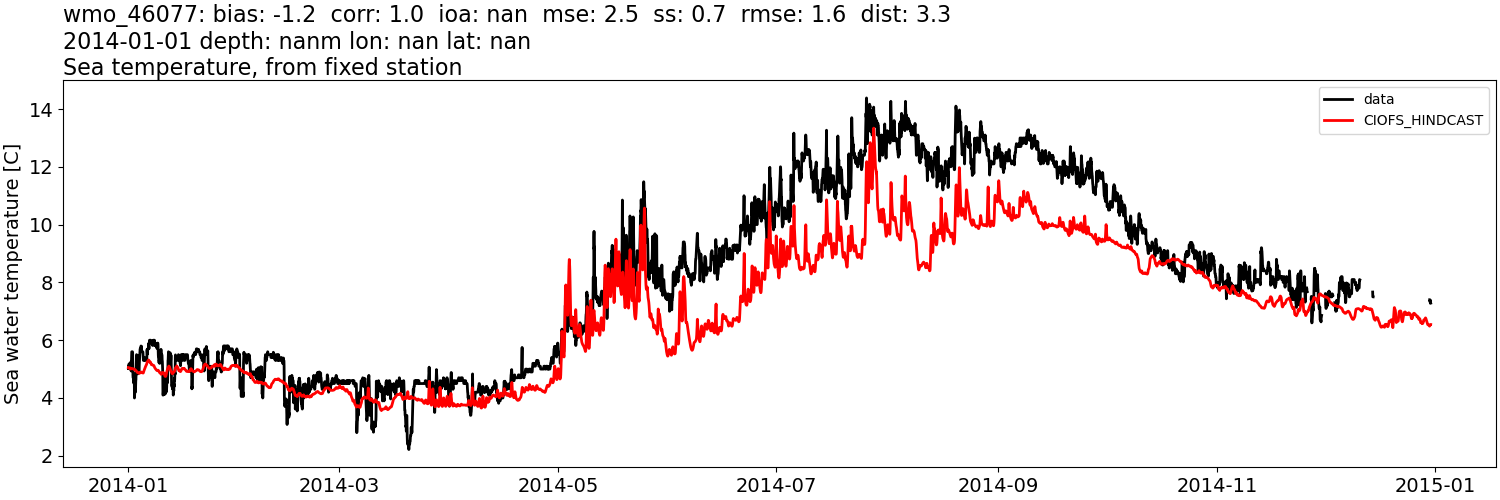
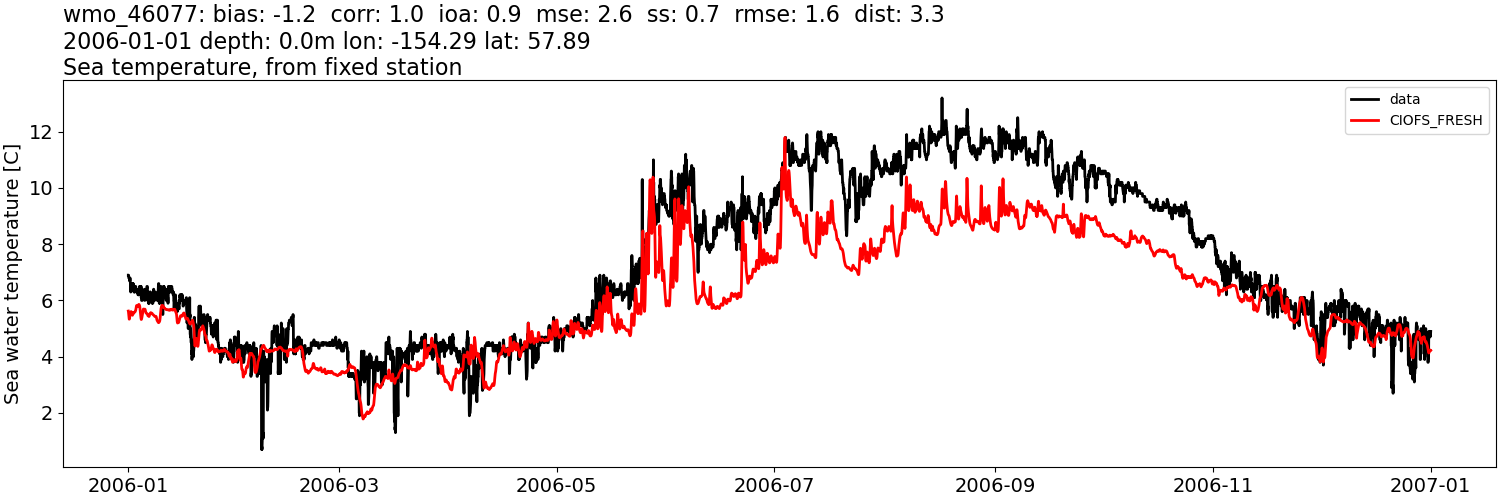
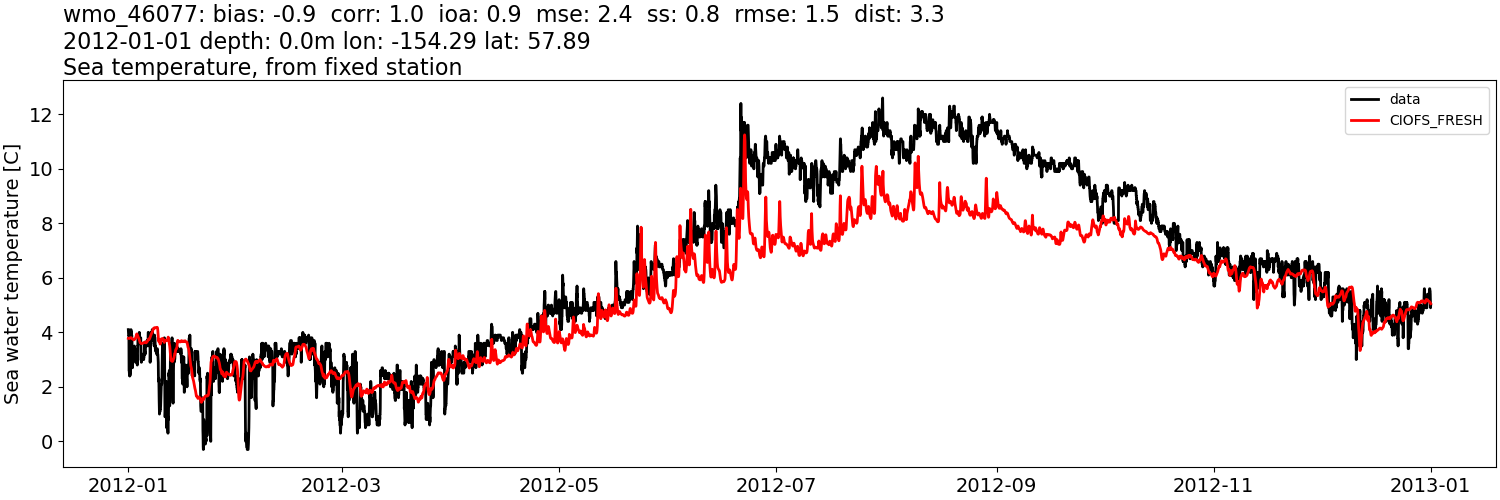
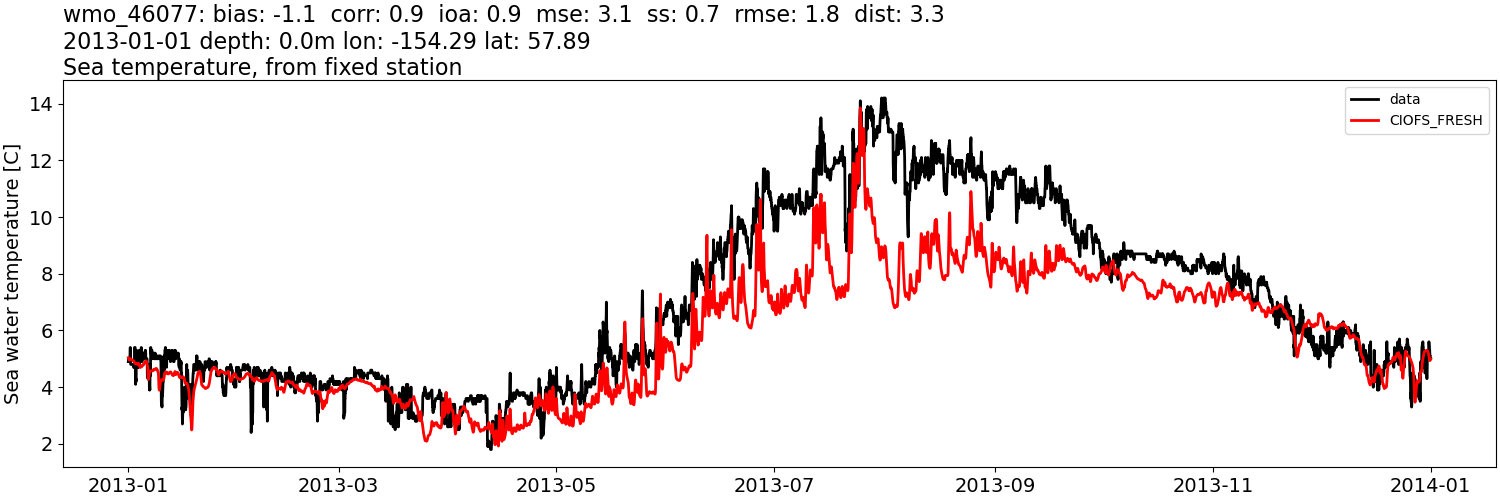
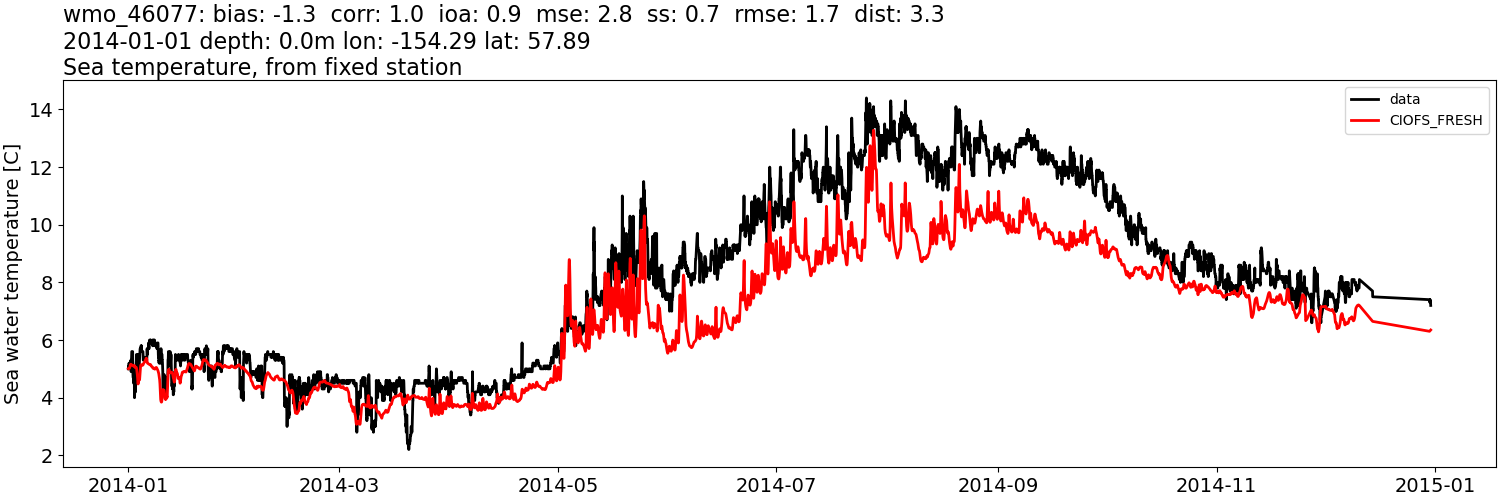
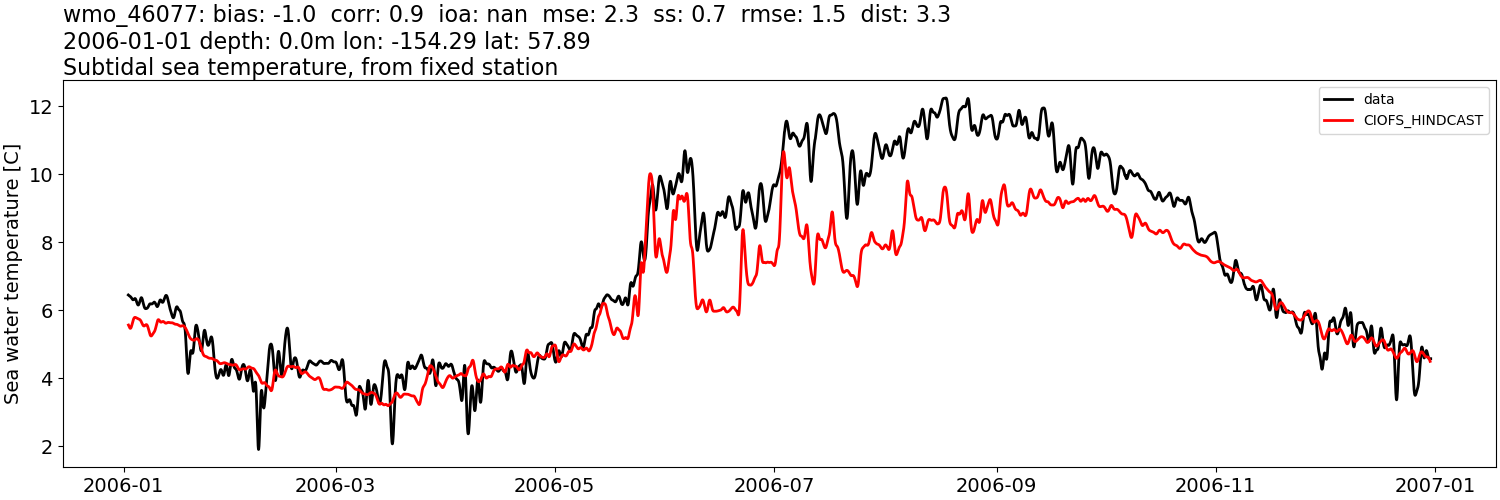
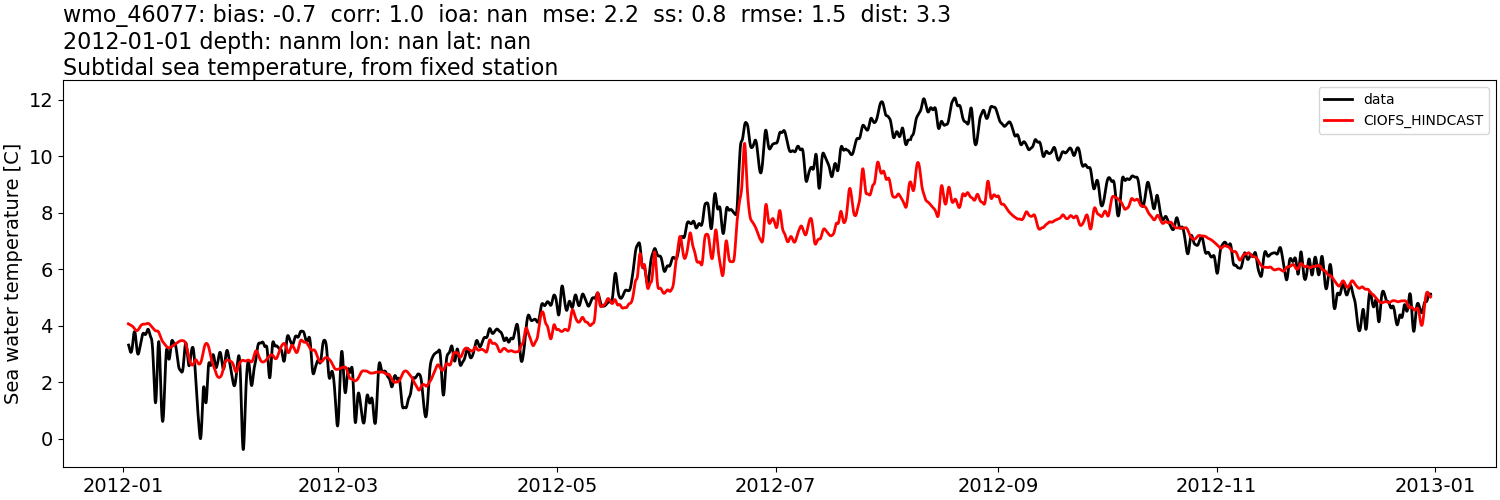
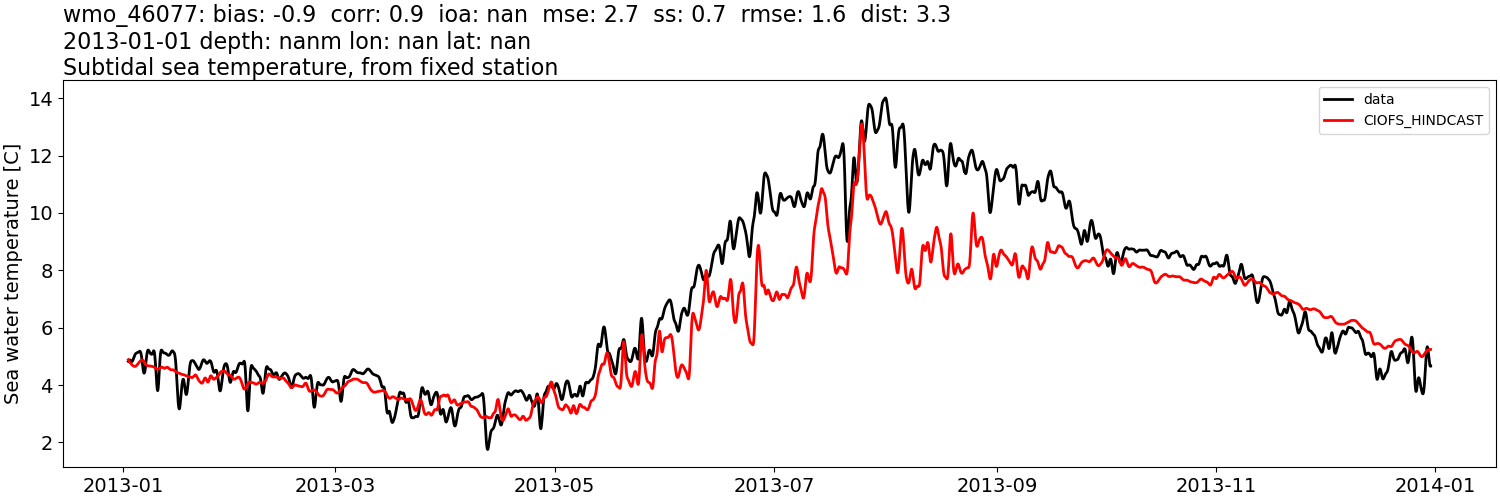
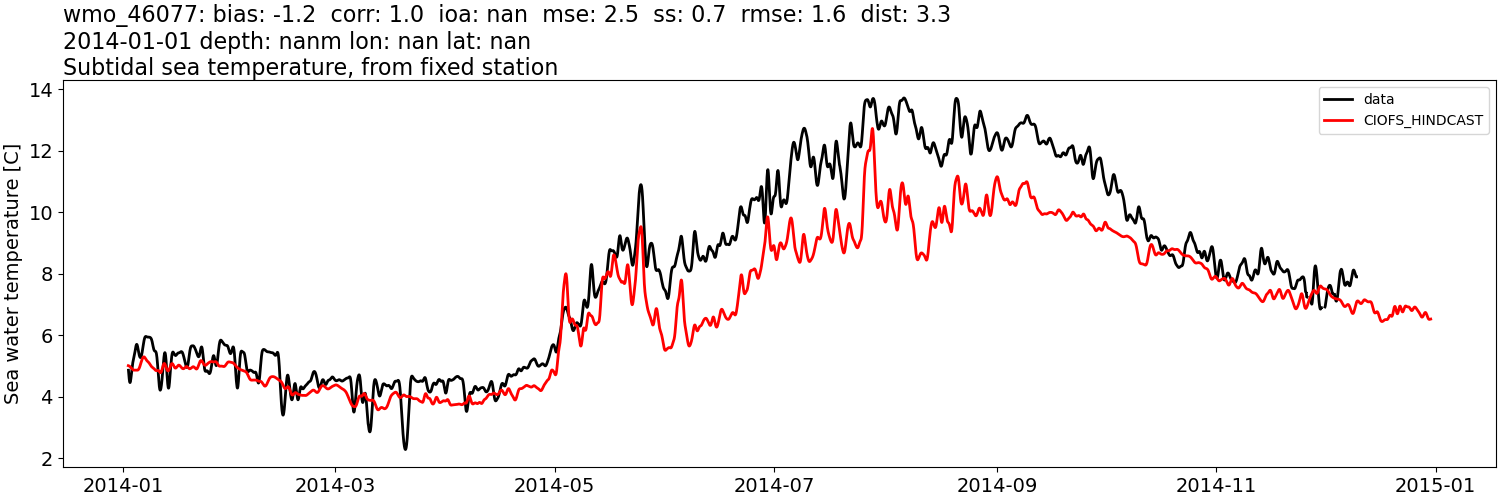
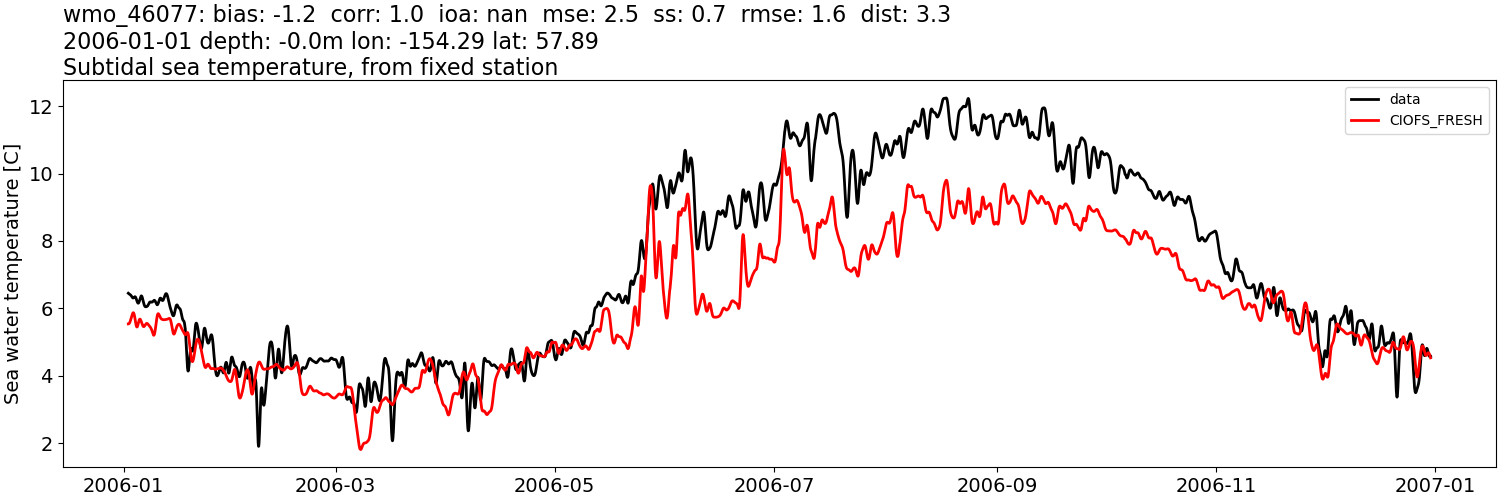
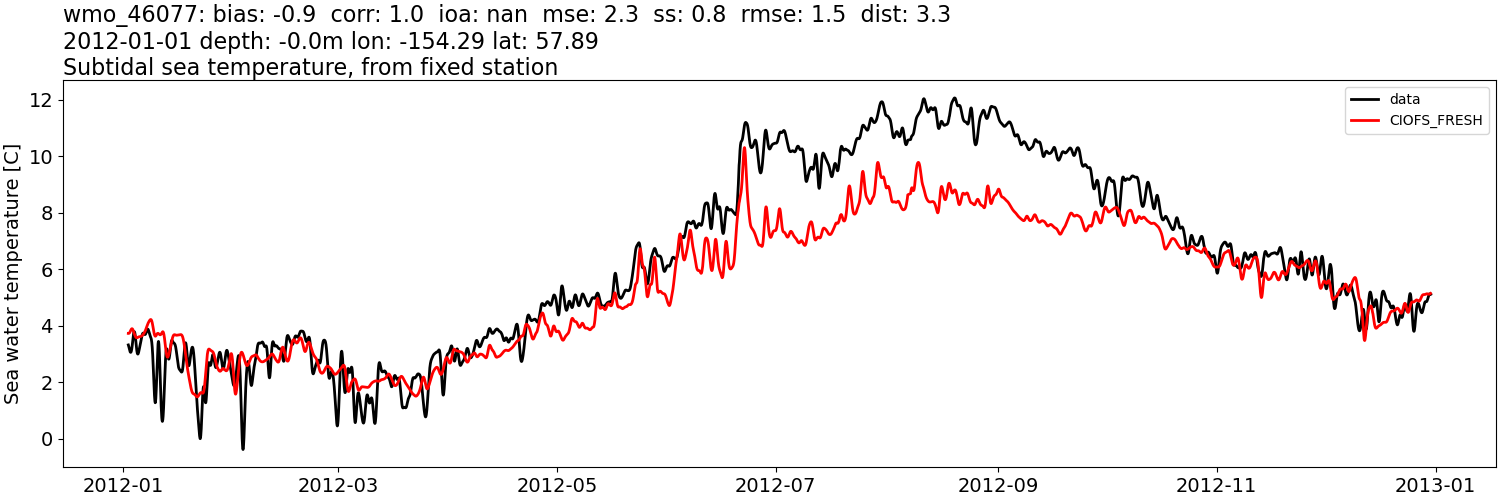
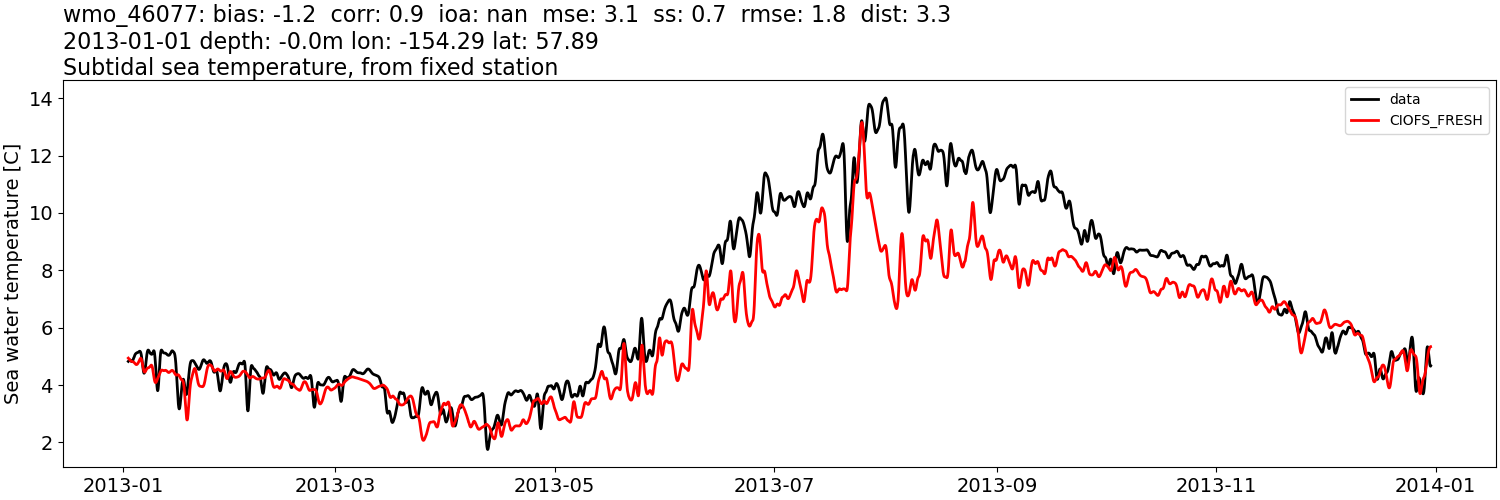
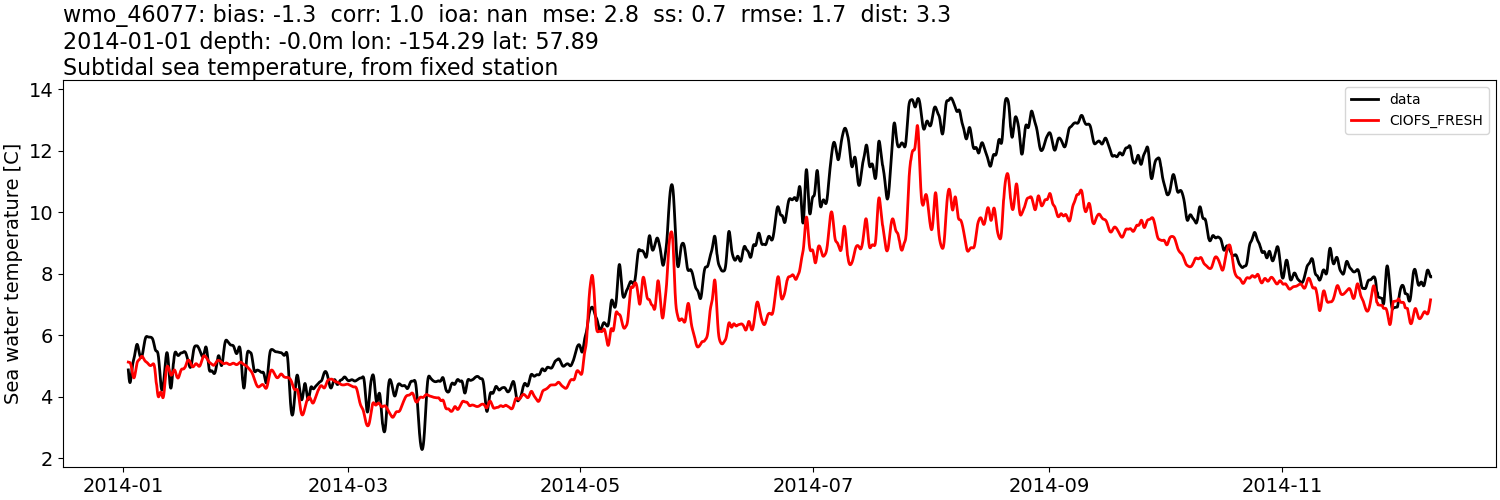
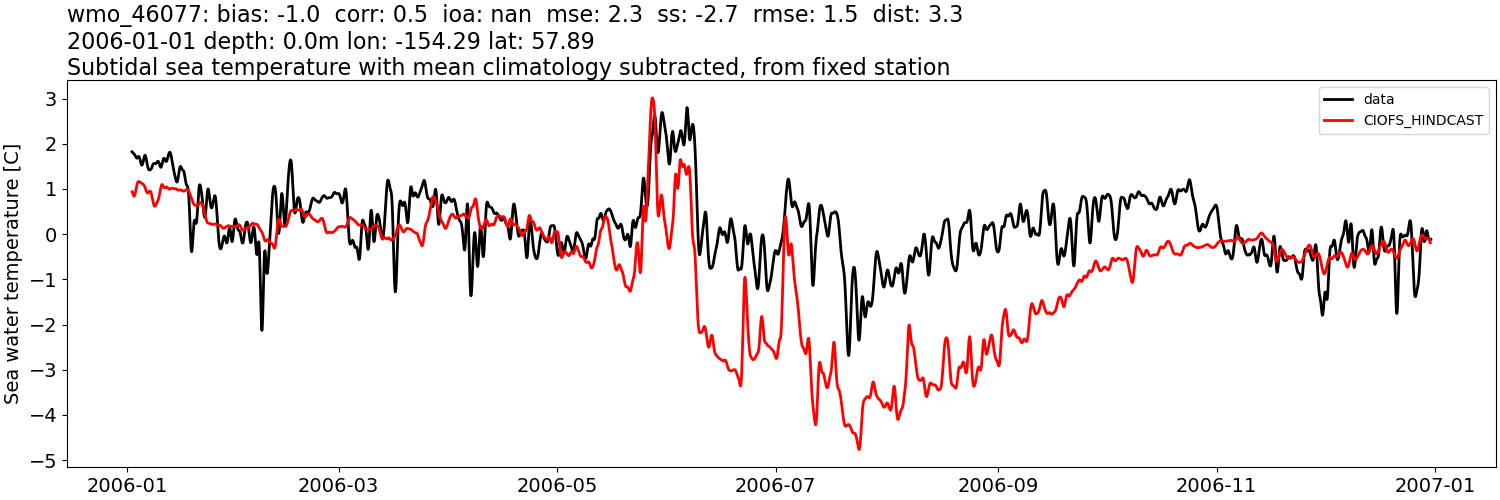
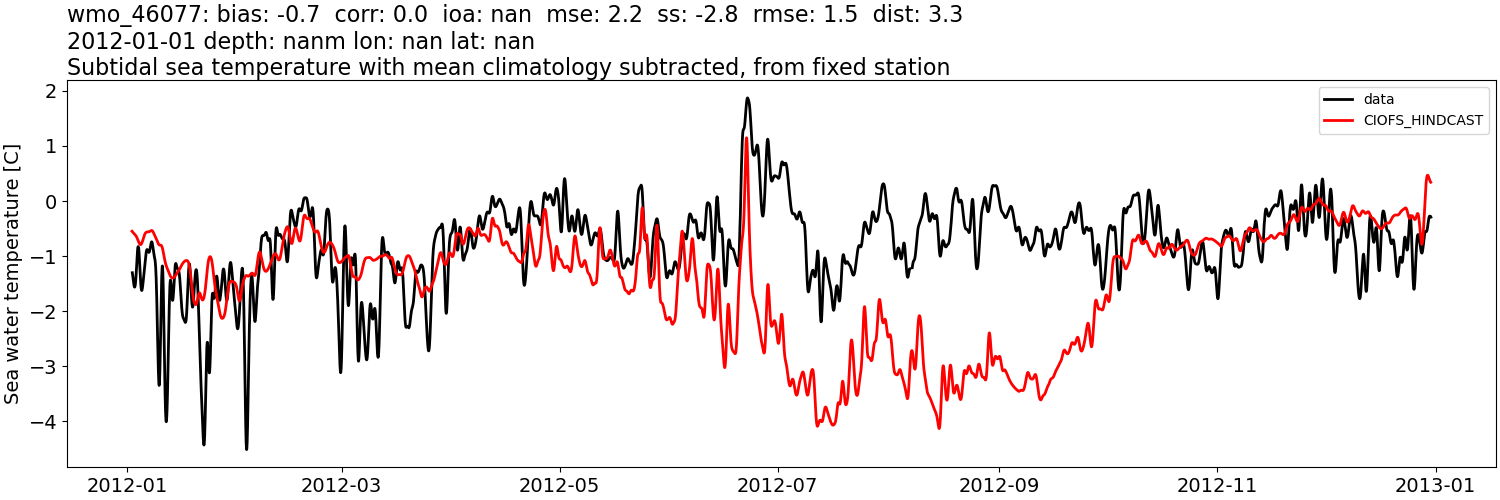
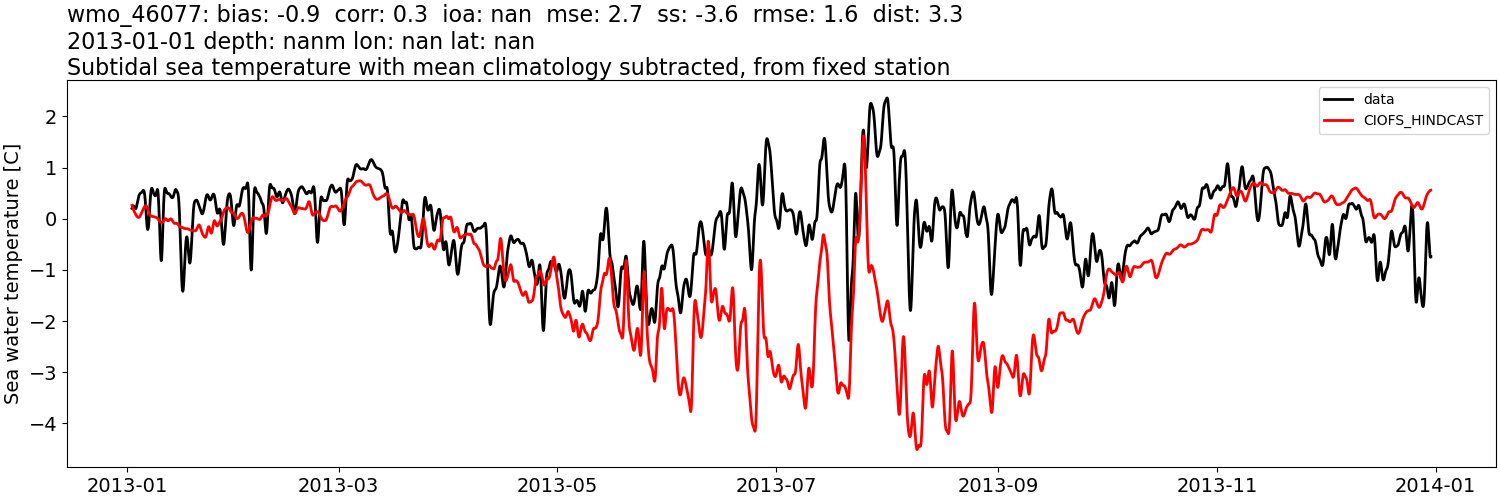
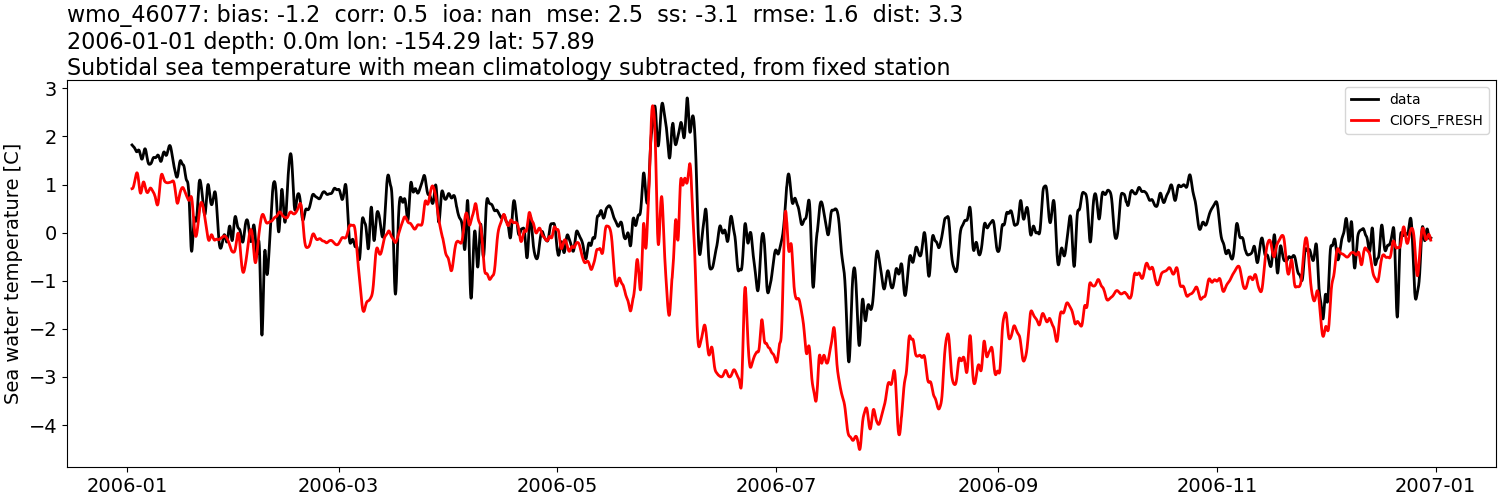
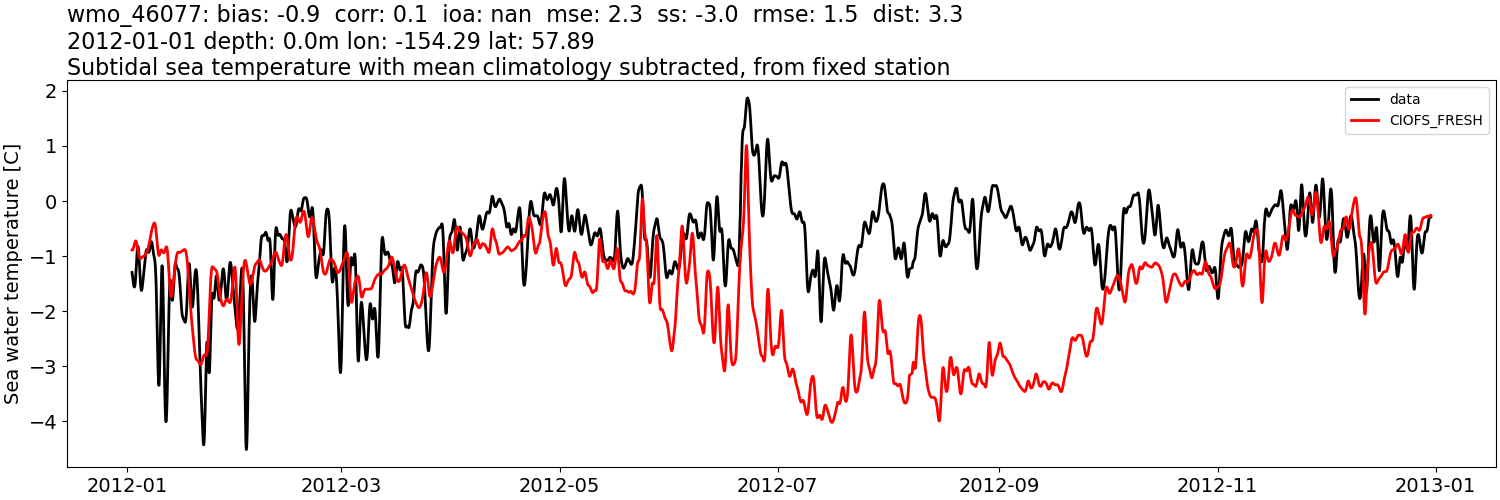
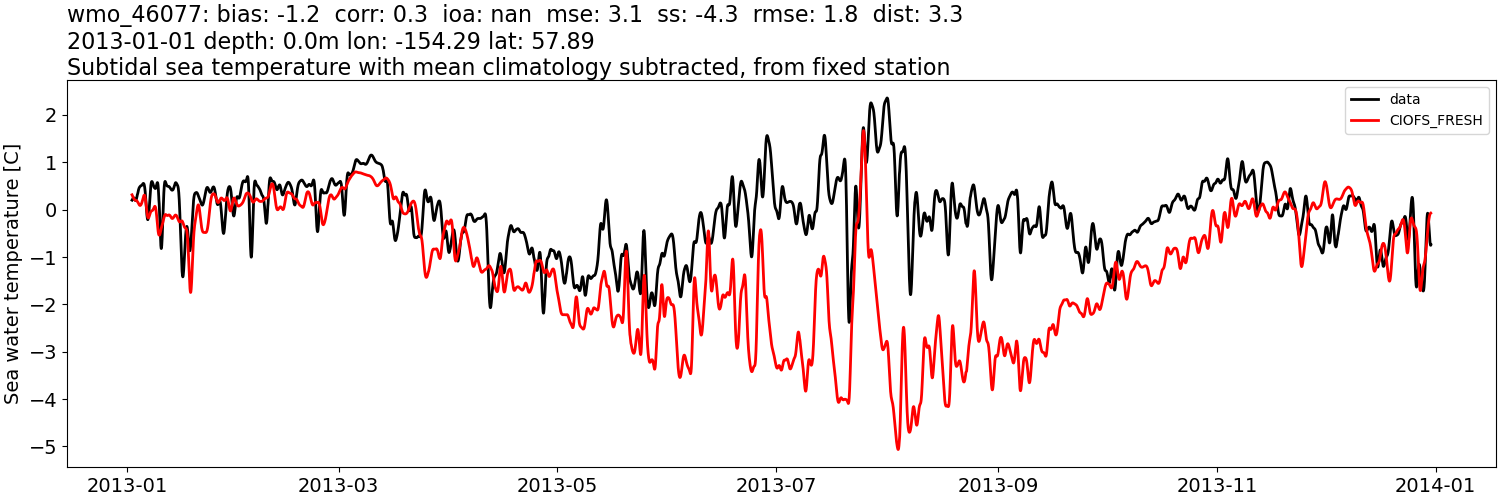
wmo_46077#
Sea water temperature:#
CIOFS_HINDCAST#
Comparison plots by year
2006
2012
2013
2014
CIOFS_FRESH#
Comparison plots by year
2006
2012
2013
2014
Sea water temperature: tidally-filtered#
CIOFS_HINDCAST#
Comparison plots by year
2006
2012
2013
2014
CIOFS_FRESH#
Comparison plots by year
2006
2012
2013
2014
Sea water temperature: tidally-filtered, then monthly mean from data subtracted#
CIOFS_HINDCAST#
Comparison plots by year
2006
2012
2013
2014

CIOFS_FRESH#
Comparison plots by year
2006
2012
2013
2014
