Moorings (UAF): Kodiak Island, Peterson Bay#
moorings_uaf
See the original full dataset description page in the original report for more information or the new catalog page.
uaf_ocean_acidification_resea_ko#
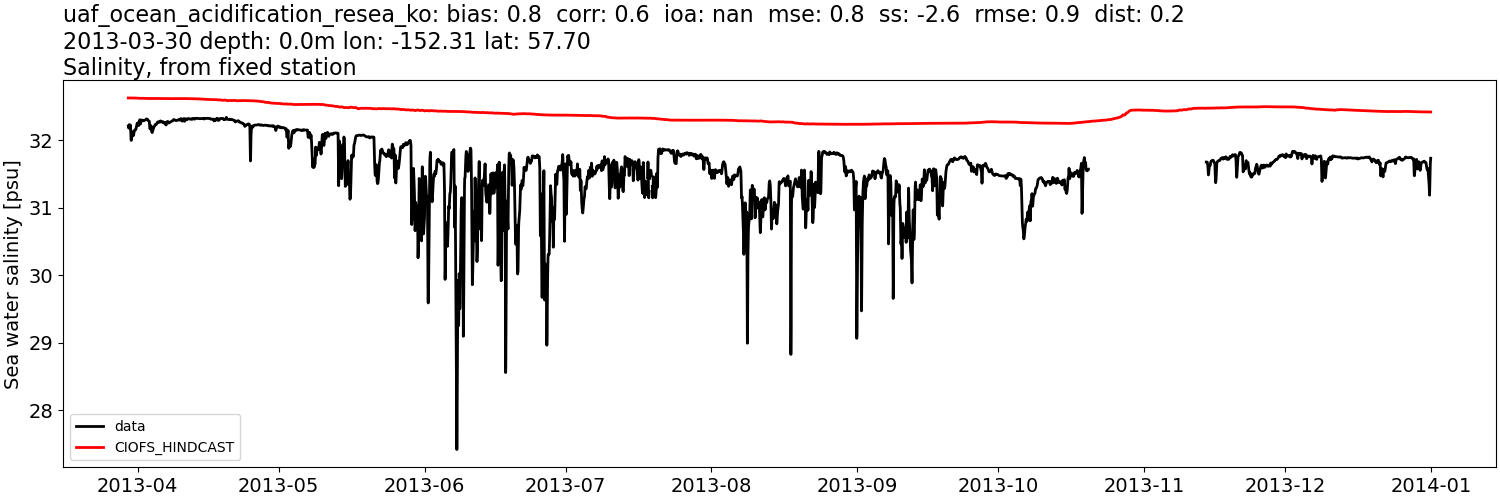
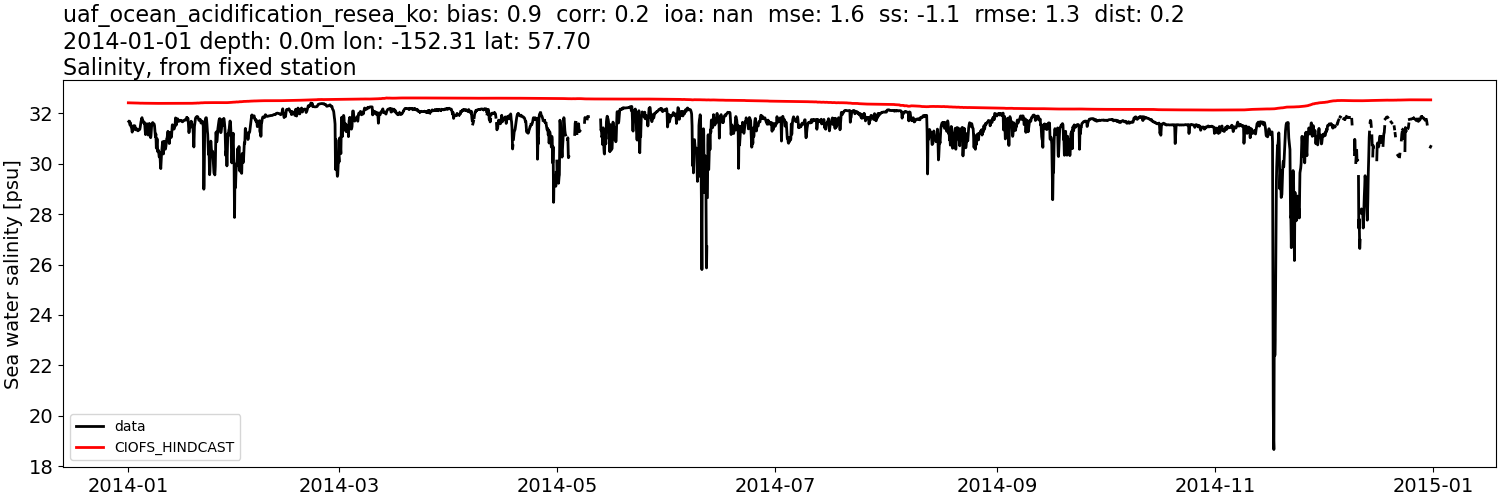
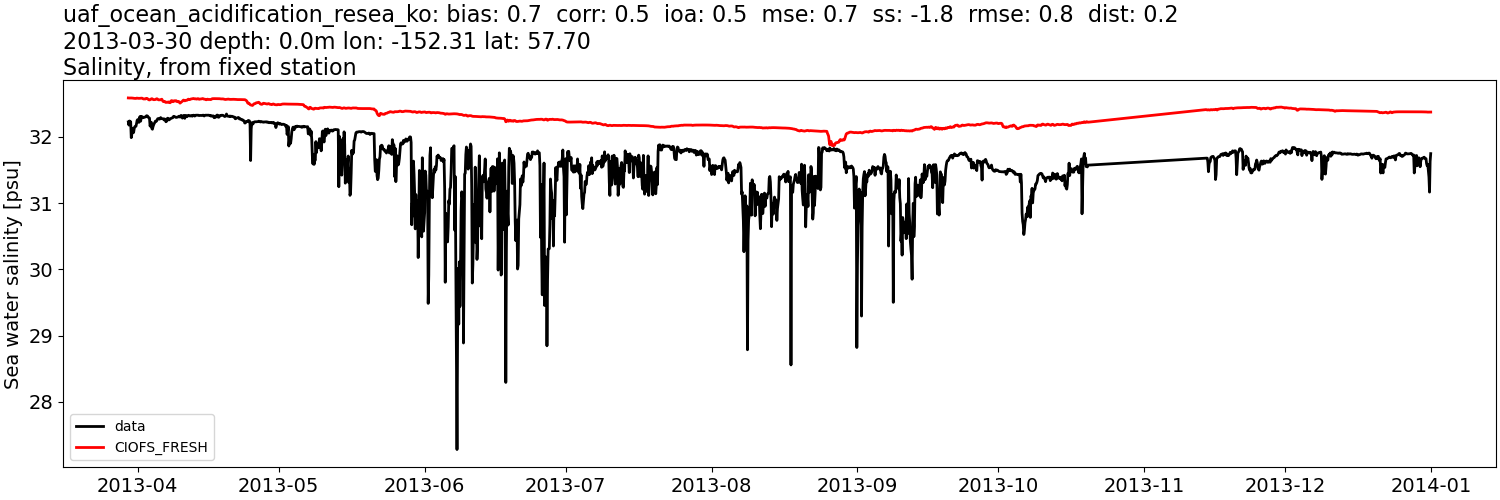
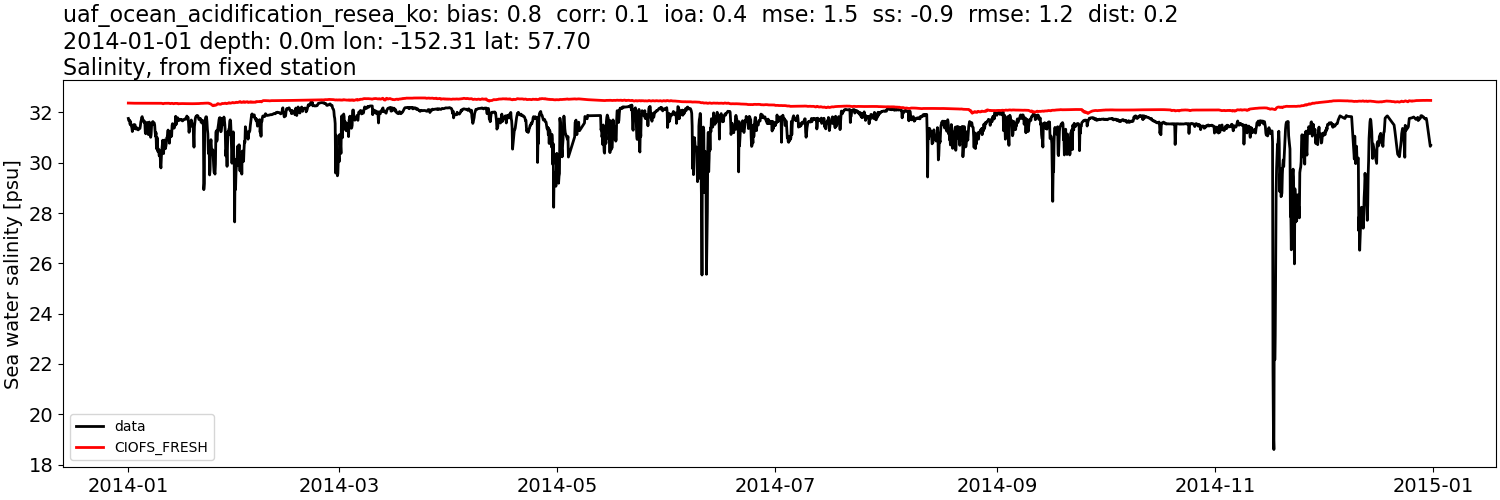
Sea water salinity:#
CIOFS_HINDCAST#
Comparison plots by year
2013
2014
CIOFS_FRESH#
Comparison plots by year
2013
2014
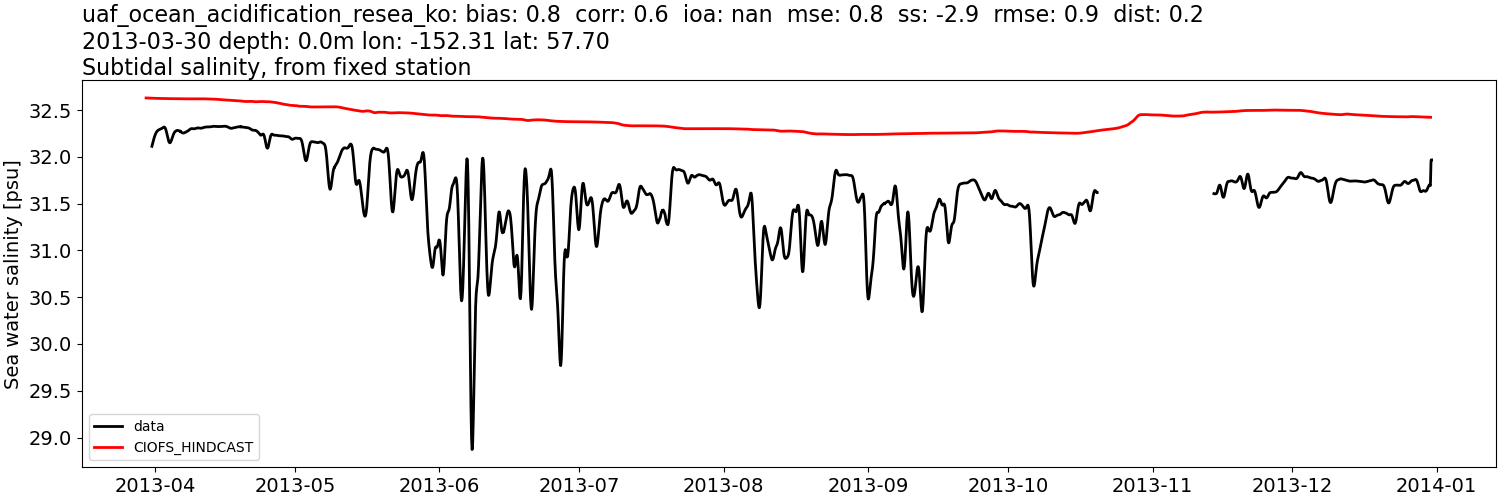
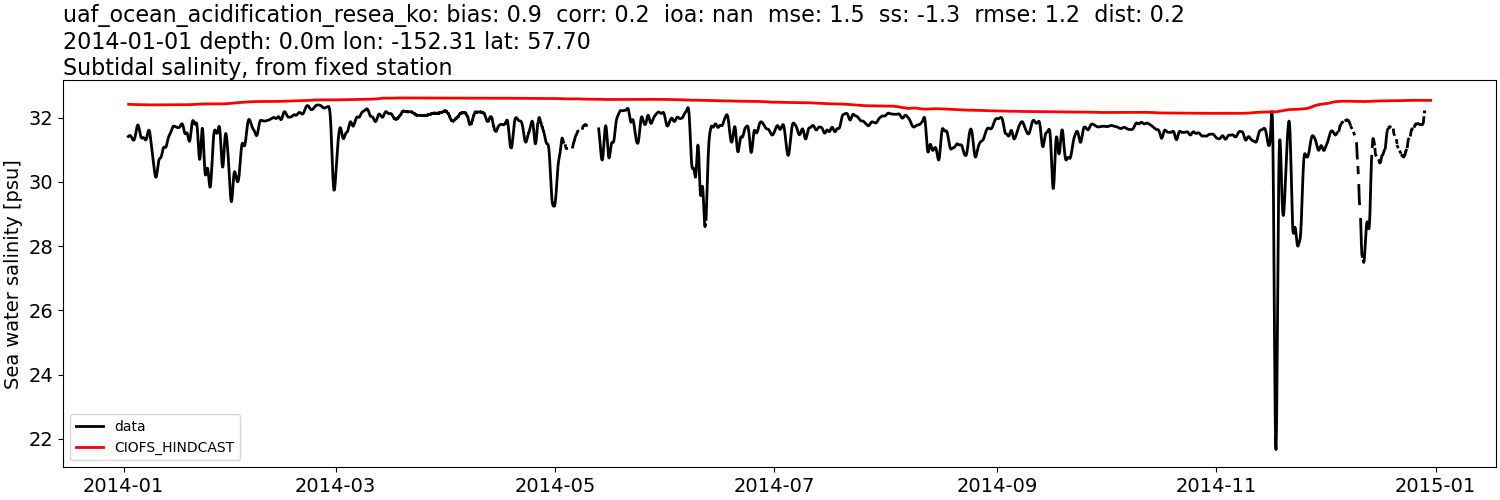
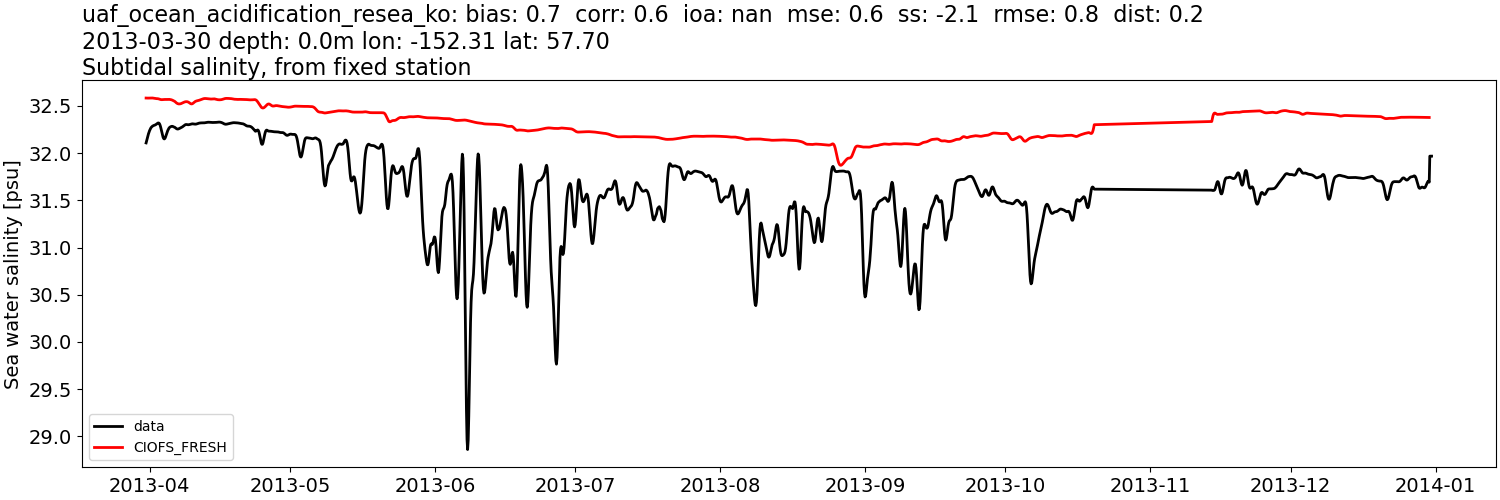
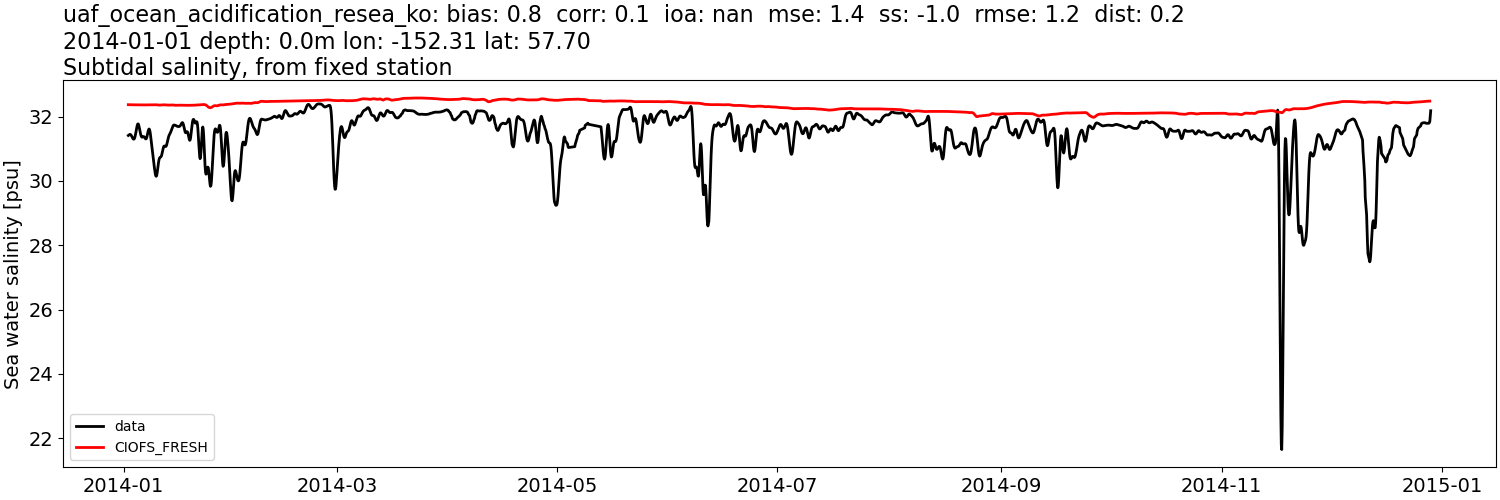
Sea water salinity: tidally-filtered#
CIOFS_HINDCAST#
Comparison plots by year
2013
2014
CIOFS_FRESH#
Comparison plots by year
2013
2014
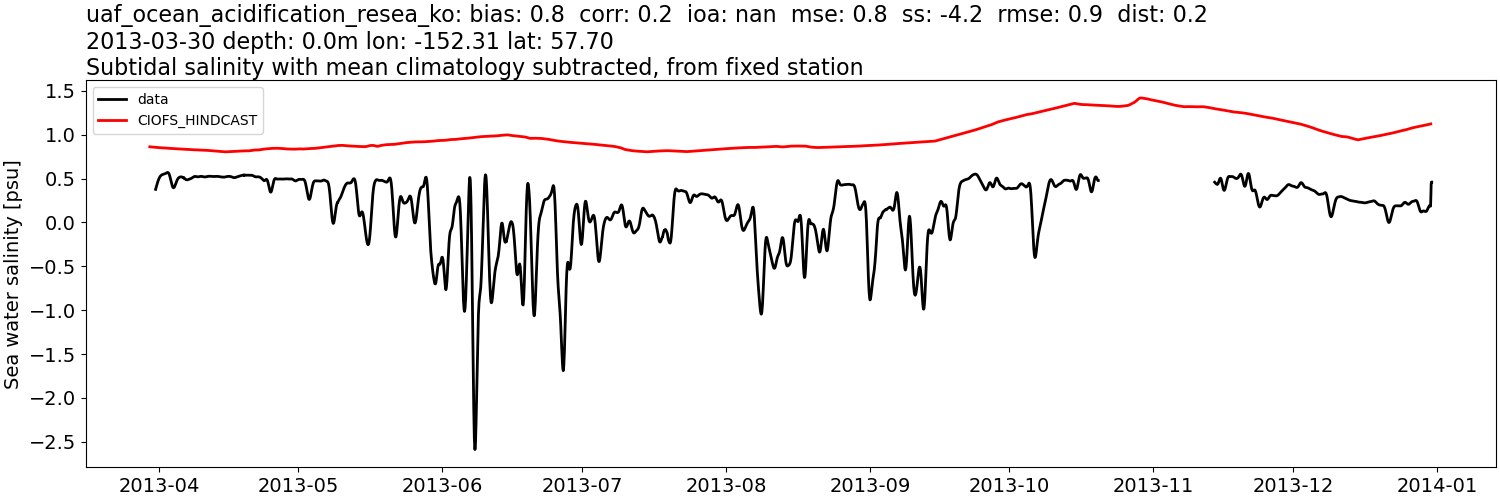
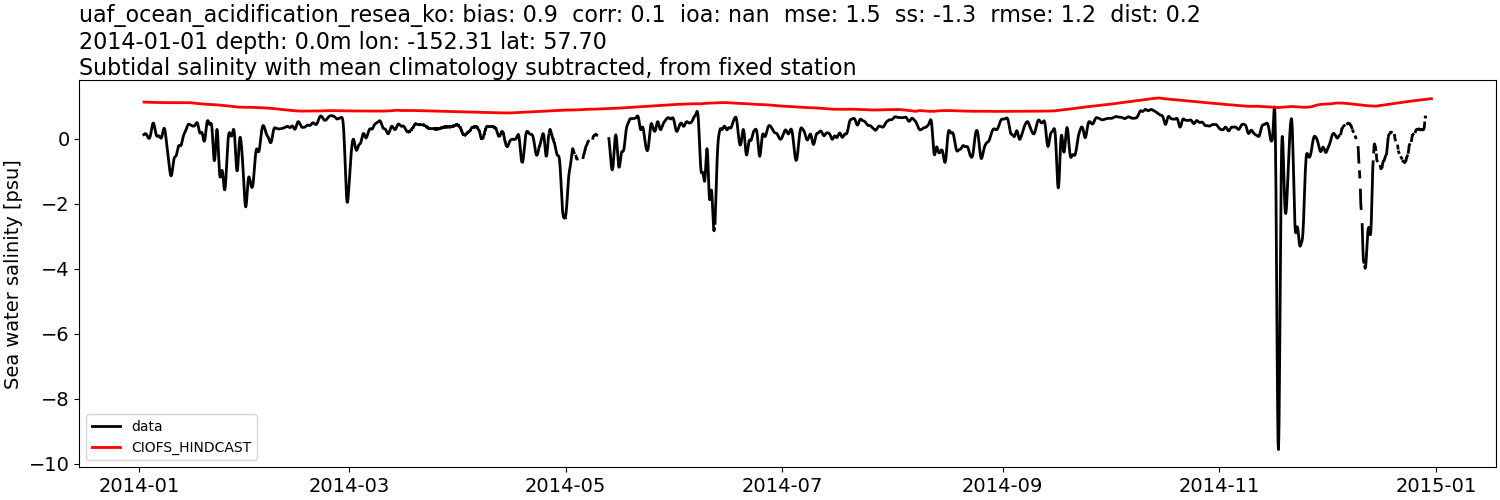
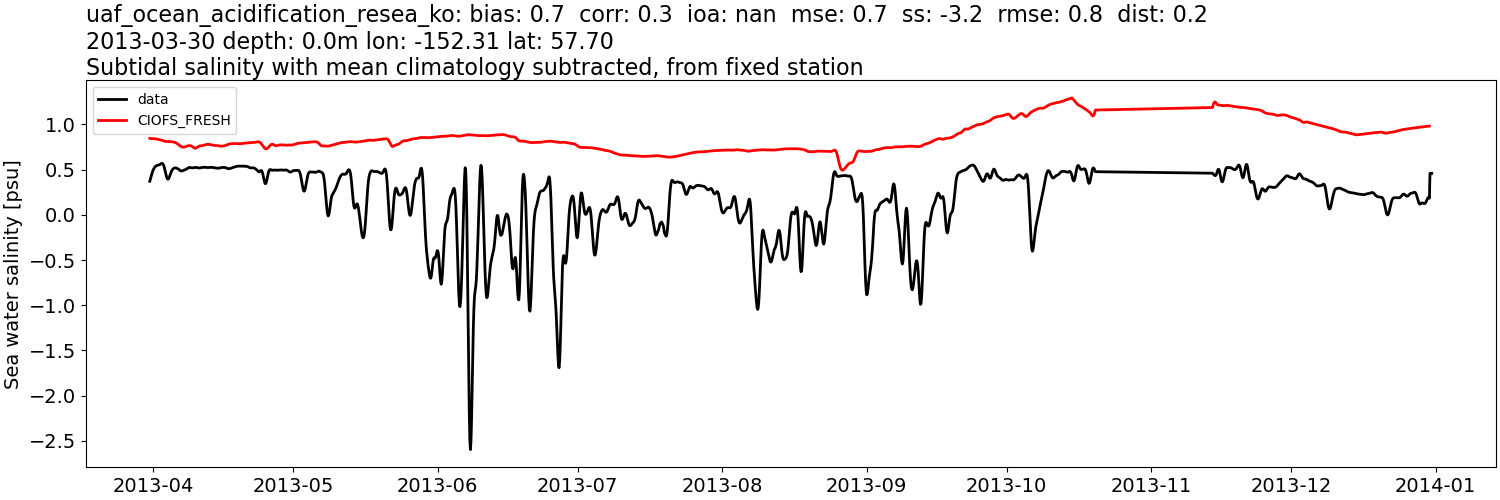
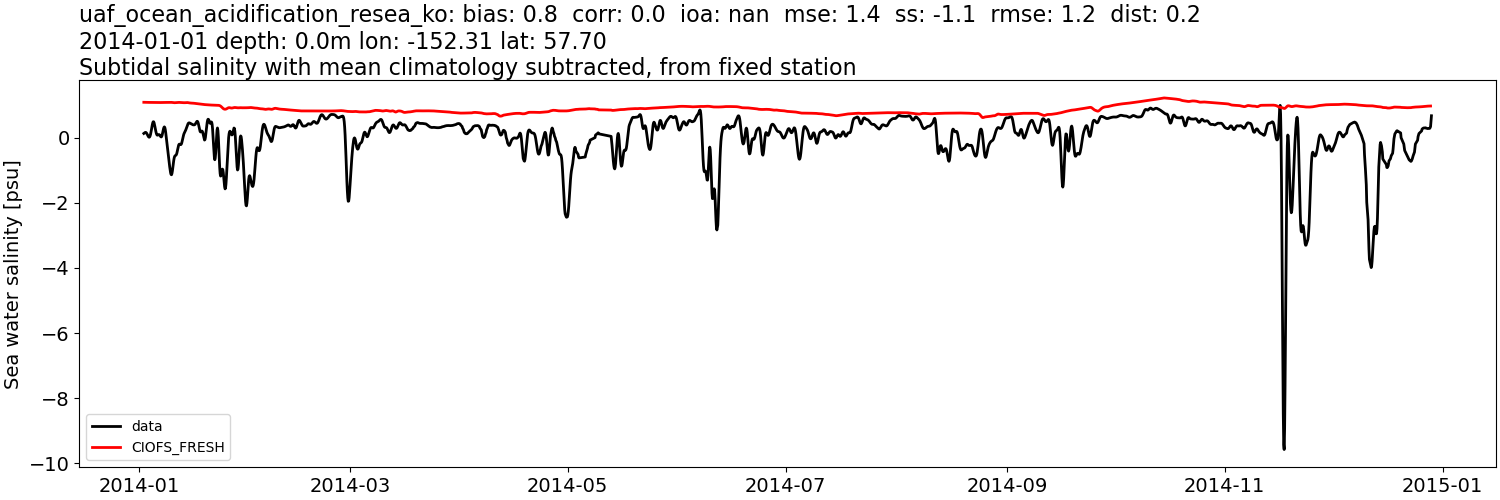
Sea water salinity: tidally-filtered, then monthly mean from data subtracted#
CIOFS_HINDCAST#
Comparison plots by year
2013
2014
CIOFS_FRESH#
Comparison plots by year
2013
2014
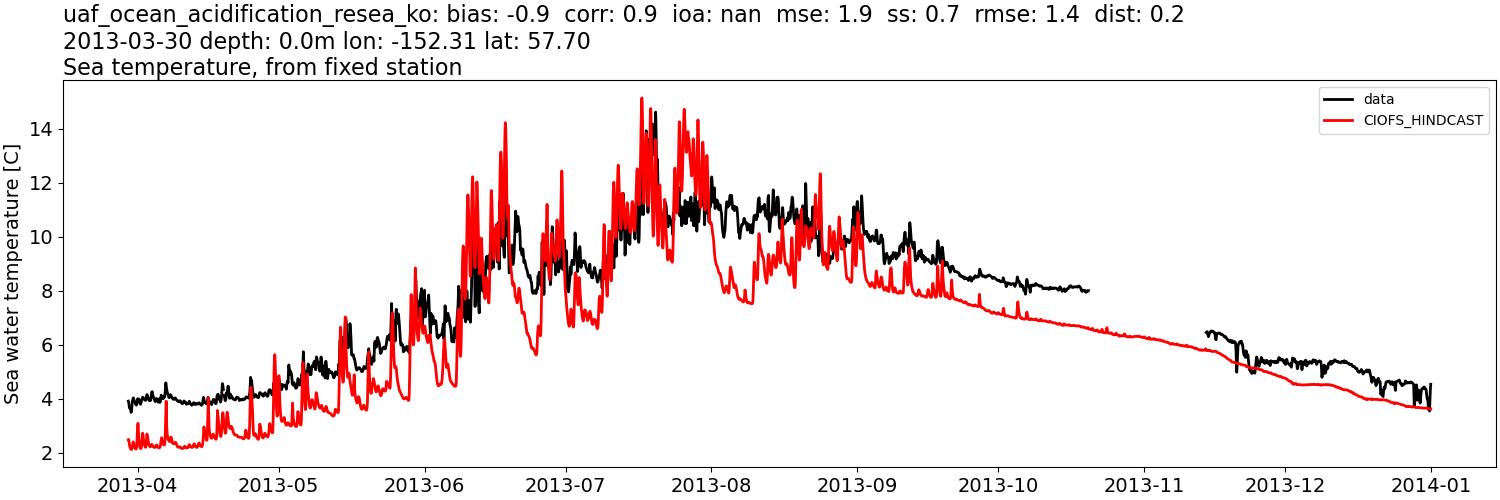
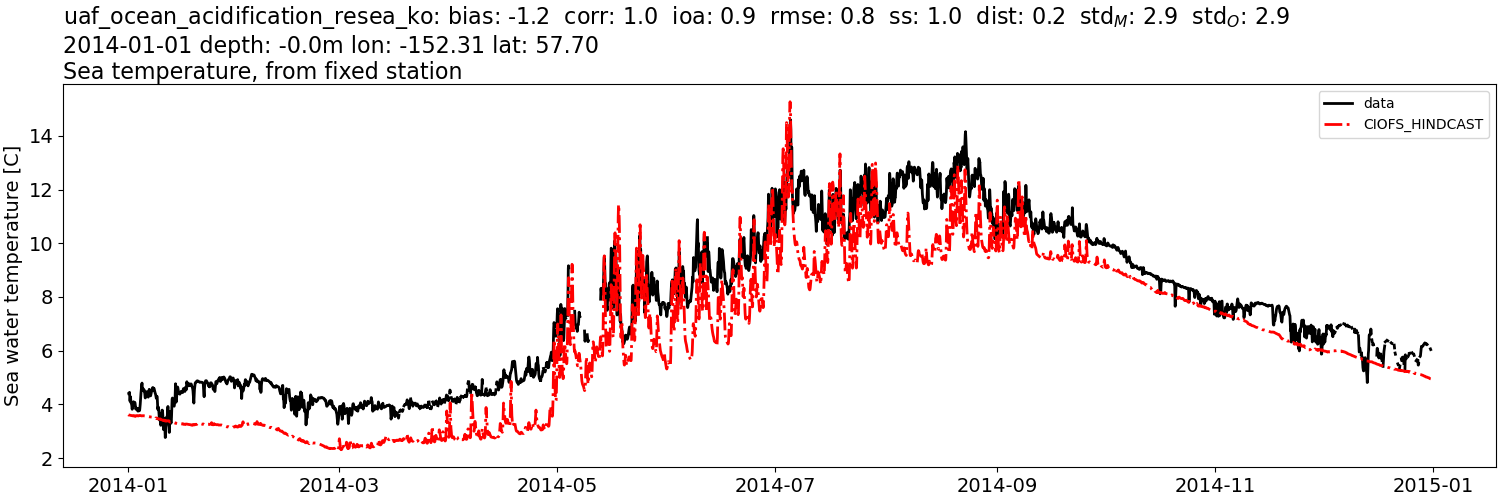
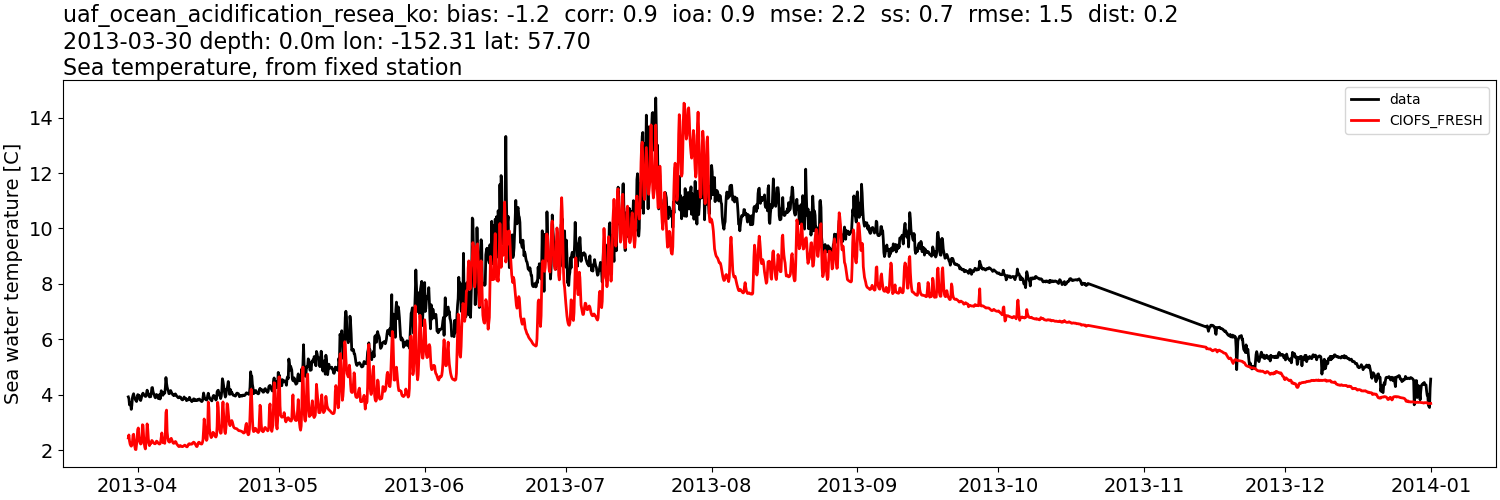
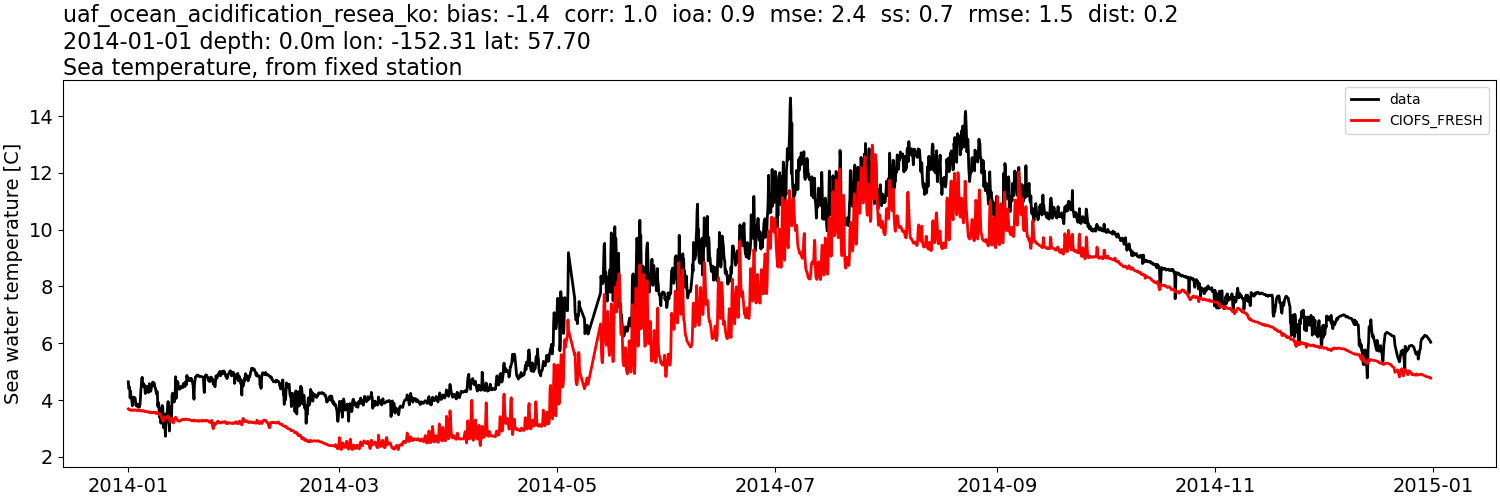
Sea water temperature:#
CIOFS_HINDCAST#
Comparison plots by year
2013
2014
CIOFS_FRESH#
Comparison plots by year
2013
2014
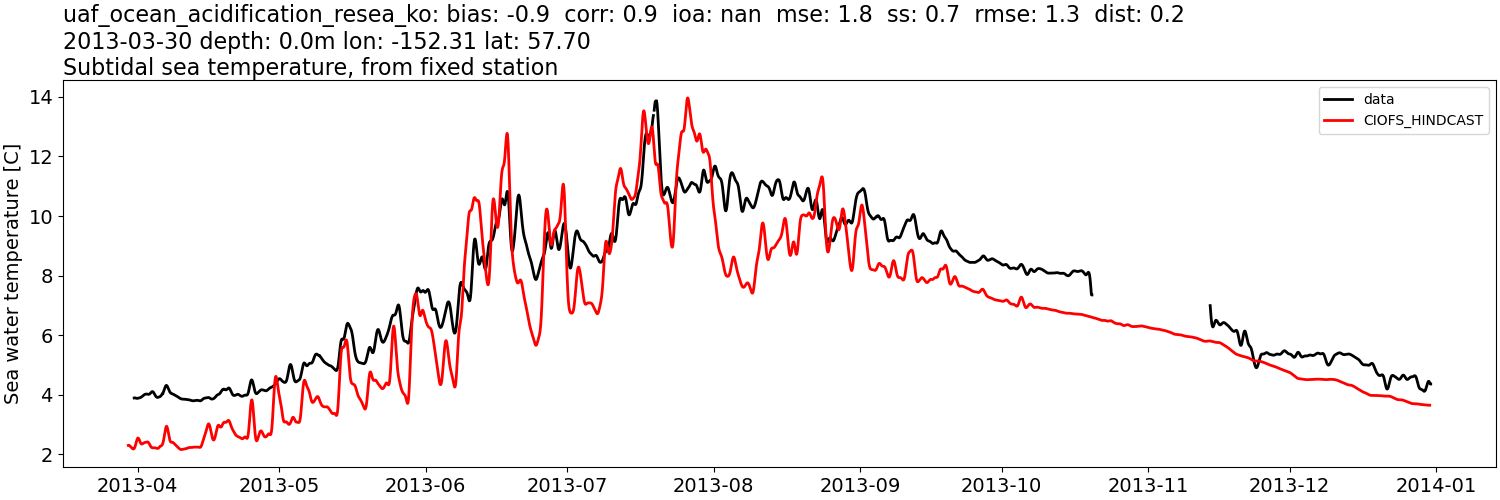
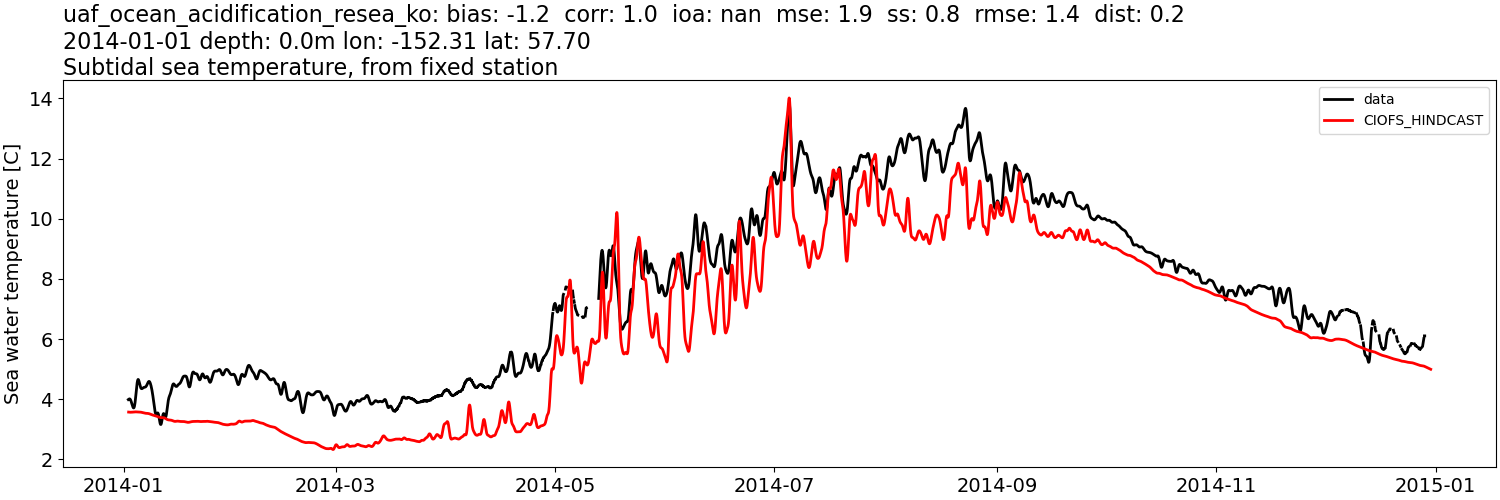
Sea water temperature: tidally-filtered#
CIOFS_HINDCAST#
Comparison plots by year
2013
2014
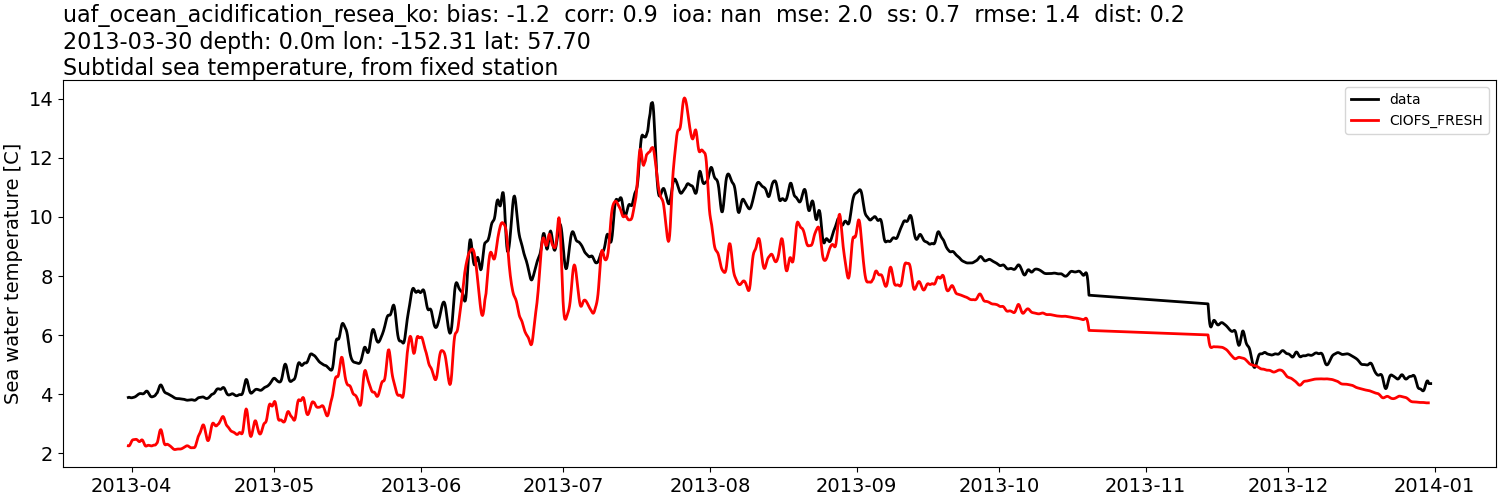
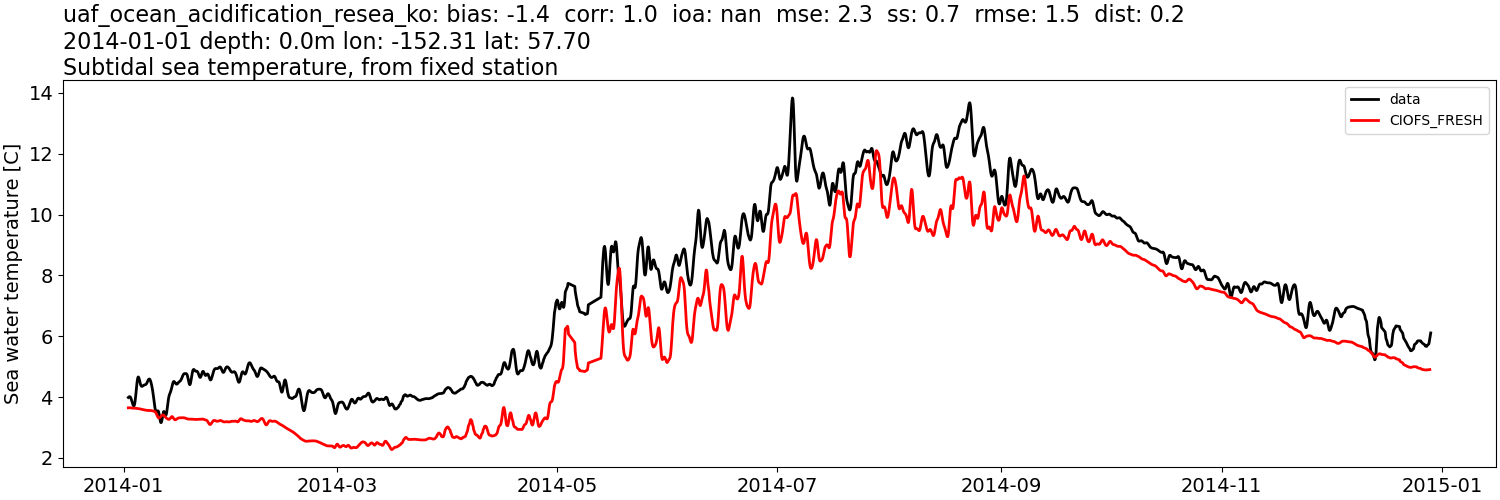
CIOFS_FRESH#
Comparison plots by year
2013
2014
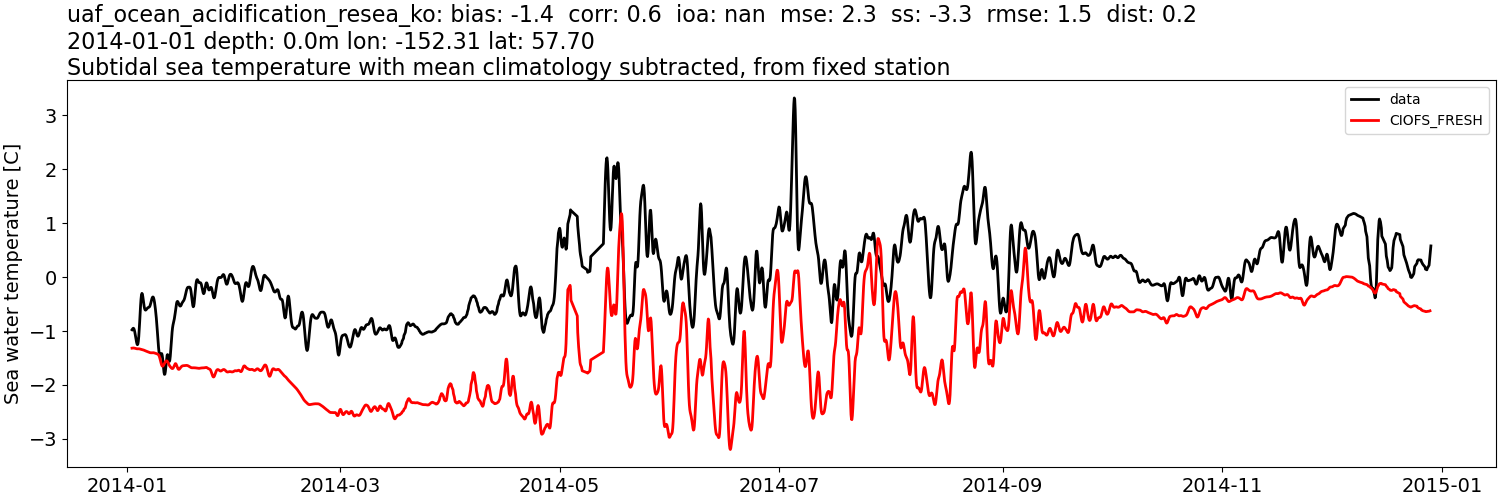
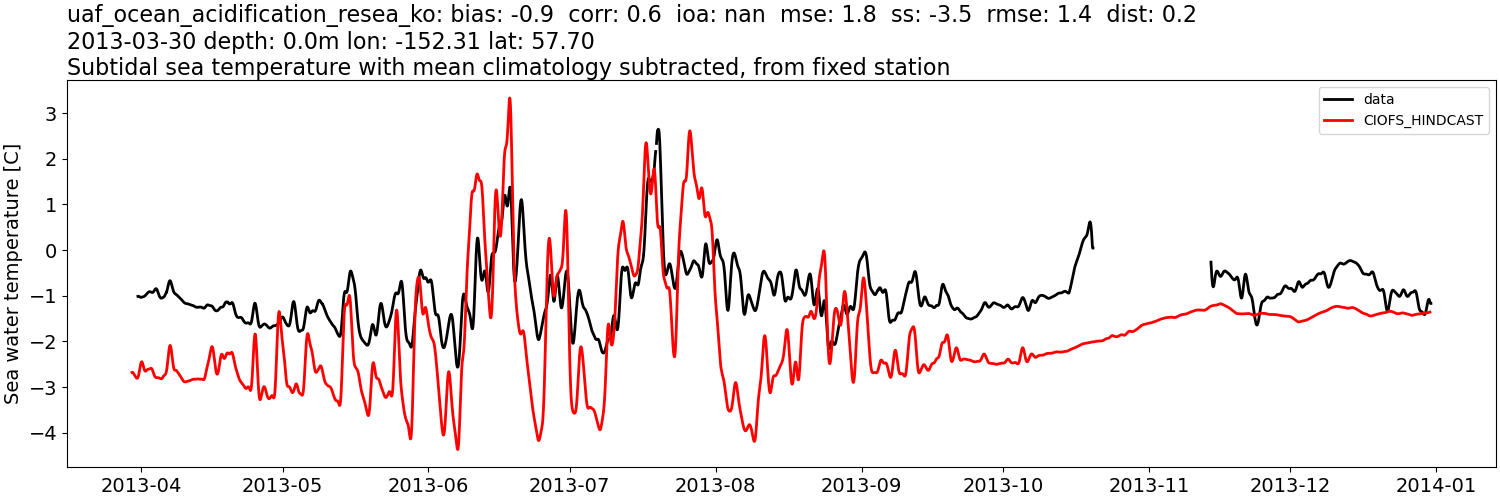
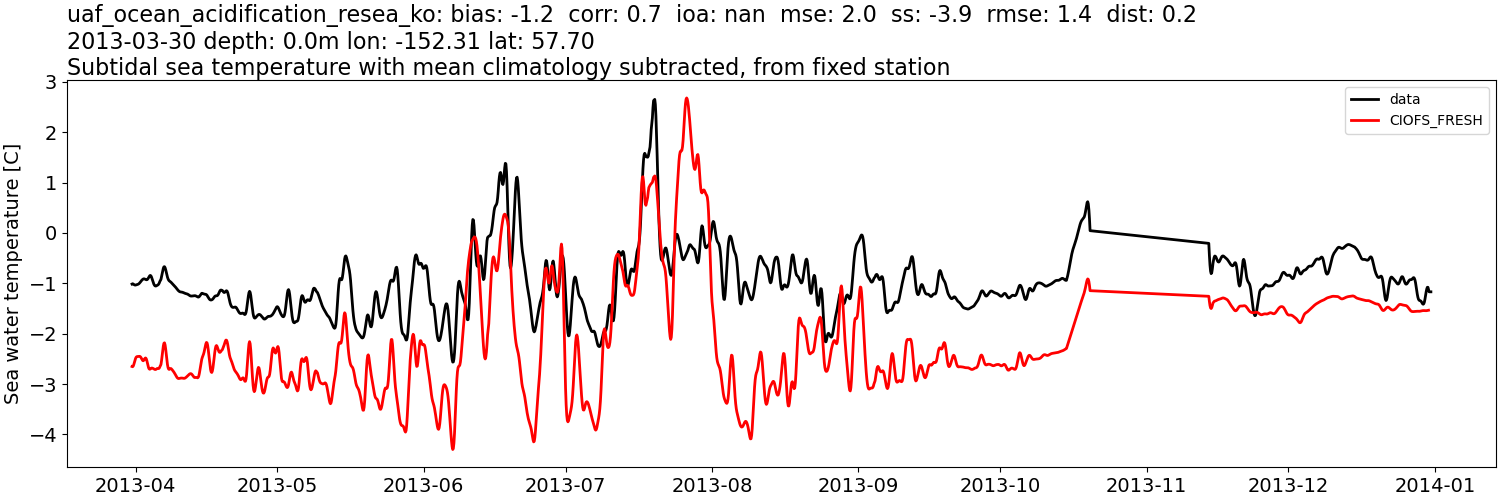
Sea water temperature: tidally-filtered, then monthly mean from data subtracted#
CIOFS_HINDCAST#
Comparison plots by year
2013
2014

CIOFS_FRESH#
Comparison plots by year
2013
2014