Overview HF Radar Data#
Detailed model-data comparison page: HF Radar model-data comparison page
See the original full dataset description page in the original report for more information or the new catalog page.
Note that the map shows all datasets from the catalog; it is not limited to the current report time periods.
Taylor Diagrams#
Taylor diagrams summarize the skill of the two models in capturing the HF Radar datasets. The data has been grouped by region (Figs. 90 and 91). Correlations are higher for the northward tidal component of velocity, which is most along-channel oriented for the HF Radar areas, than for the eastward component, and CIOFS Hindcast and Fresh perform similarly. The subtidal components are poorly captured by both models: low correlations for the eastward component and even lower and negative (not shown on plot) for the northward component. Skill scores are shown in the next plots for each dataset.
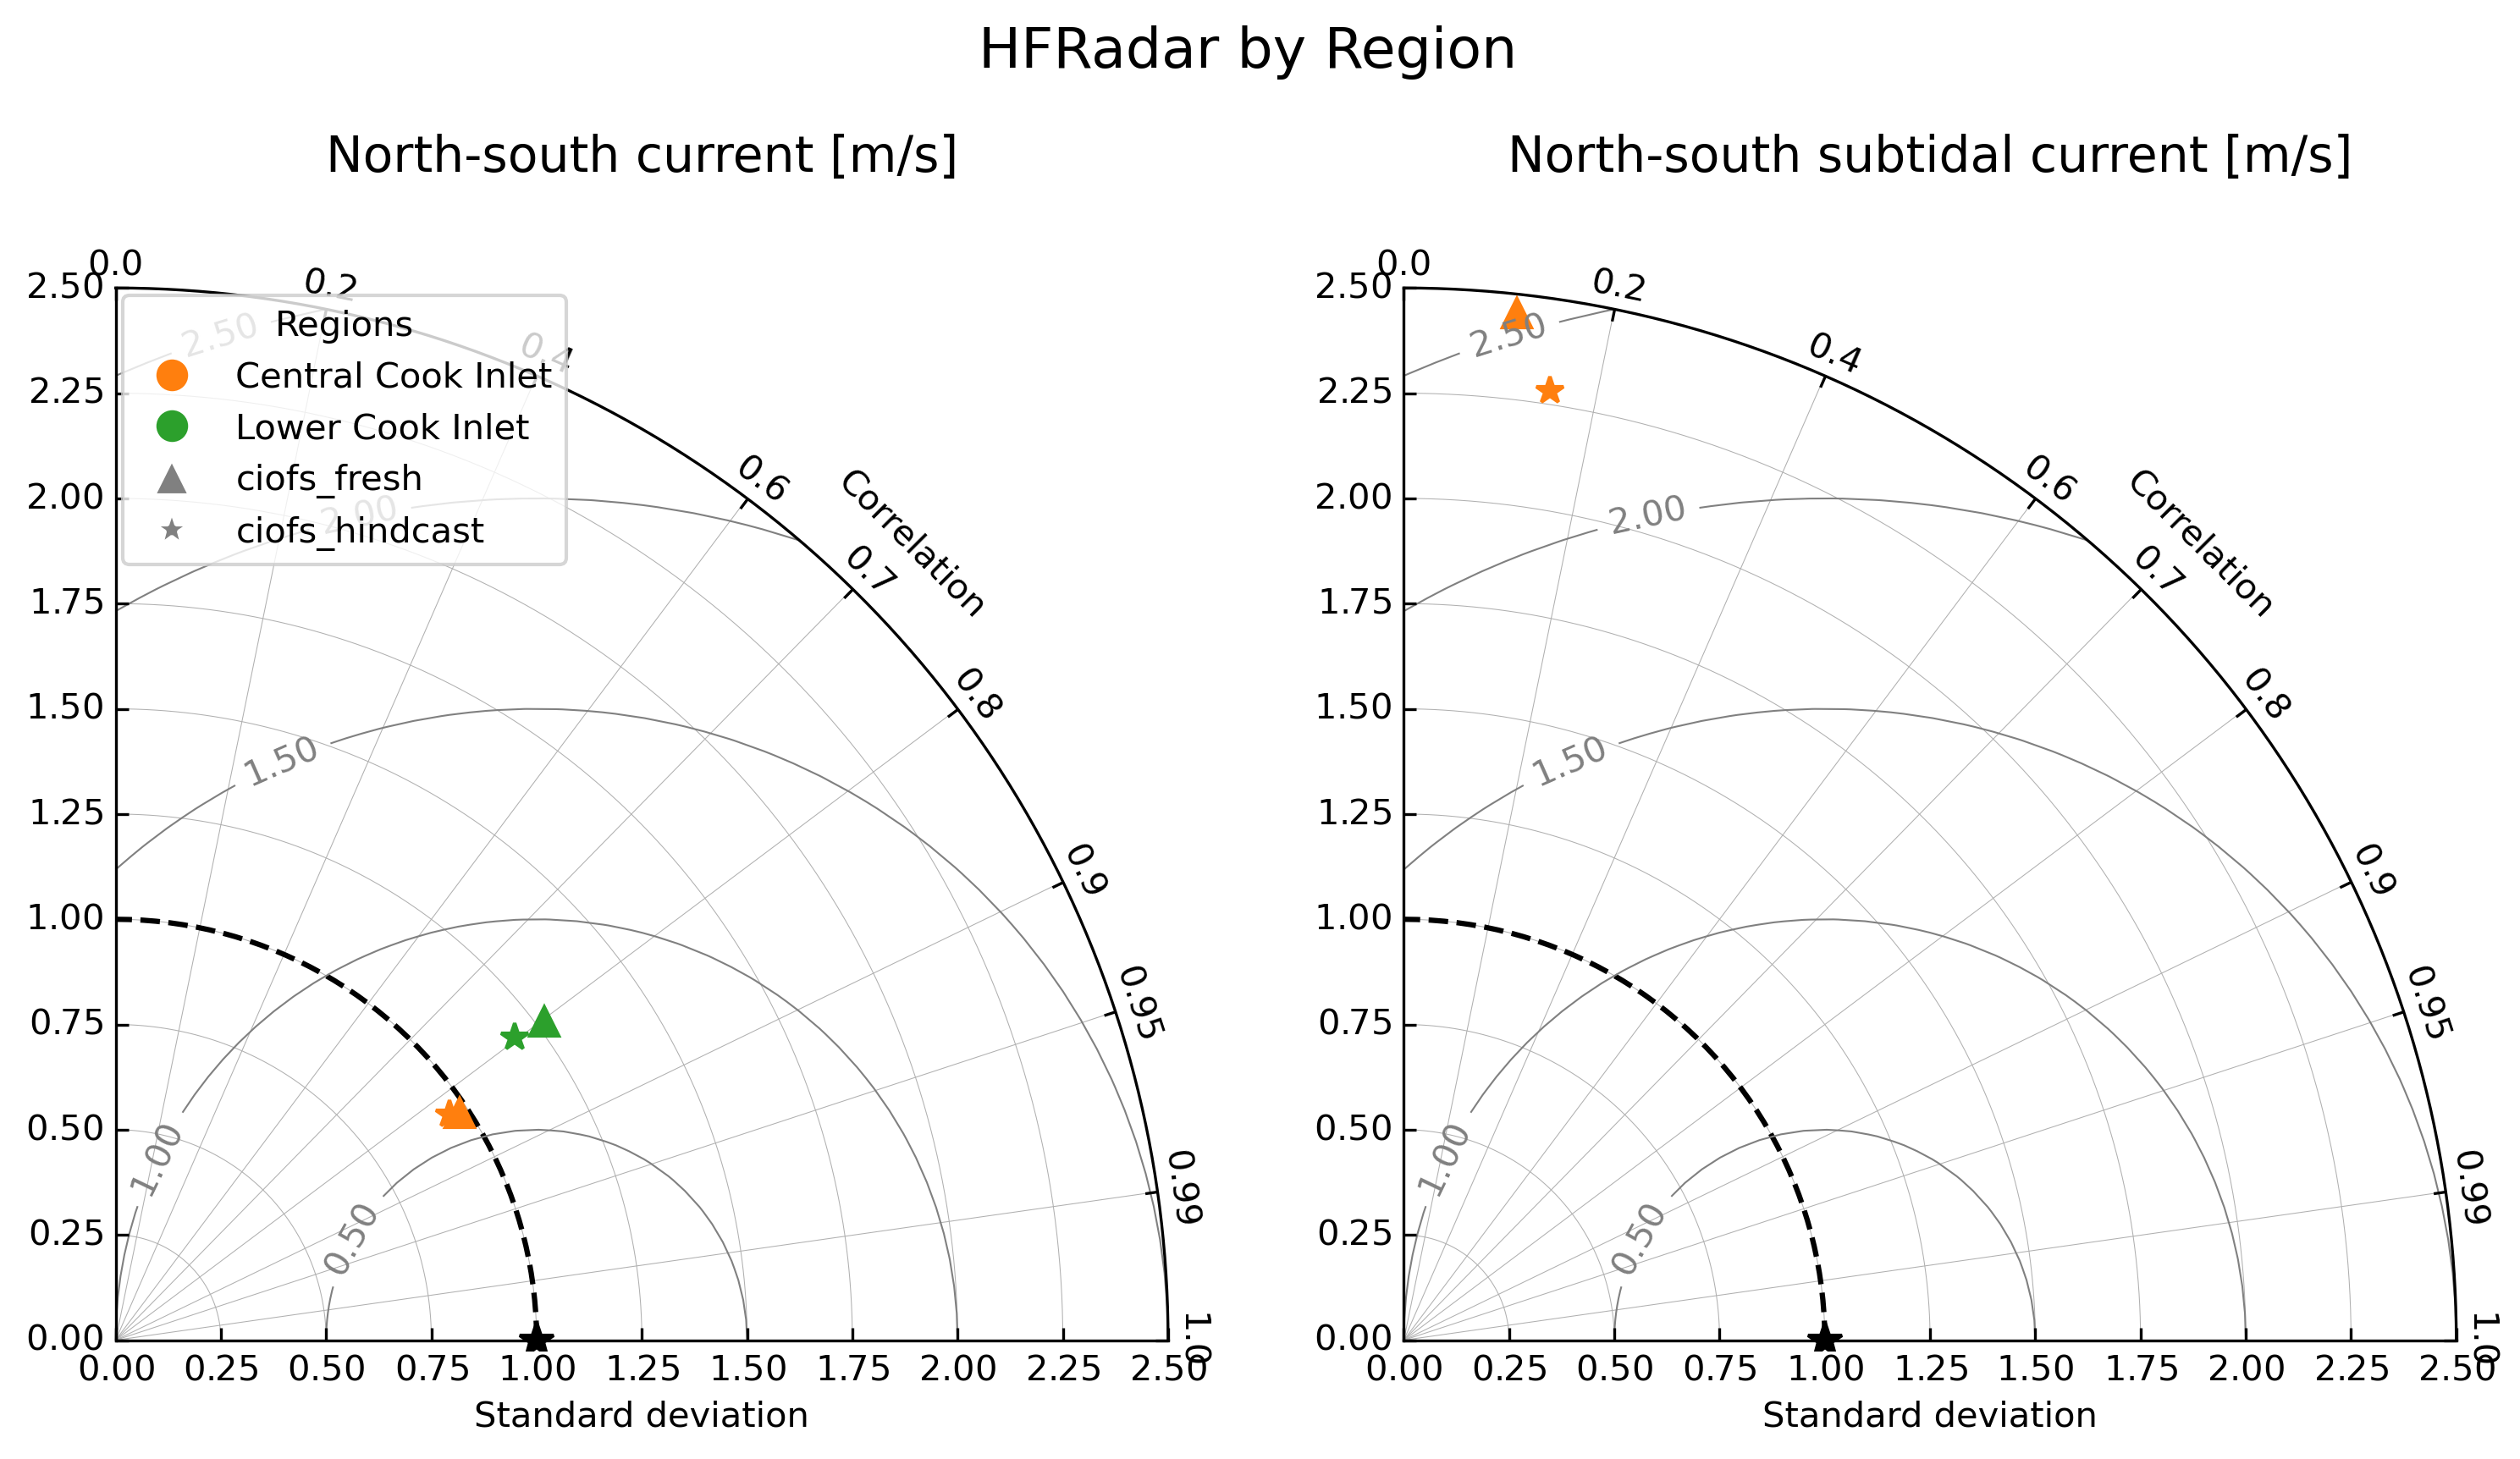
Fig. 90 Taylor Diagram summarizing skill of CIOFS Hindcast (stars) and CIOFS Fresh (triangles) for north-south velocity component for the full tidal signal (left) and subtidal signal (right), grouped by region of Cook Inlet, for HF Radar data.#
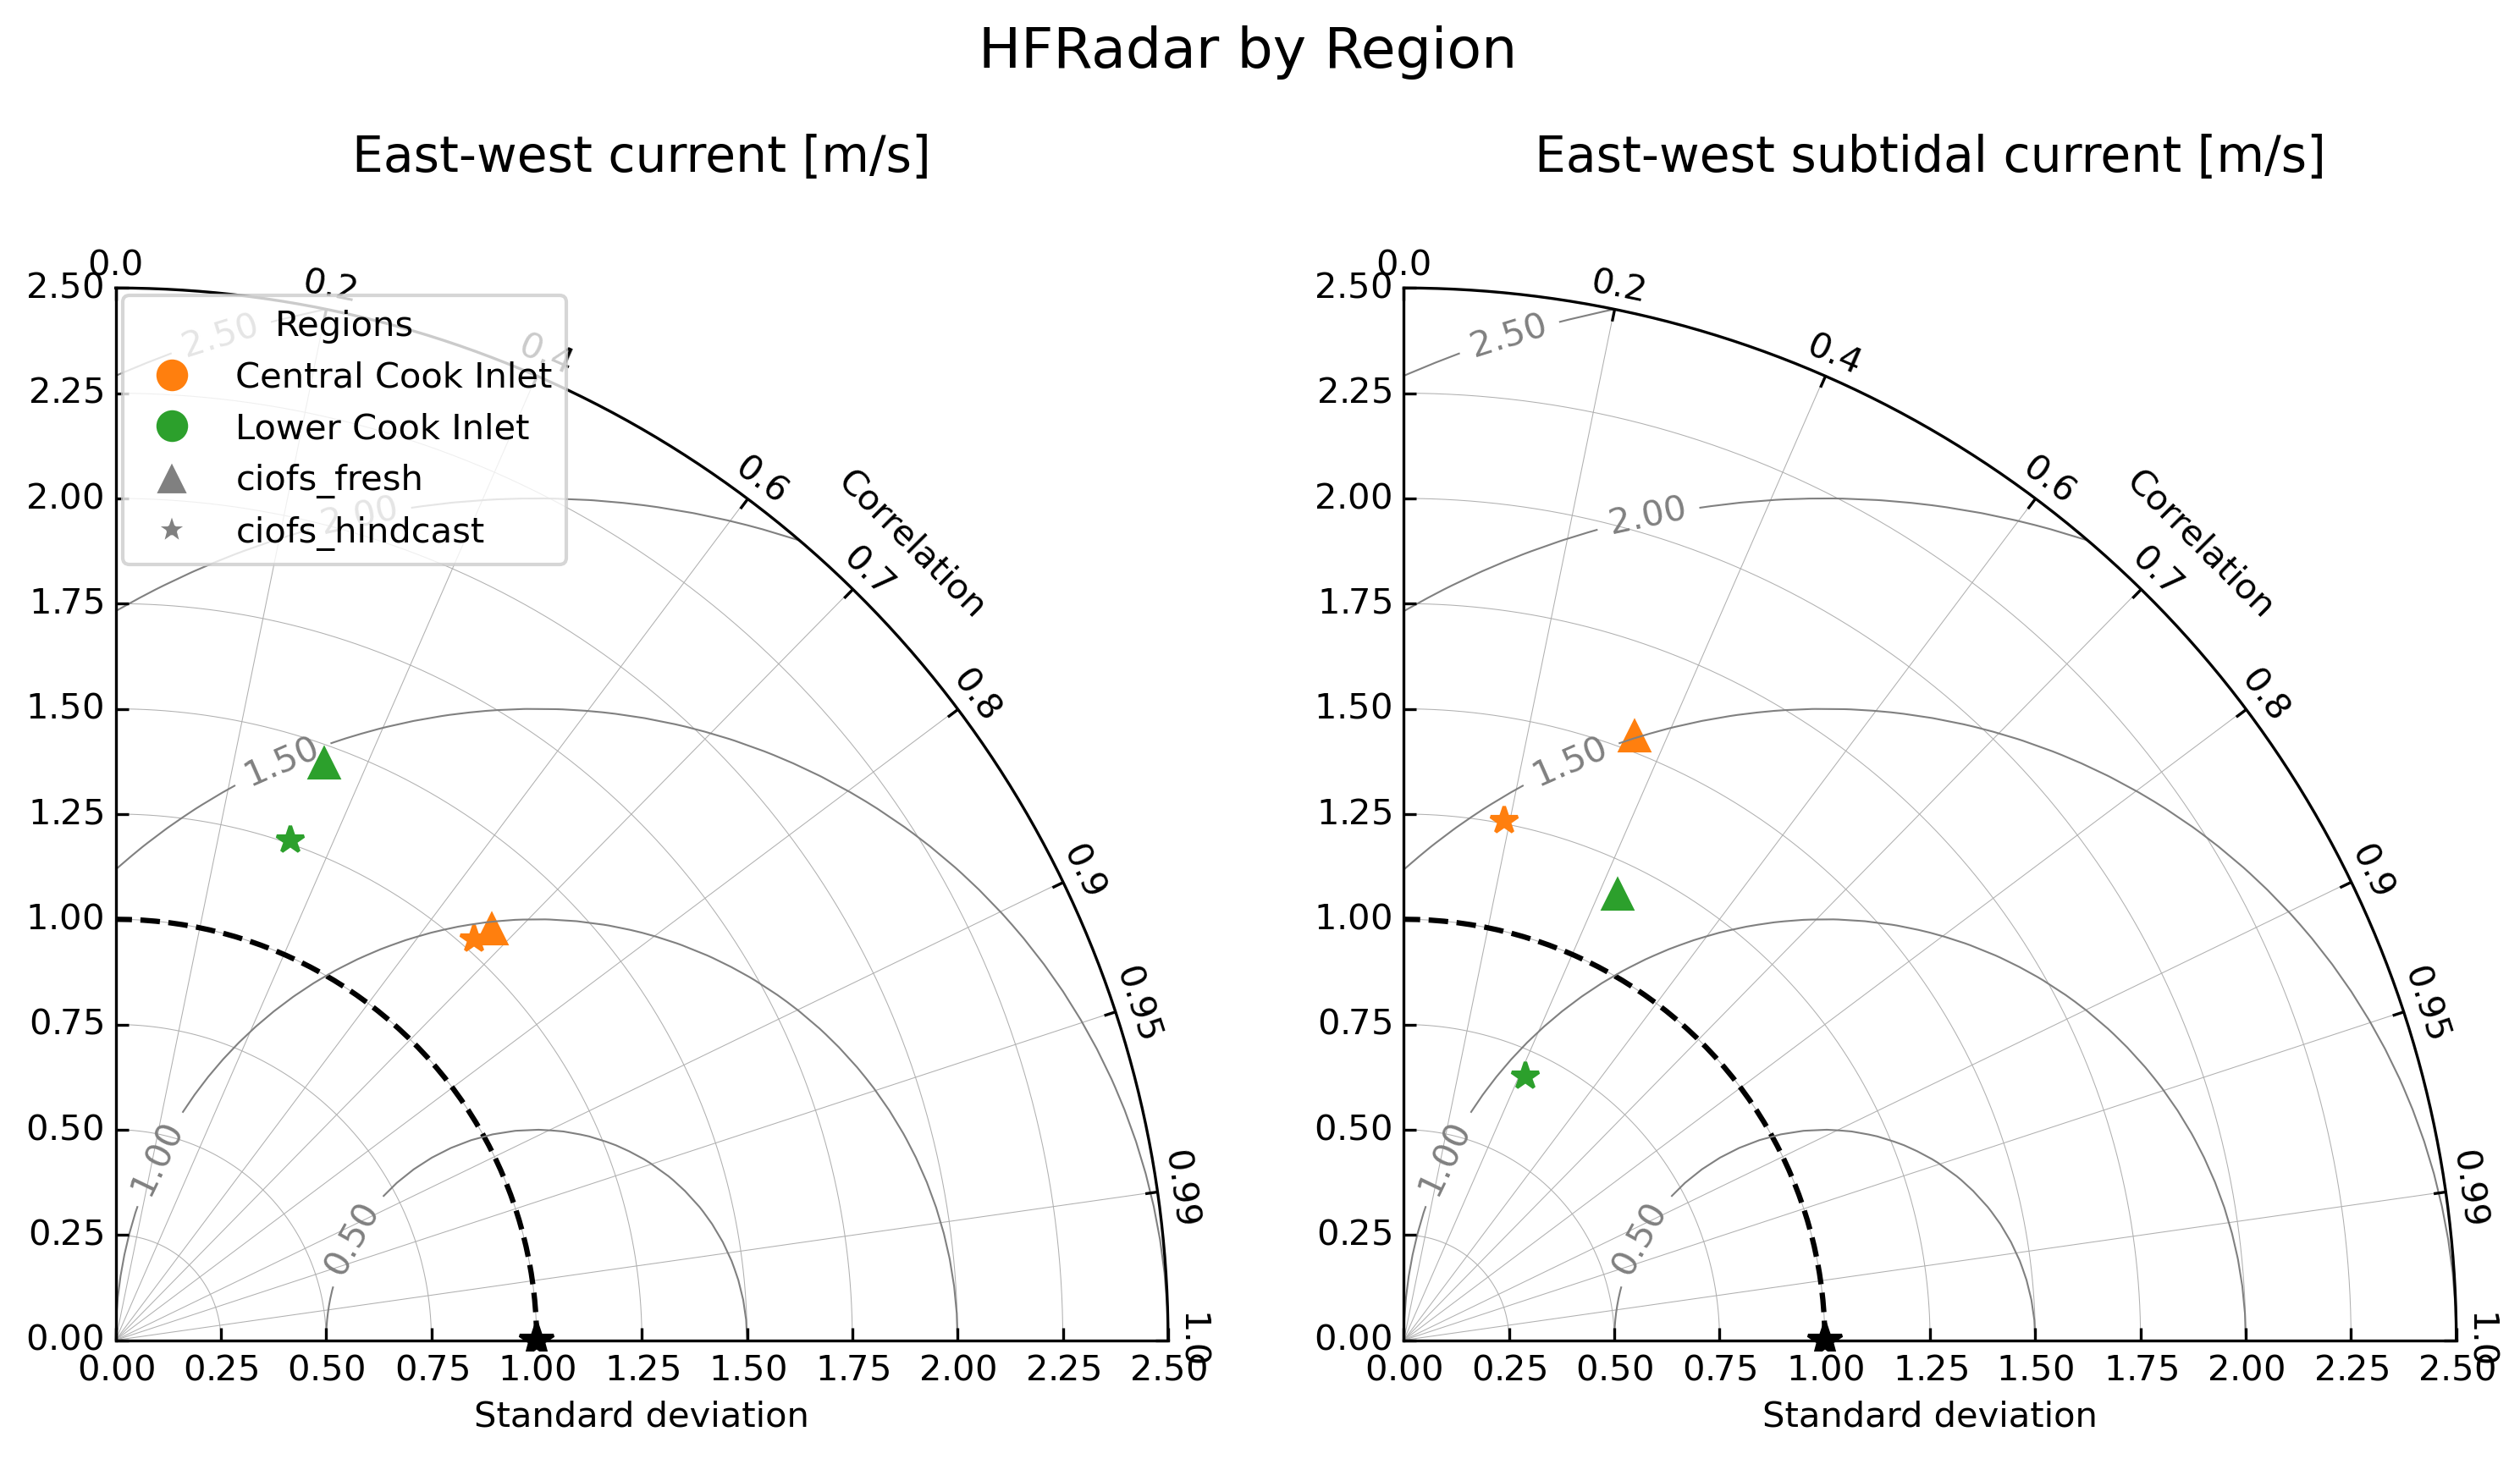
Fig. 91 Taylor Diagram summarizing skill of CIOFS Hindcast (stars) and CIOFS Fresh (triangles) for east-west velocity component for the full tidal signal (left) and subtidal signal (right), grouped by region of Cook Inlet, for HF Radar data.#
CIOFS_HINDCAST#
lower-ci_system-B_2006#
Tidal#
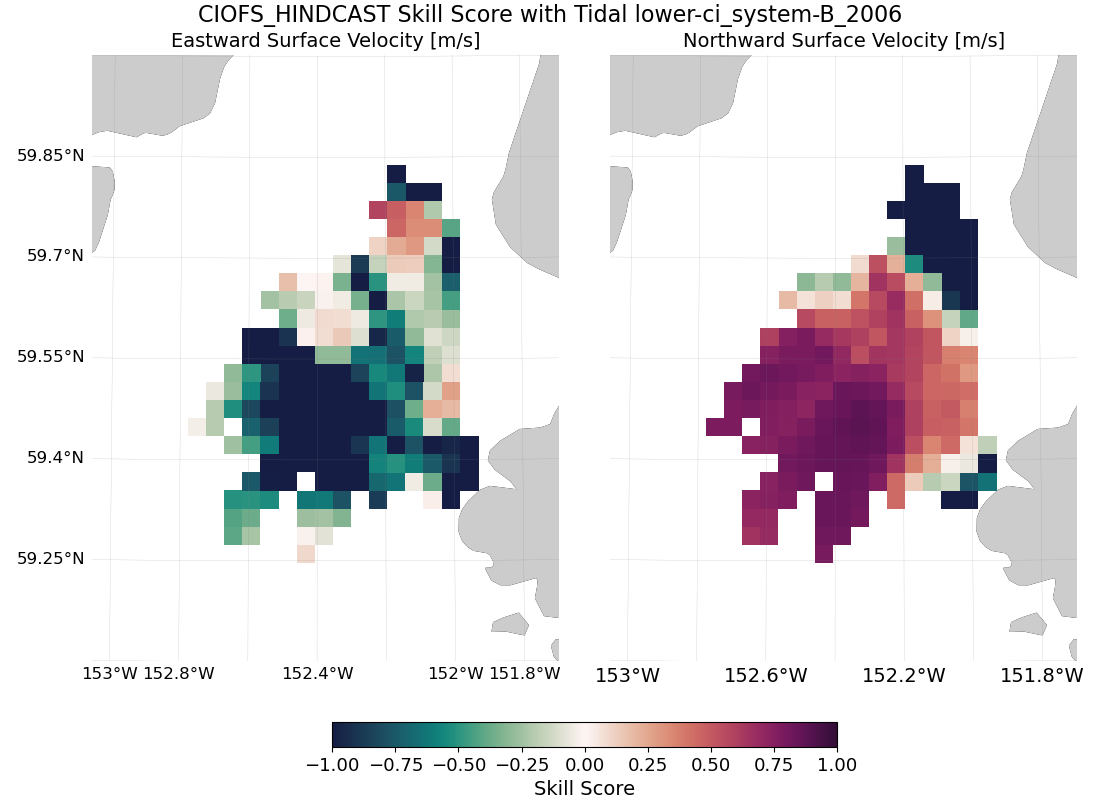
Fig. 92 Tidal surface currents skill score for CIOFS_HINDCAST and dataset lower-ci_system-B_2006#
Subtidal#
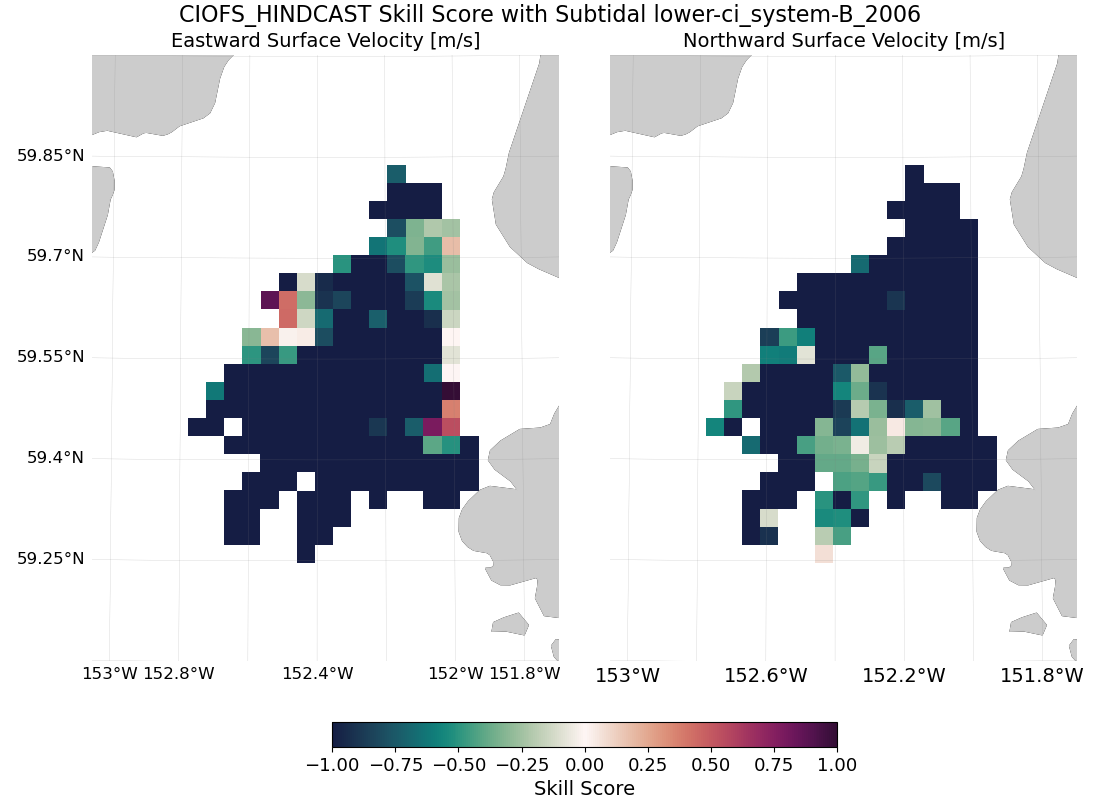
Fig. 93 Subtidal surface currents skill score for CIOFS_HINDCAST and dataset lower-ci_system-B_2006#
upper-ci_system-A_2003#
Tidal#
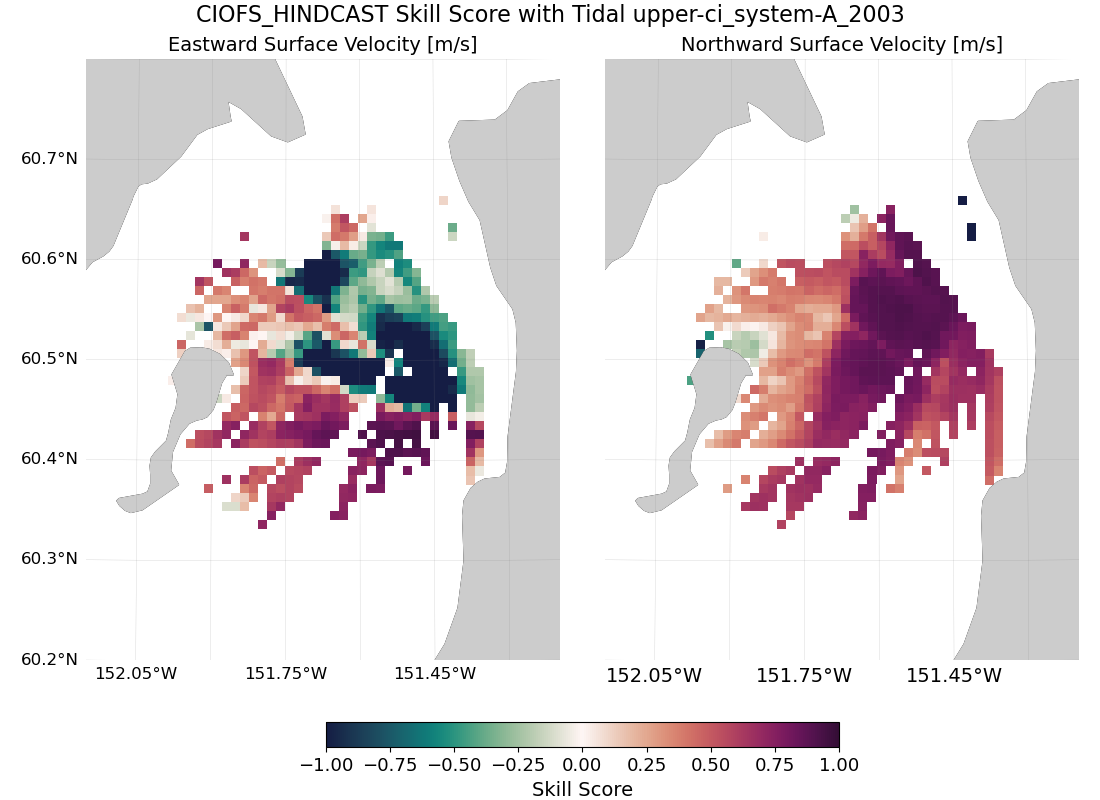
Fig. 94 Tidal surface currents skill score for CIOFS_HINDCAST and dataset upper-ci_system-A_2003#
Subtidal#
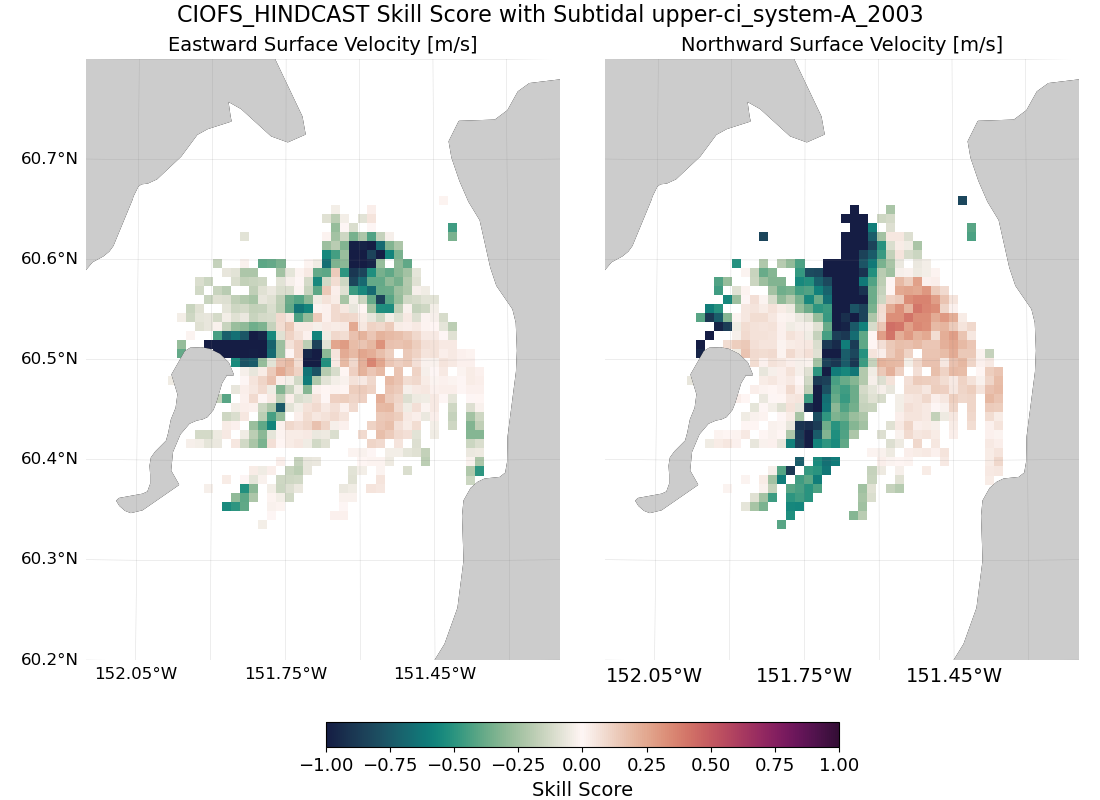
Fig. 95 Subtidal surface currents skill score for CIOFS_HINDCAST and dataset upper-ci_system-A_2003#
CIOFS_FRESH#
lower-ci_system-B_2006#
Tidal#
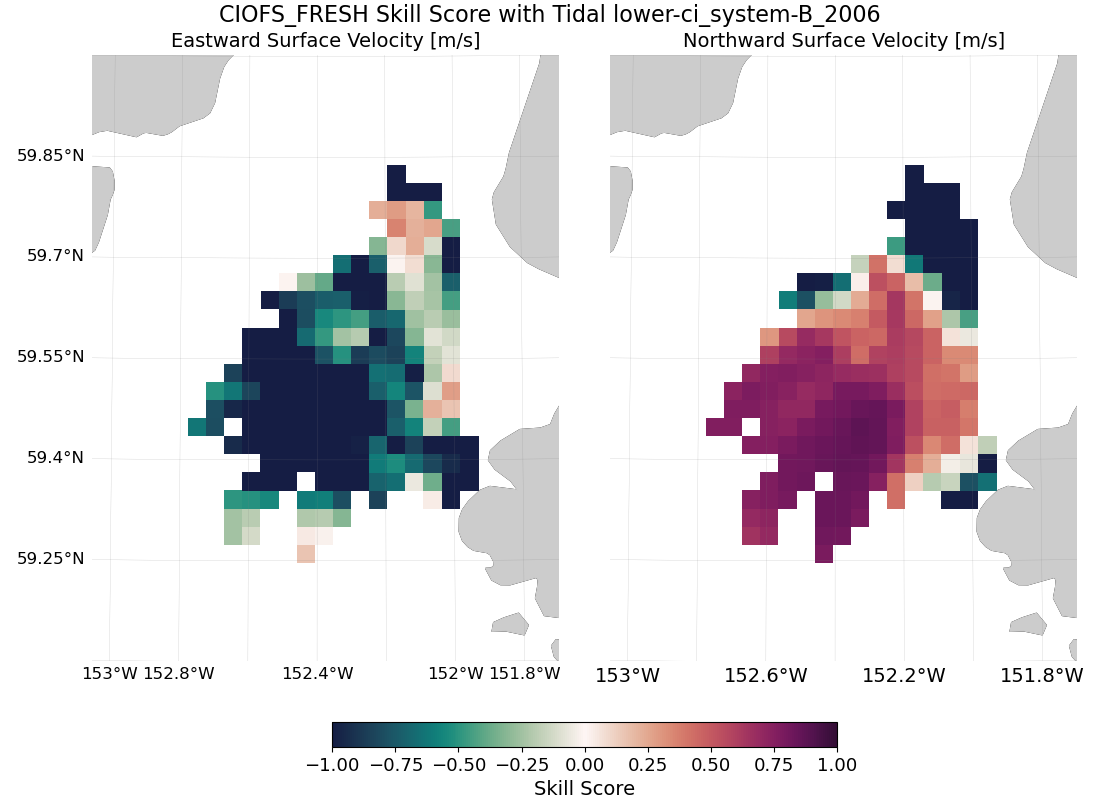
Fig. 96 Tidal surface currents skill score for CIOFS_FRESH and dataset lower-ci_system-B_2006#
Subtidal#
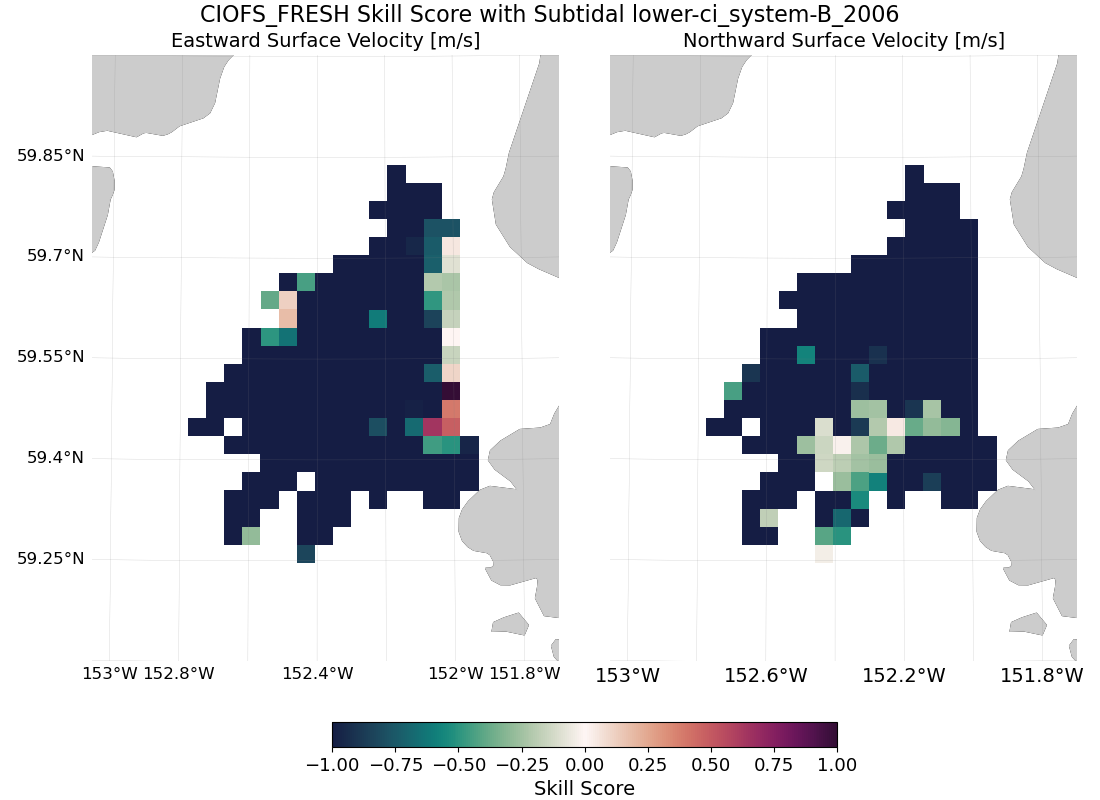
Fig. 97 Subtidal surface currents skill score for CIOFS_FRESH and dataset lower-ci_system-B_2006#
upper-ci_system-A_2003#
Tidal#

Fig. 98 Tidal surface currents skill score for CIOFS_FRESH and dataset upper-ci_system-A_2003#
Subtidal#
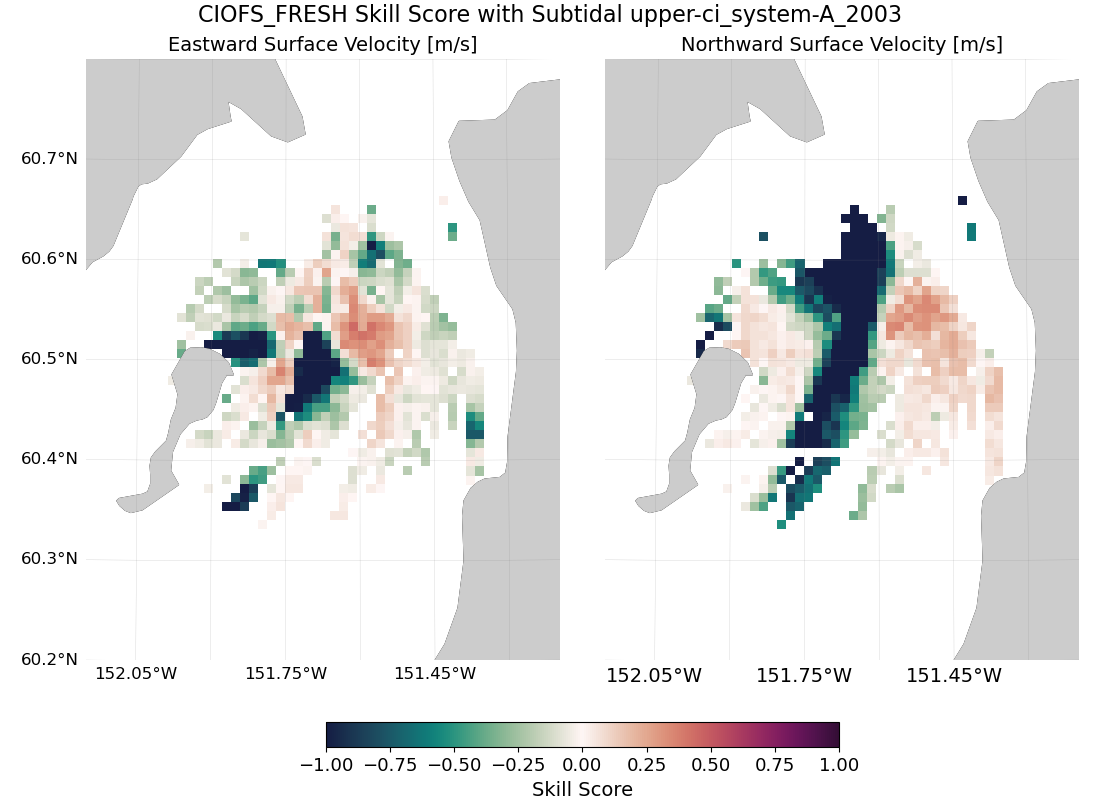
Fig. 99 Subtidal surface currents skill score for CIOFS_FRESH and dataset upper-ci_system-A_2003#