Overview Mooring Data#
In the map below, some stations are at the same or nearly same location, in which case the marker representing their location is shifted slightly to allow for both to be seen. Datasets that span more than 1 year are represented by the number of years they span: one marker per year. By necessity these markers are moved in space from the actual station location and arranged into a grid so they can all be seen. Therefore, their locations in the skill score plots do not represent their actual locations.
The skill scores below represent the skill of each model by variable and processing listed. The models perform similarly for sea surface height: they capture the tidal signal well and the subtidal signal less well, though some improvement is noticeable for CIOFS fresh as compared with CIOFS hindcast for the subtidal sea surface height. The models perform similarly for temperature; they capture the tidal and subtidal seasonal cycles and do moderately well on the subtiddal temperature with the monthly anomaly subtracted. For salinity, CIOFS fresh shows moderate improvement over CIOFS hindcast.
91MB zipfile of plots and stats files
Map of Stations#
Fig. 53 All mooring stations, by project. Click on a legend entry to toggle the transparency. (HTML plot, won’t show up correctly in PDF.)#
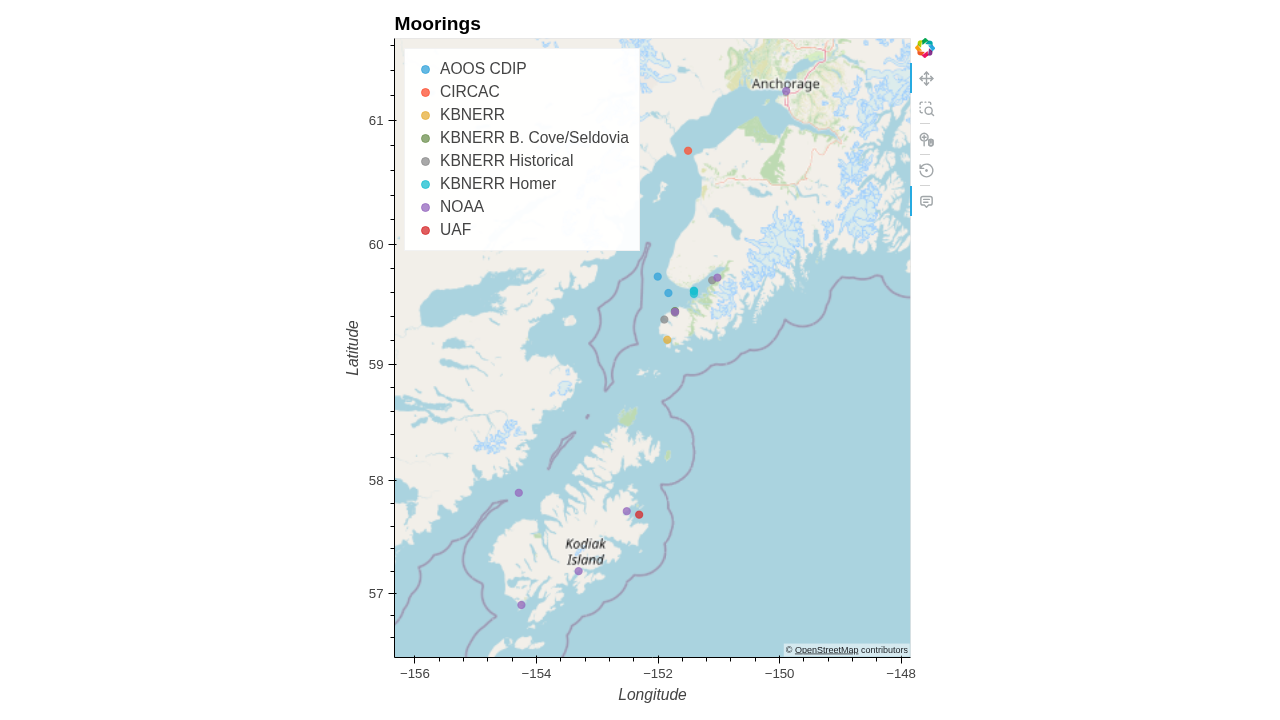
Fig. 54 All mooring stations, by project. (PNG screenshot, available for PDF and for saving image.)#
Taylor Diagrams#
Taylor diagrams summarize the skill of the two models in capturing the moorings datasets. The data has been grouped by region (Figs. 55, 56, and 57). Sea surface height (Fig. 55) is captured well by the models outside of Cook Inlet and in Upper Cook Inlet, but less well in Kachemak Bay. Both models have too low variance and correlation in capturing the subtidal sea surface height, but is better for CIOFS Fresh than Hindcast. Temperature (Fig. 56) is medium to well-captured in both models for the full and subtidal signals. For the subtidal anomaly, the models perform similarly to each other but none of the regions show good performance. Salinity time series (Fig. 57) are poorly captured across the board for both models. Skill scores are shown in the next plots for each dataset.
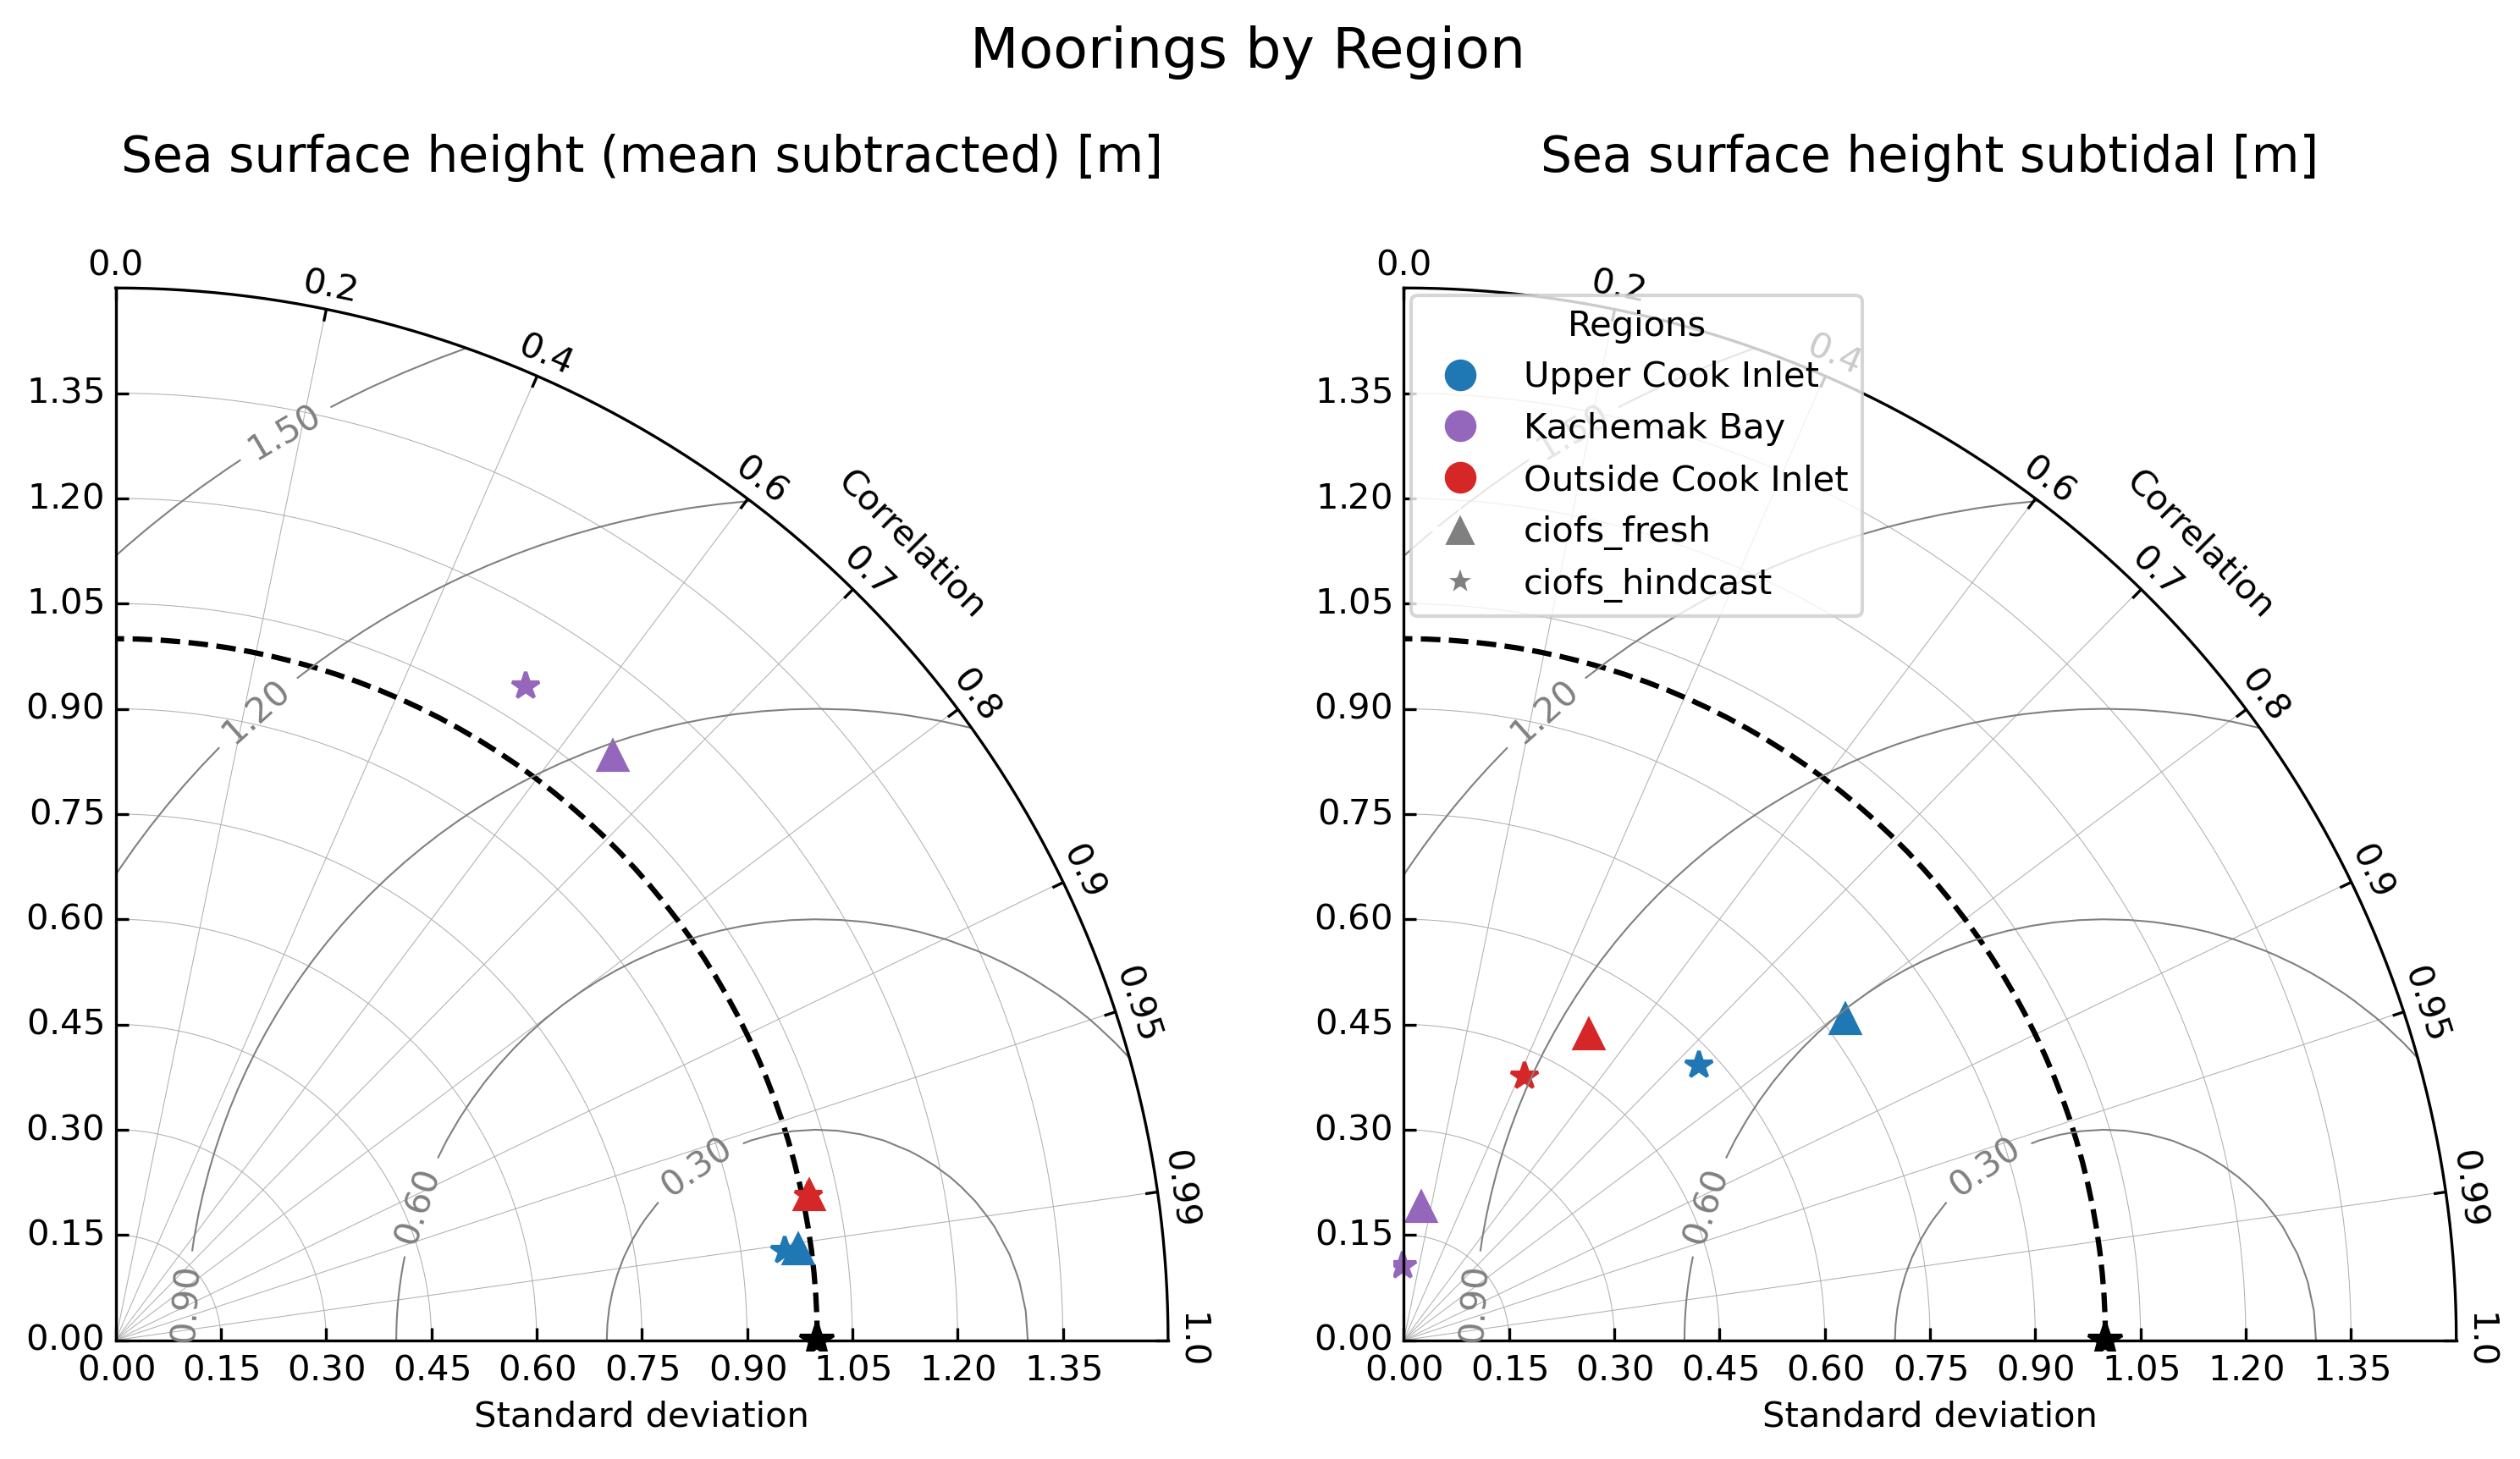
Fig. 55 Taylor Diagram summarizing skill of CIOFS Hindcast (stars) and CIOFS Fresh (triangles) for sea surface height: full signal minus the mean (left) and subtidal, grouped by region of Cook Inlet, for moorings.#
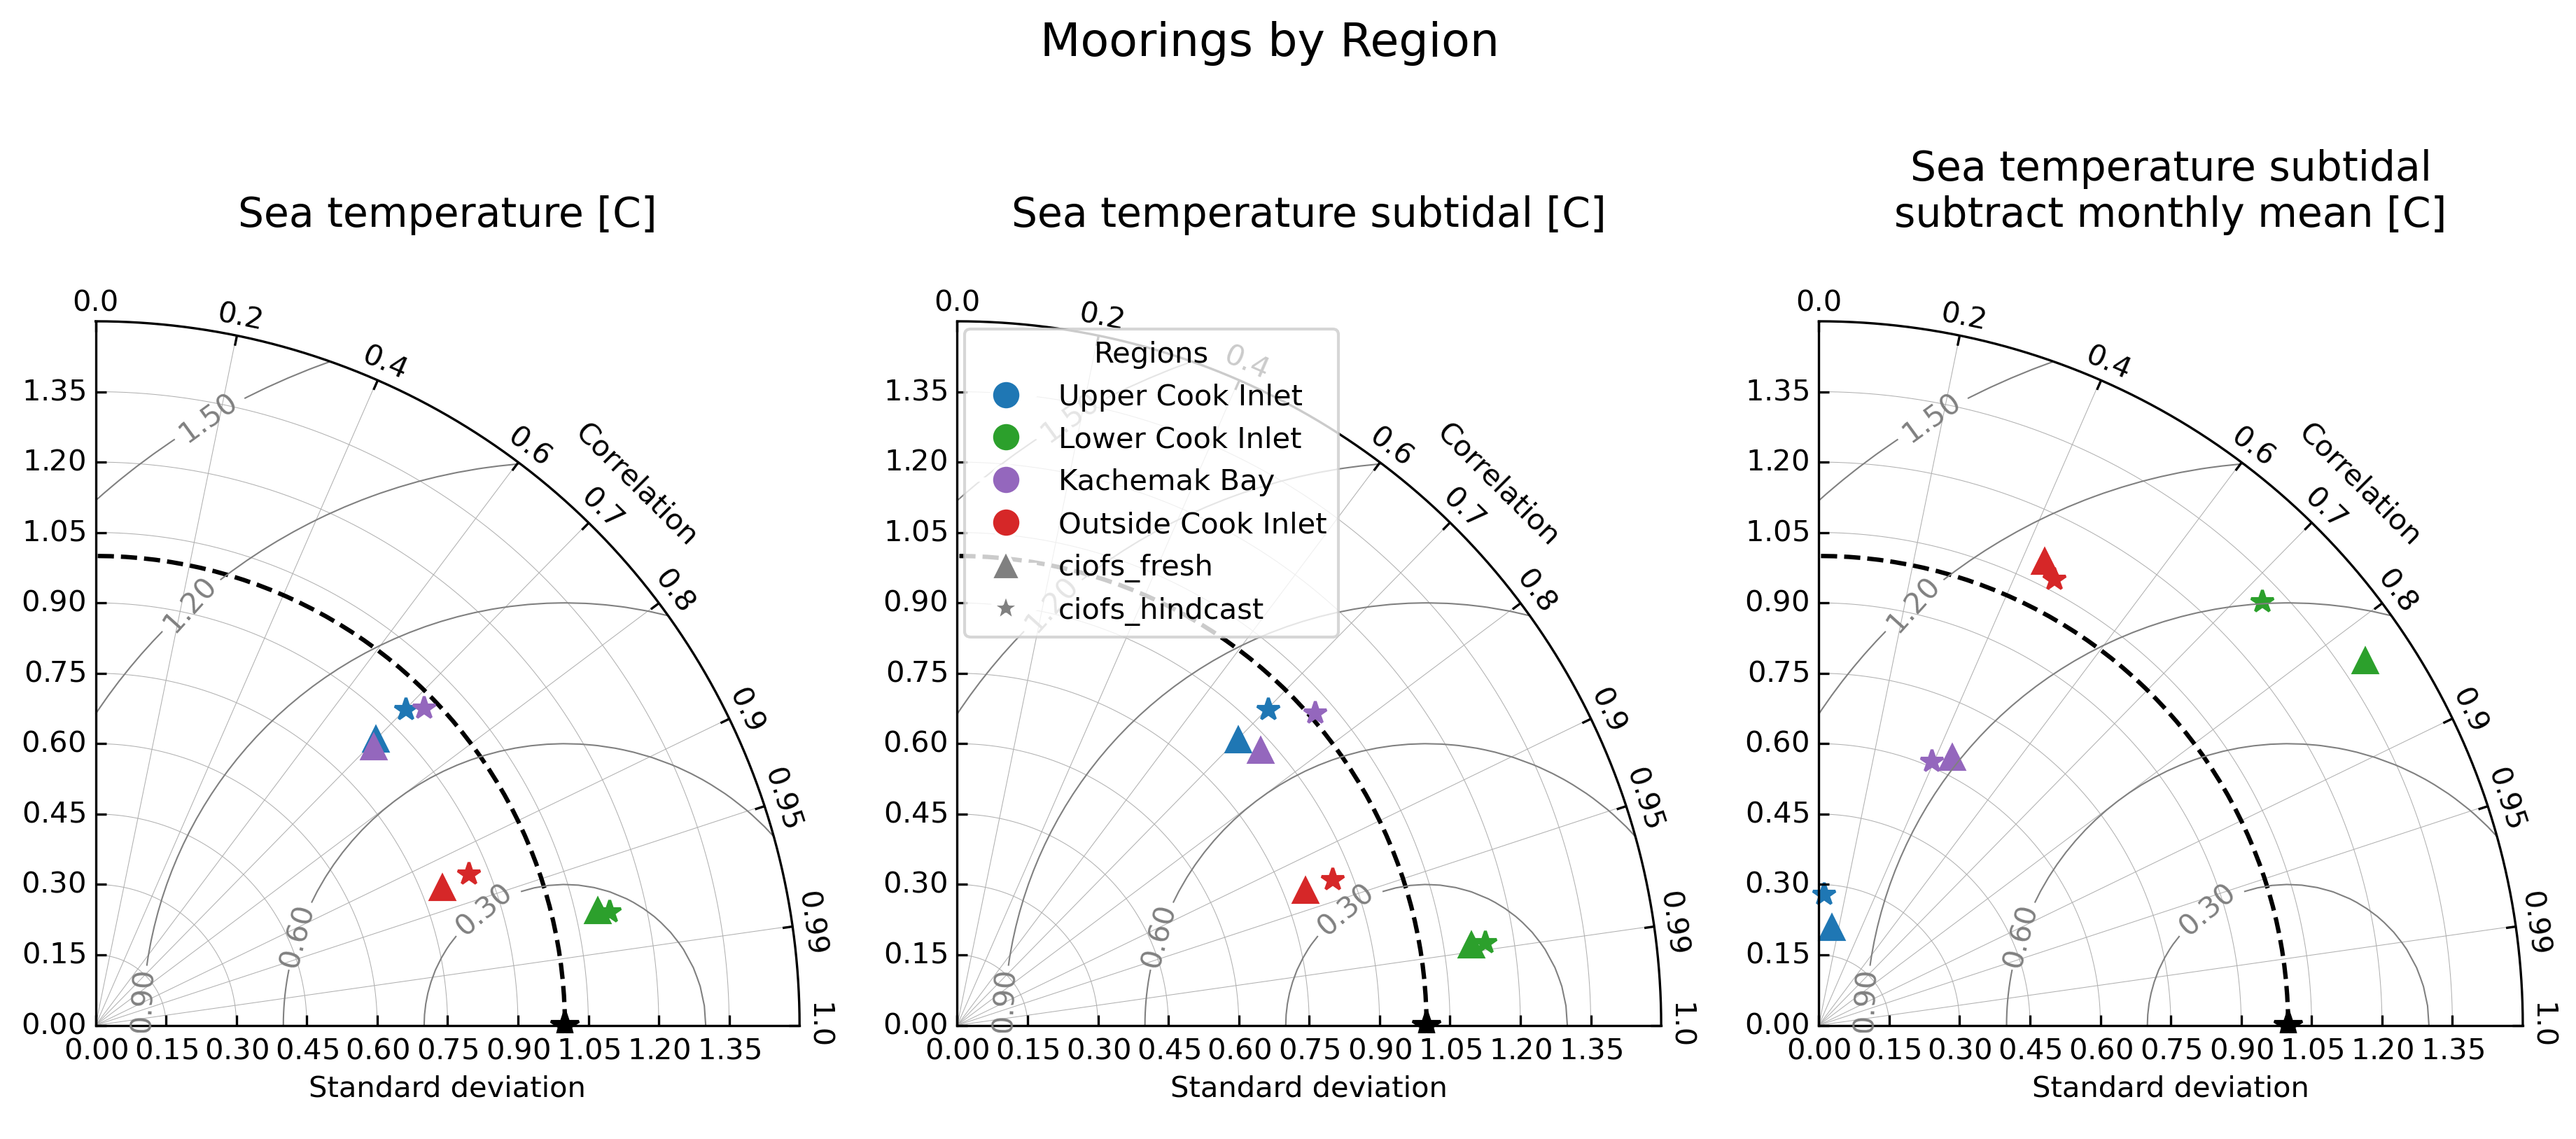
Fig. 56 Taylor Diagram summarizing skill of CIOFS Hindcast (stars) and CIOFS Fresh (triangles) for temperature: full signal (left), subtidal (center), and subtidal (right) minus the monthly mean, grouped by region of Cook Inlet, for moorings.#
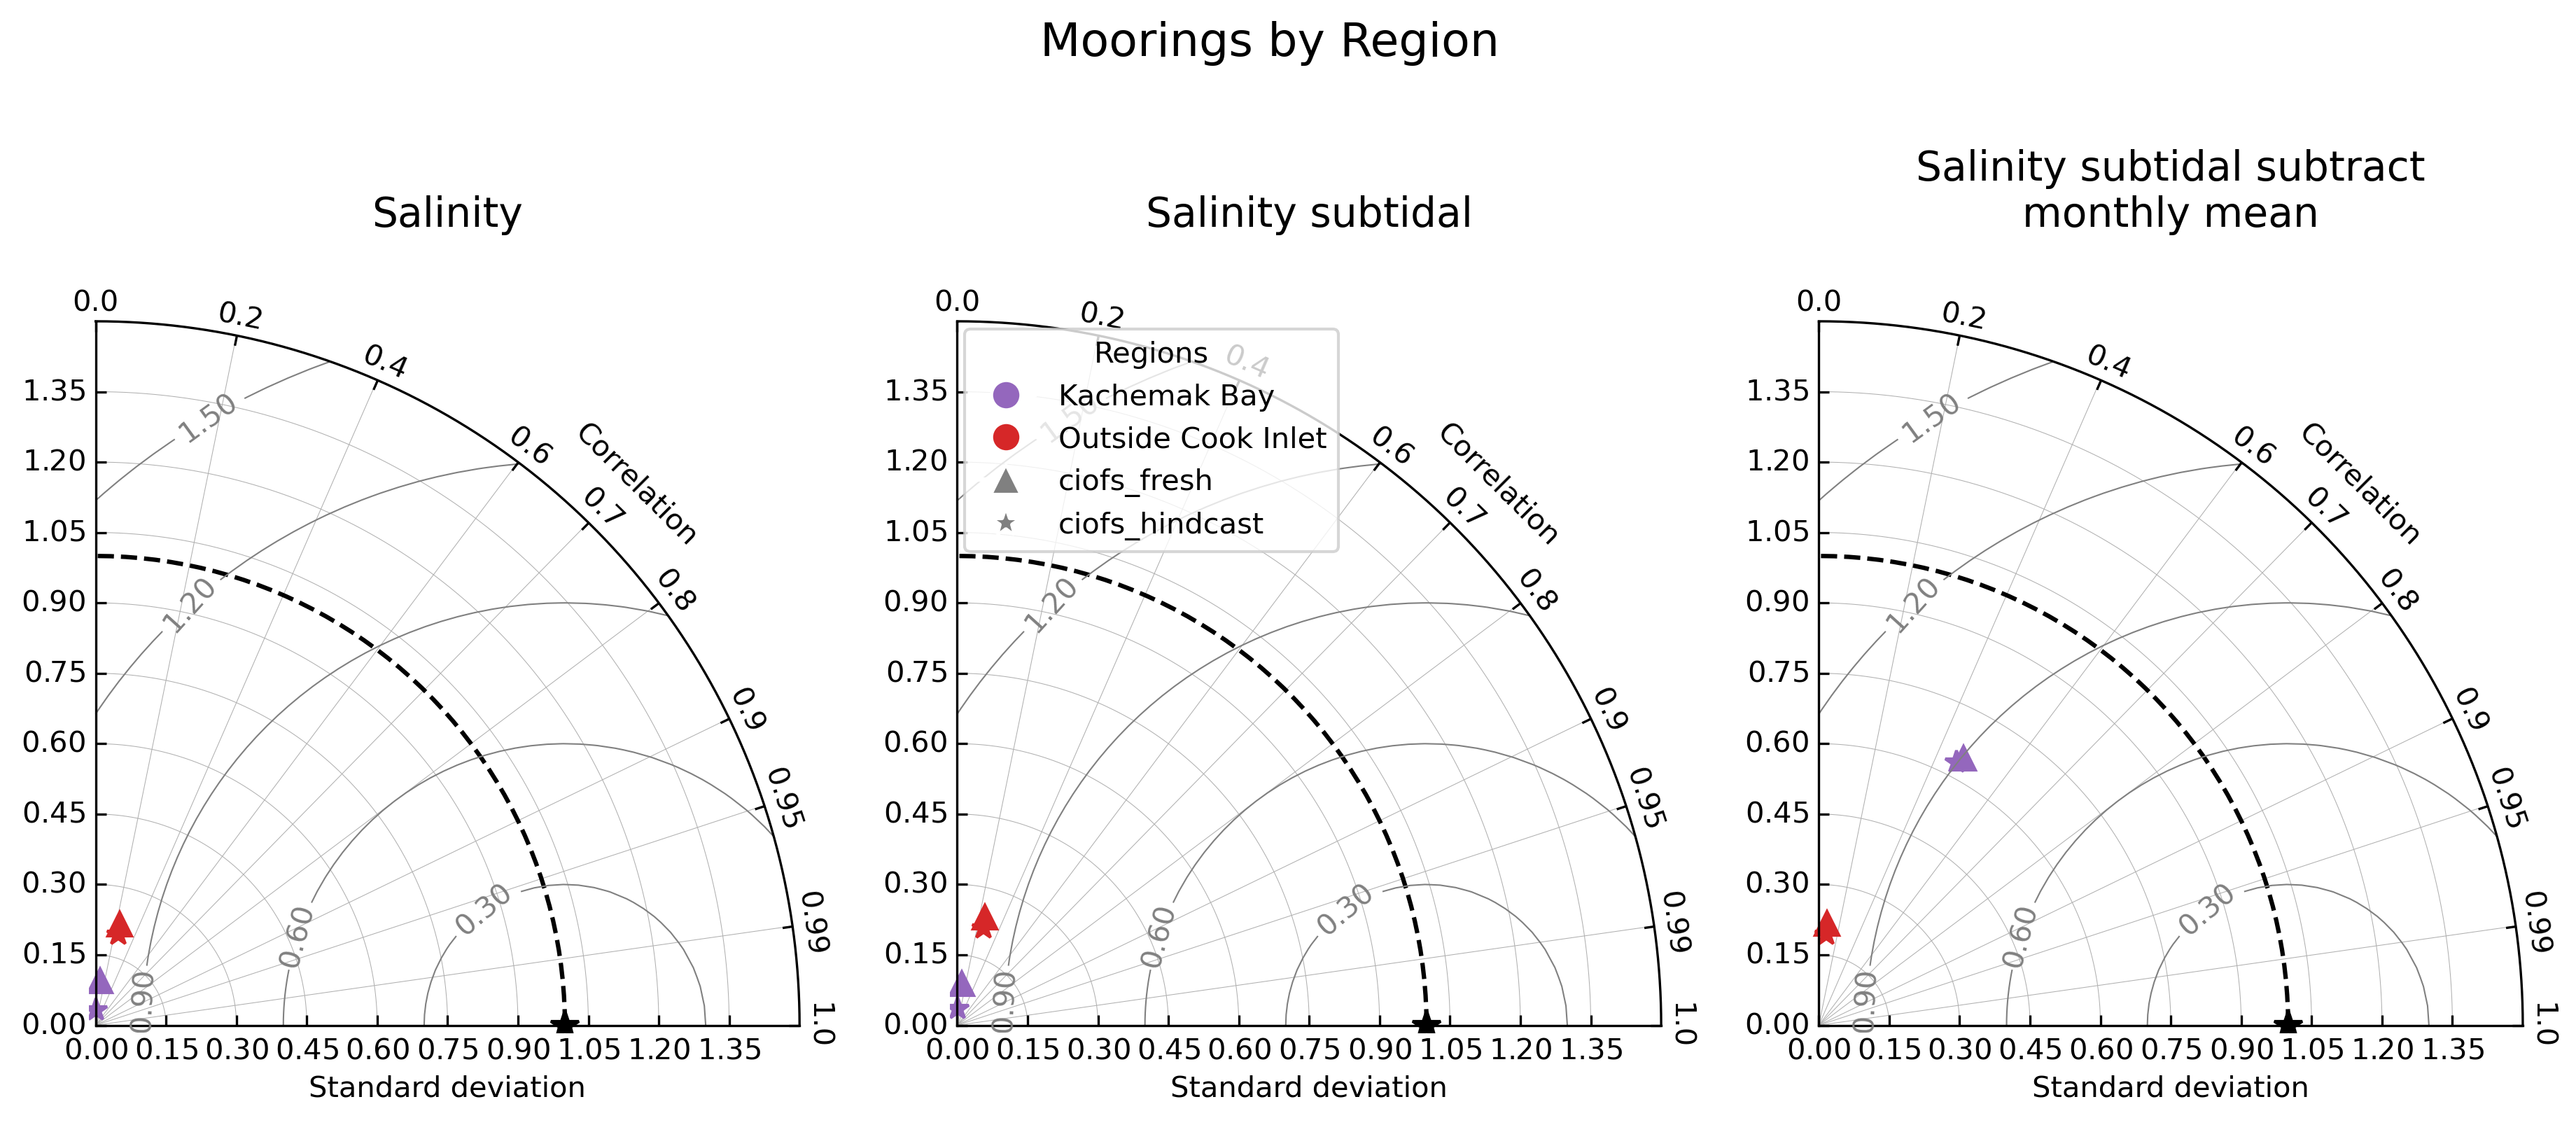
Fig. 57 Taylor Diagram summarizing skill of CIOFS Hindcast (stars) and CIOFS Fresh (triangles) for salinity: full signal (left), subtidal (center), and subtidal (right) minus the monthly mean, grouped by region of Cook Inlet, for moorings.#
Sea Surface Height#
Full signal, mean subtracted#
Fig. 58 Skill scores for CIOFS Hindcast (left) and CIOFS Freshwater (right) with moorings for sea surface height with mean subtracted, by project. Click on a legend entry to toggle the transparency. (HTML plot, won’t show up correctly in PDF.)#
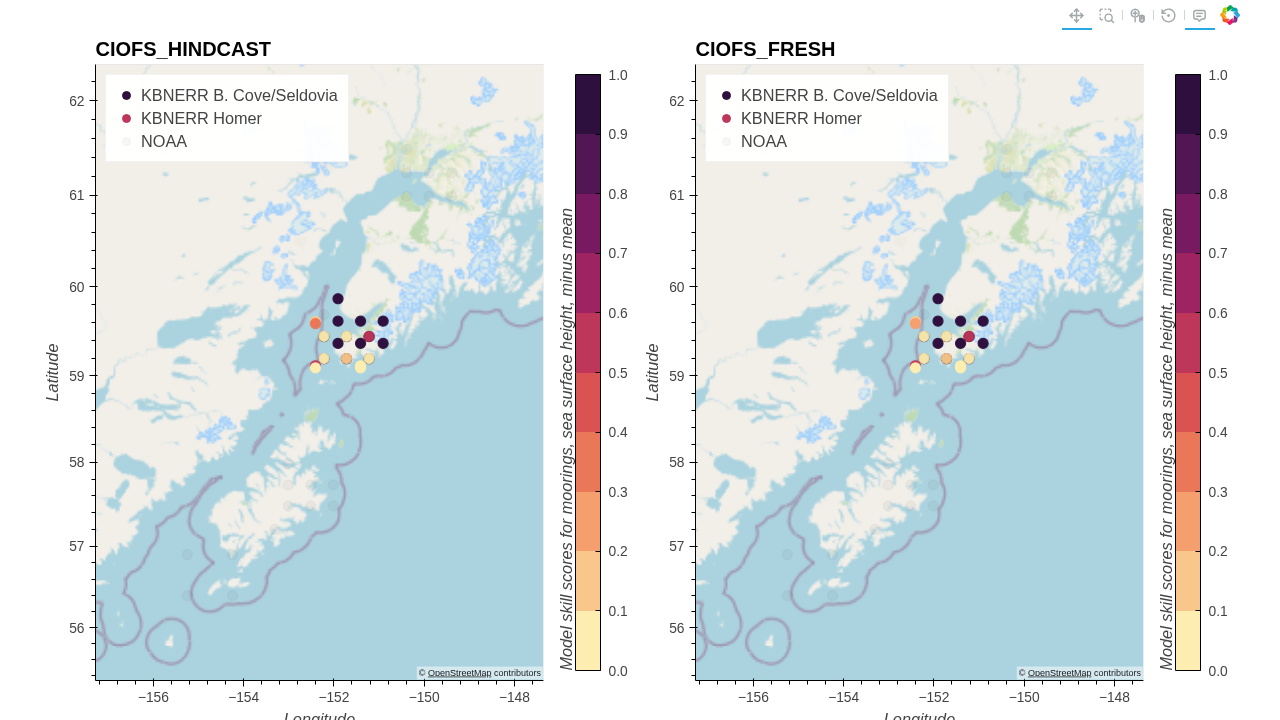
Fig. 59 Skill scores for CIOFS Hindcast (left) and CIOFS Freshwater (right) with moorings for sea surface height with mean subtracted, by project. (PNG screenshot, available for PDF and for saving image.)#
Subtidal, mean subtracted#
Fig. 60 Skill scores for CIOFS Hindcast (left) and CIOFS Freshwater (right) with moorings for subtidal sea surface height with mean subtracted, by project. Click on a legend entry to toggle the transparency. (HTML plot, won’t show up correctly in PDF.)#
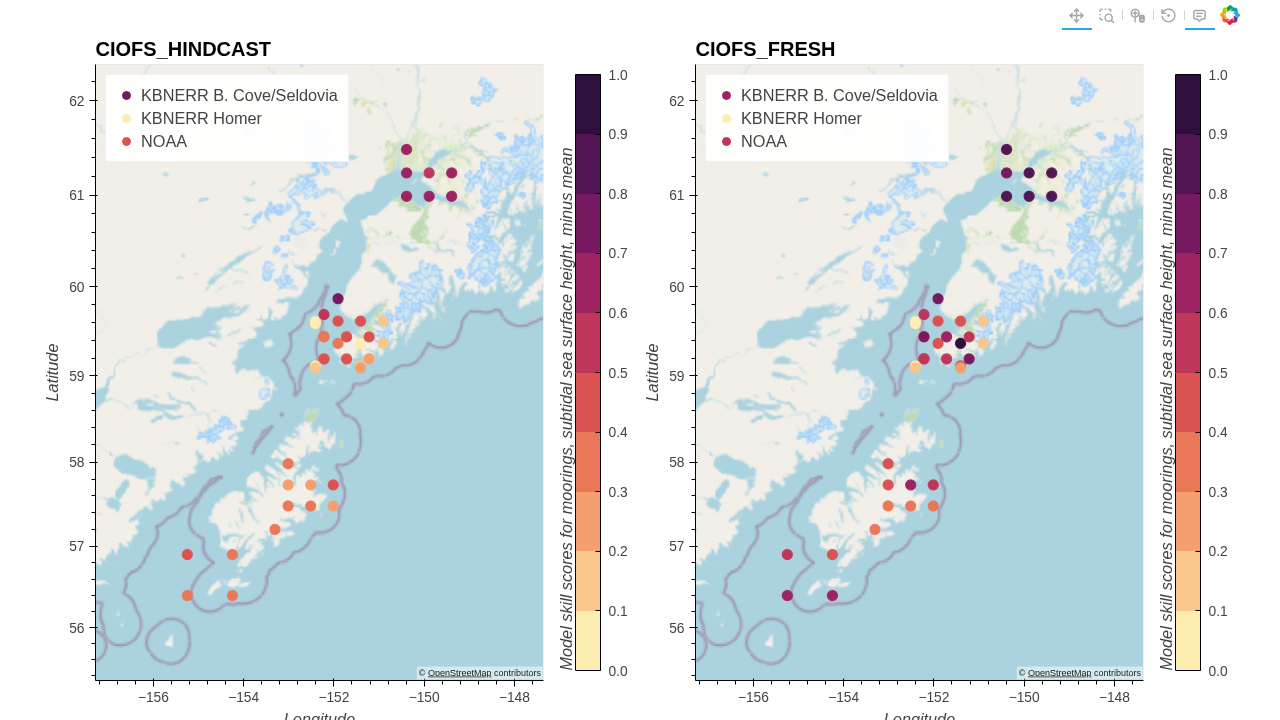
Fig. 61 Skill scores for CIOFS Hindcast (left) and CIOFS Freshwater (right) with moorings for subtidal sea surface height with mean subtracted, by project. (PNG screenshot, available for PDF and for saving image.)#
Temperature#
Full signal#
Fig. 62 Skill scores for CIOFS Hindcast (left) and CIOFS Freshwater (right) with moorings for temperature, by project. Click on a legend entry to toggle the transparency. (HTML plot, won’t show up correctly in PDF.)#
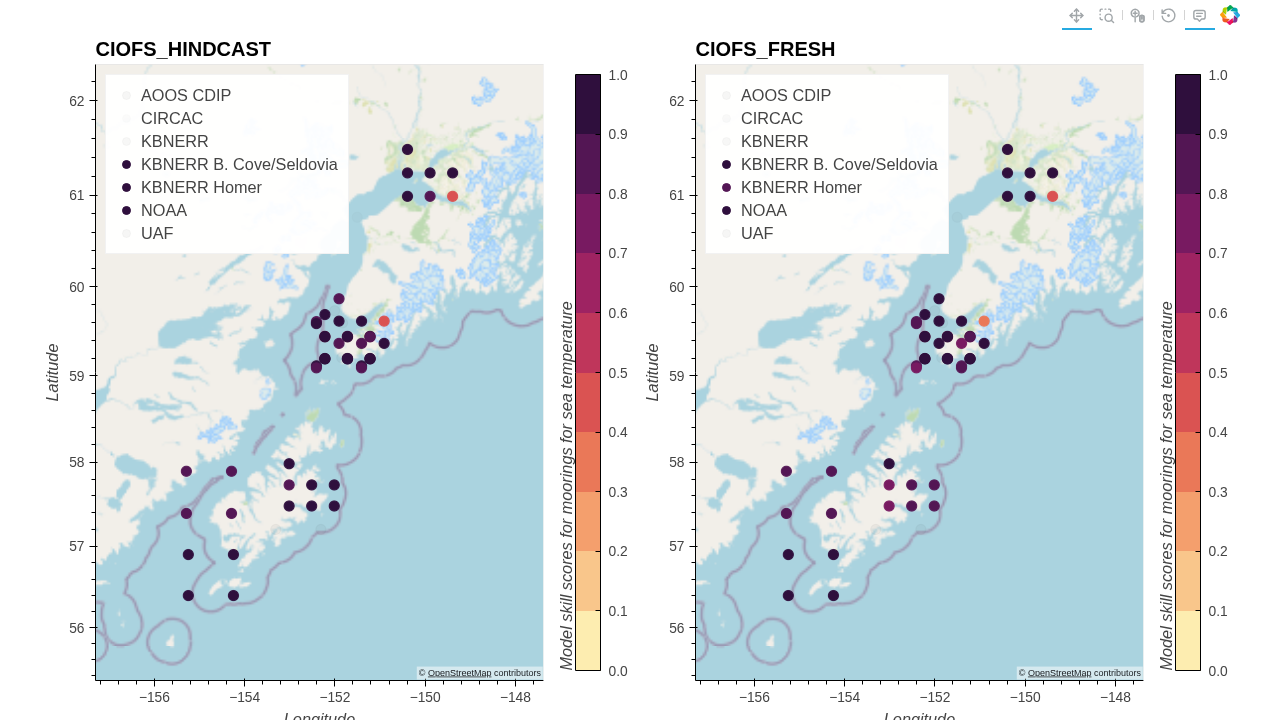
Fig. 63 Skill scores for CIOFS Hindcast (left) and CIOFS Freshwater (right) with moorings for subtidal sea surface height with mean subtracted, by project. (PNG screenshot, available for PDF and for saving image.)#
Subtidal#
Fig. 64 Skill scores for CIOFS Hindcast (left) and CIOFS Freshwater (right) with moorings for subtidal temperature, by project. Click on a legend entry to toggle the transparency. (HTML plot, won’t show up correctly in PDF.)#

Fig. 65 Skill scores for CIOFS Hindcast (left) and CIOFS Freshwater (right) with moorings for subtidal temperature, by project. (PNG screenshot, available for PDF and for saving image.)#
Subtidal with monthly-averaged climatology subtracted#
Fig. 66 Skill scores for CIOFS Hindcast (left) and CIOFS Freshwater (right) with moorings for subtidal temperature anomaly, by project. Click on a legend entry to toggle the transparency. (HTML plot, won’t show up correctly in PDF.)#
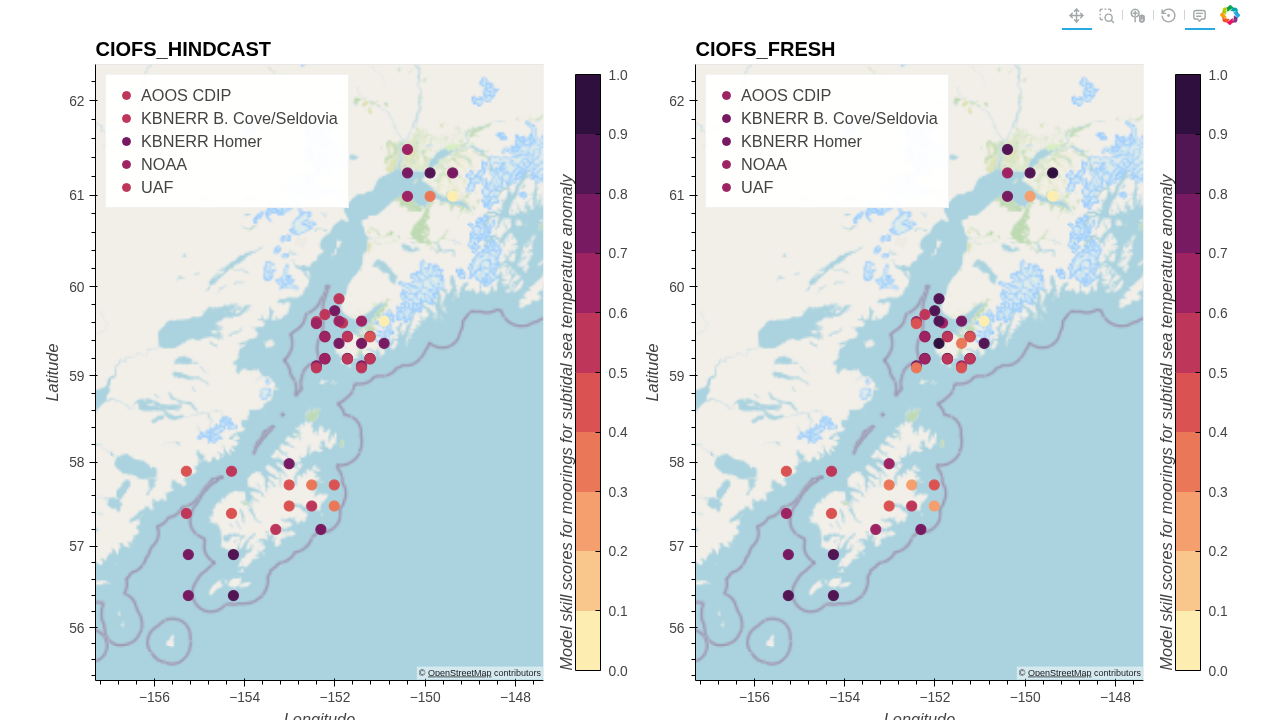
Fig. 67 Skill scores for CIOFS Hindcast (left) and CIOFS Freshwater (right) with moorings for subtidal temperature anomaly, by project. (PNG screenshot, available for PDF and for saving image.)#
Salinity#
Full signal#
Fig. 68 Skill scores for CIOFS Hindcast (left) and CIOFS Freshwater (right) with moorings for salinity, by project. Click on a legend entry to toggle the transparency. (HTML plot, won’t show up correctly in PDF.)#

Fig. 69 Skill scores for CIOFS Hindcast (left) and CIOFS Freshwater (right) with moorings for salinity, by project. (PNG screenshot, available for PDF and for saving image.)#
Subtidal#
Fig. 70 Skill scores for CIOFS Hindcast (left) and CIOFS Freshwater (right) with moorings for subtidal salinity, by project. Click on a legend entry to toggle the transparency. (HTML plot, won’t show up correctly in PDF.)#
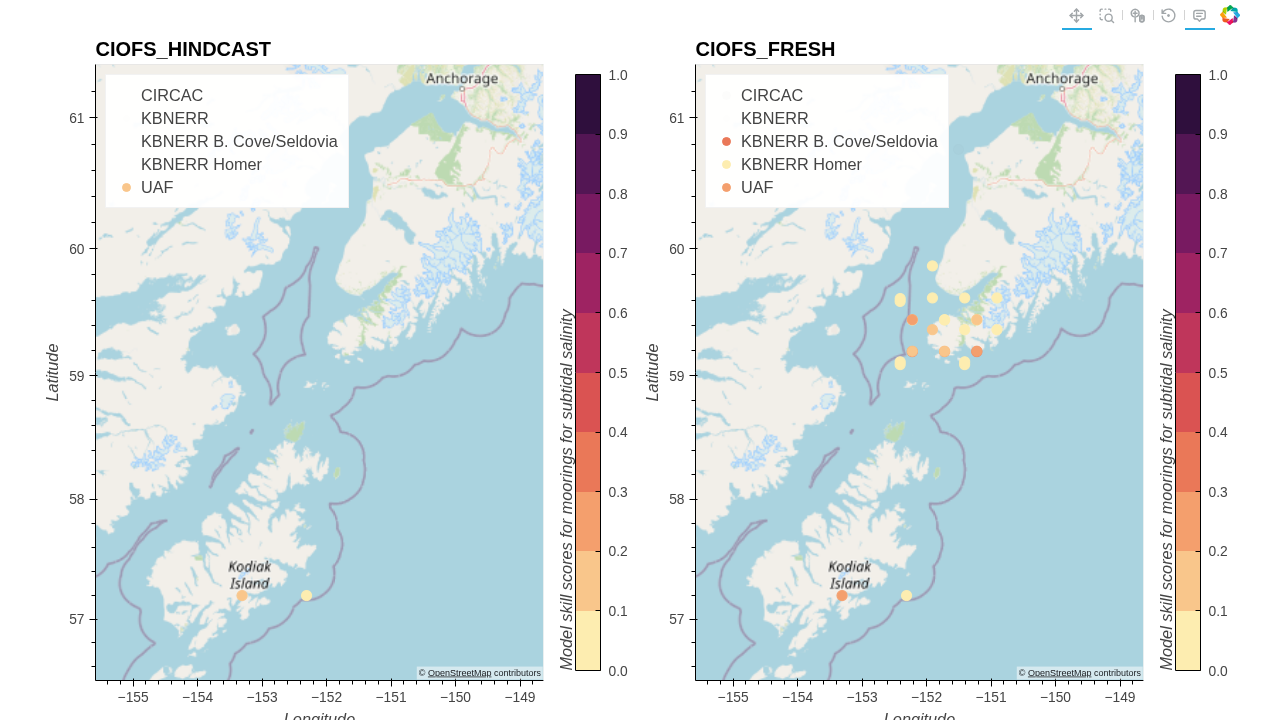
Fig. 71 Skill scores for CIOFS Hindcast (left) and CIOFS Freshwater (right) with moorings for subtidal salinity, by project. (PNG screenshot, available for PDF and for saving image.)#
Subtidal with monthly-averaged climatology subtracted#
Fig. 72 Skill scores for CIOFS Hindcast (left) and CIOFS Freshwater (right) with moorings for subtidal salinity anomaly, by project. Click on a legend entry to toggle the transparency. (HTML plot, won’t show up correctly in PDF.)#
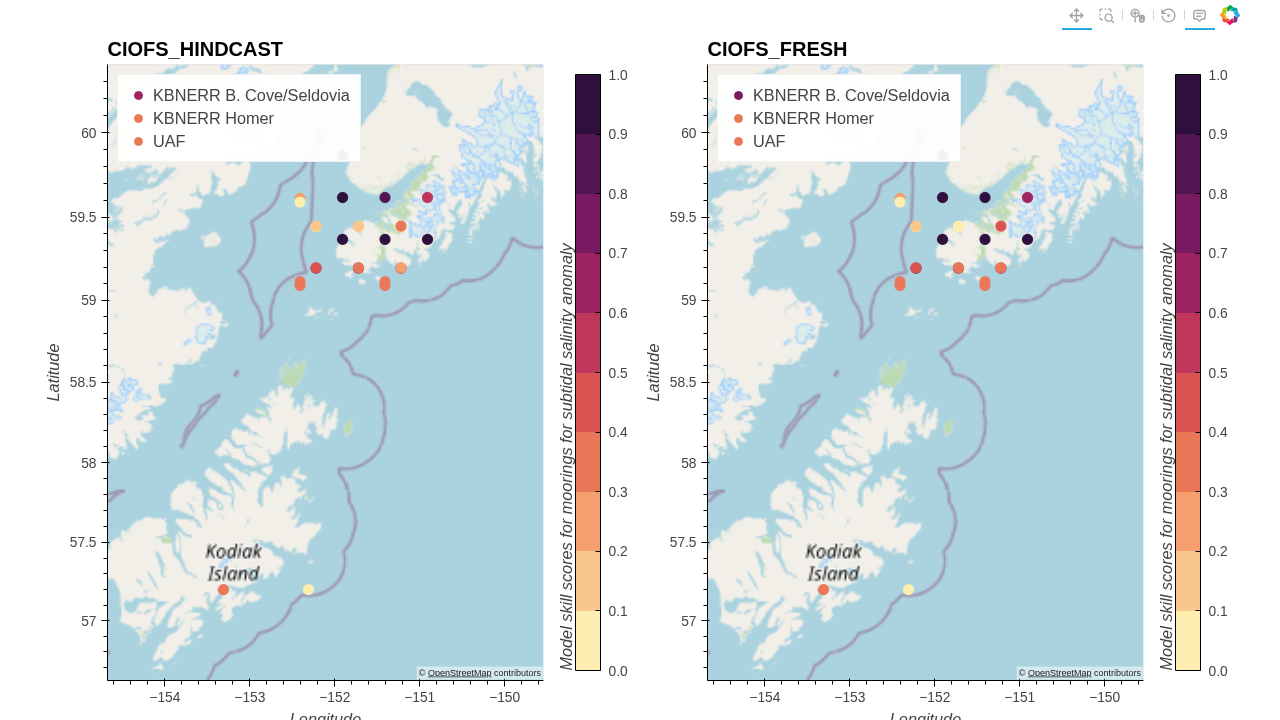
Fig. 73 Skill scores for CIOFS Hindcast (left) and CIOFS Freshwater (right) with moorings for subtidal salinity anomaly, by project. (PNG screenshot, available for PDF and for saving image.)#