Overview CTD Transects#
Shown here are plots to summarize the skill of the models in representing the data. First are Taylor Diagrams summarize the overall skill of the models. Subsequently, in the next overview plots, each colored square marker represents the skill score for the model compared with the data for a visit to the transect. The length of each transect was split into the number of visits with a square for each visit; if there were many repeat visits there are a lot of squares along a transect and only one for a single visit.
Results show similar but slightly improved skill for CIOFS fresh over CIOFS Hindcast for temperature and clearly improved skill for salinity.
226MB zipfile of plots and stats files
164MB zipfile of CTD profile plots from CTD transects
Map of Stations#
Fig. 74 All CTD transects (repeats indicated but not plotted), by project. Click on a legend entry to toggle the transparency.#
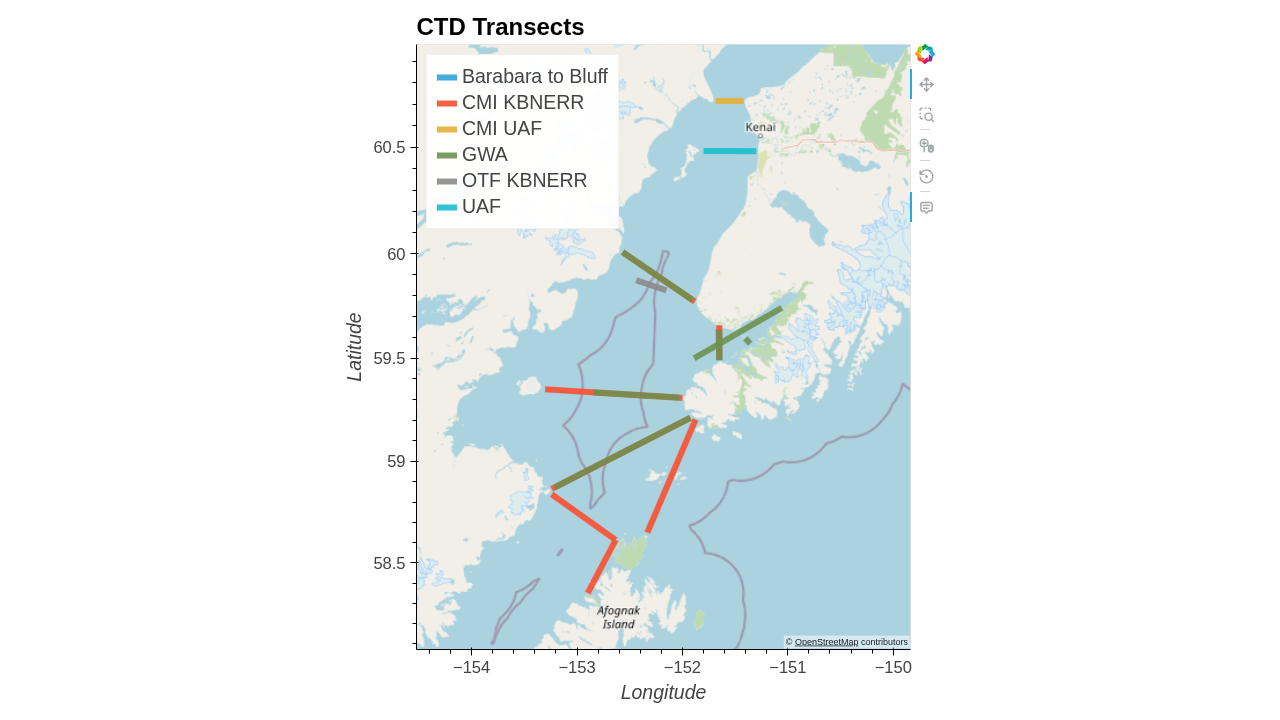
Fig. 75 All CTD transects, by project. (PNG screenshot, available for PDF and for saving image.)#
Taylor Diagrams#
Taylor diagrams summarize the skill of the two models in capturing the CTD transect datasets. The data has been grouped by region (Fig. 76) and season (Fig. 77). The results show that CIOFS fresh performs slightly better than CIOFS hindcast for temperature across different groupings, and much better for salinity. Skill scores are shown in the next plots for each dataset.
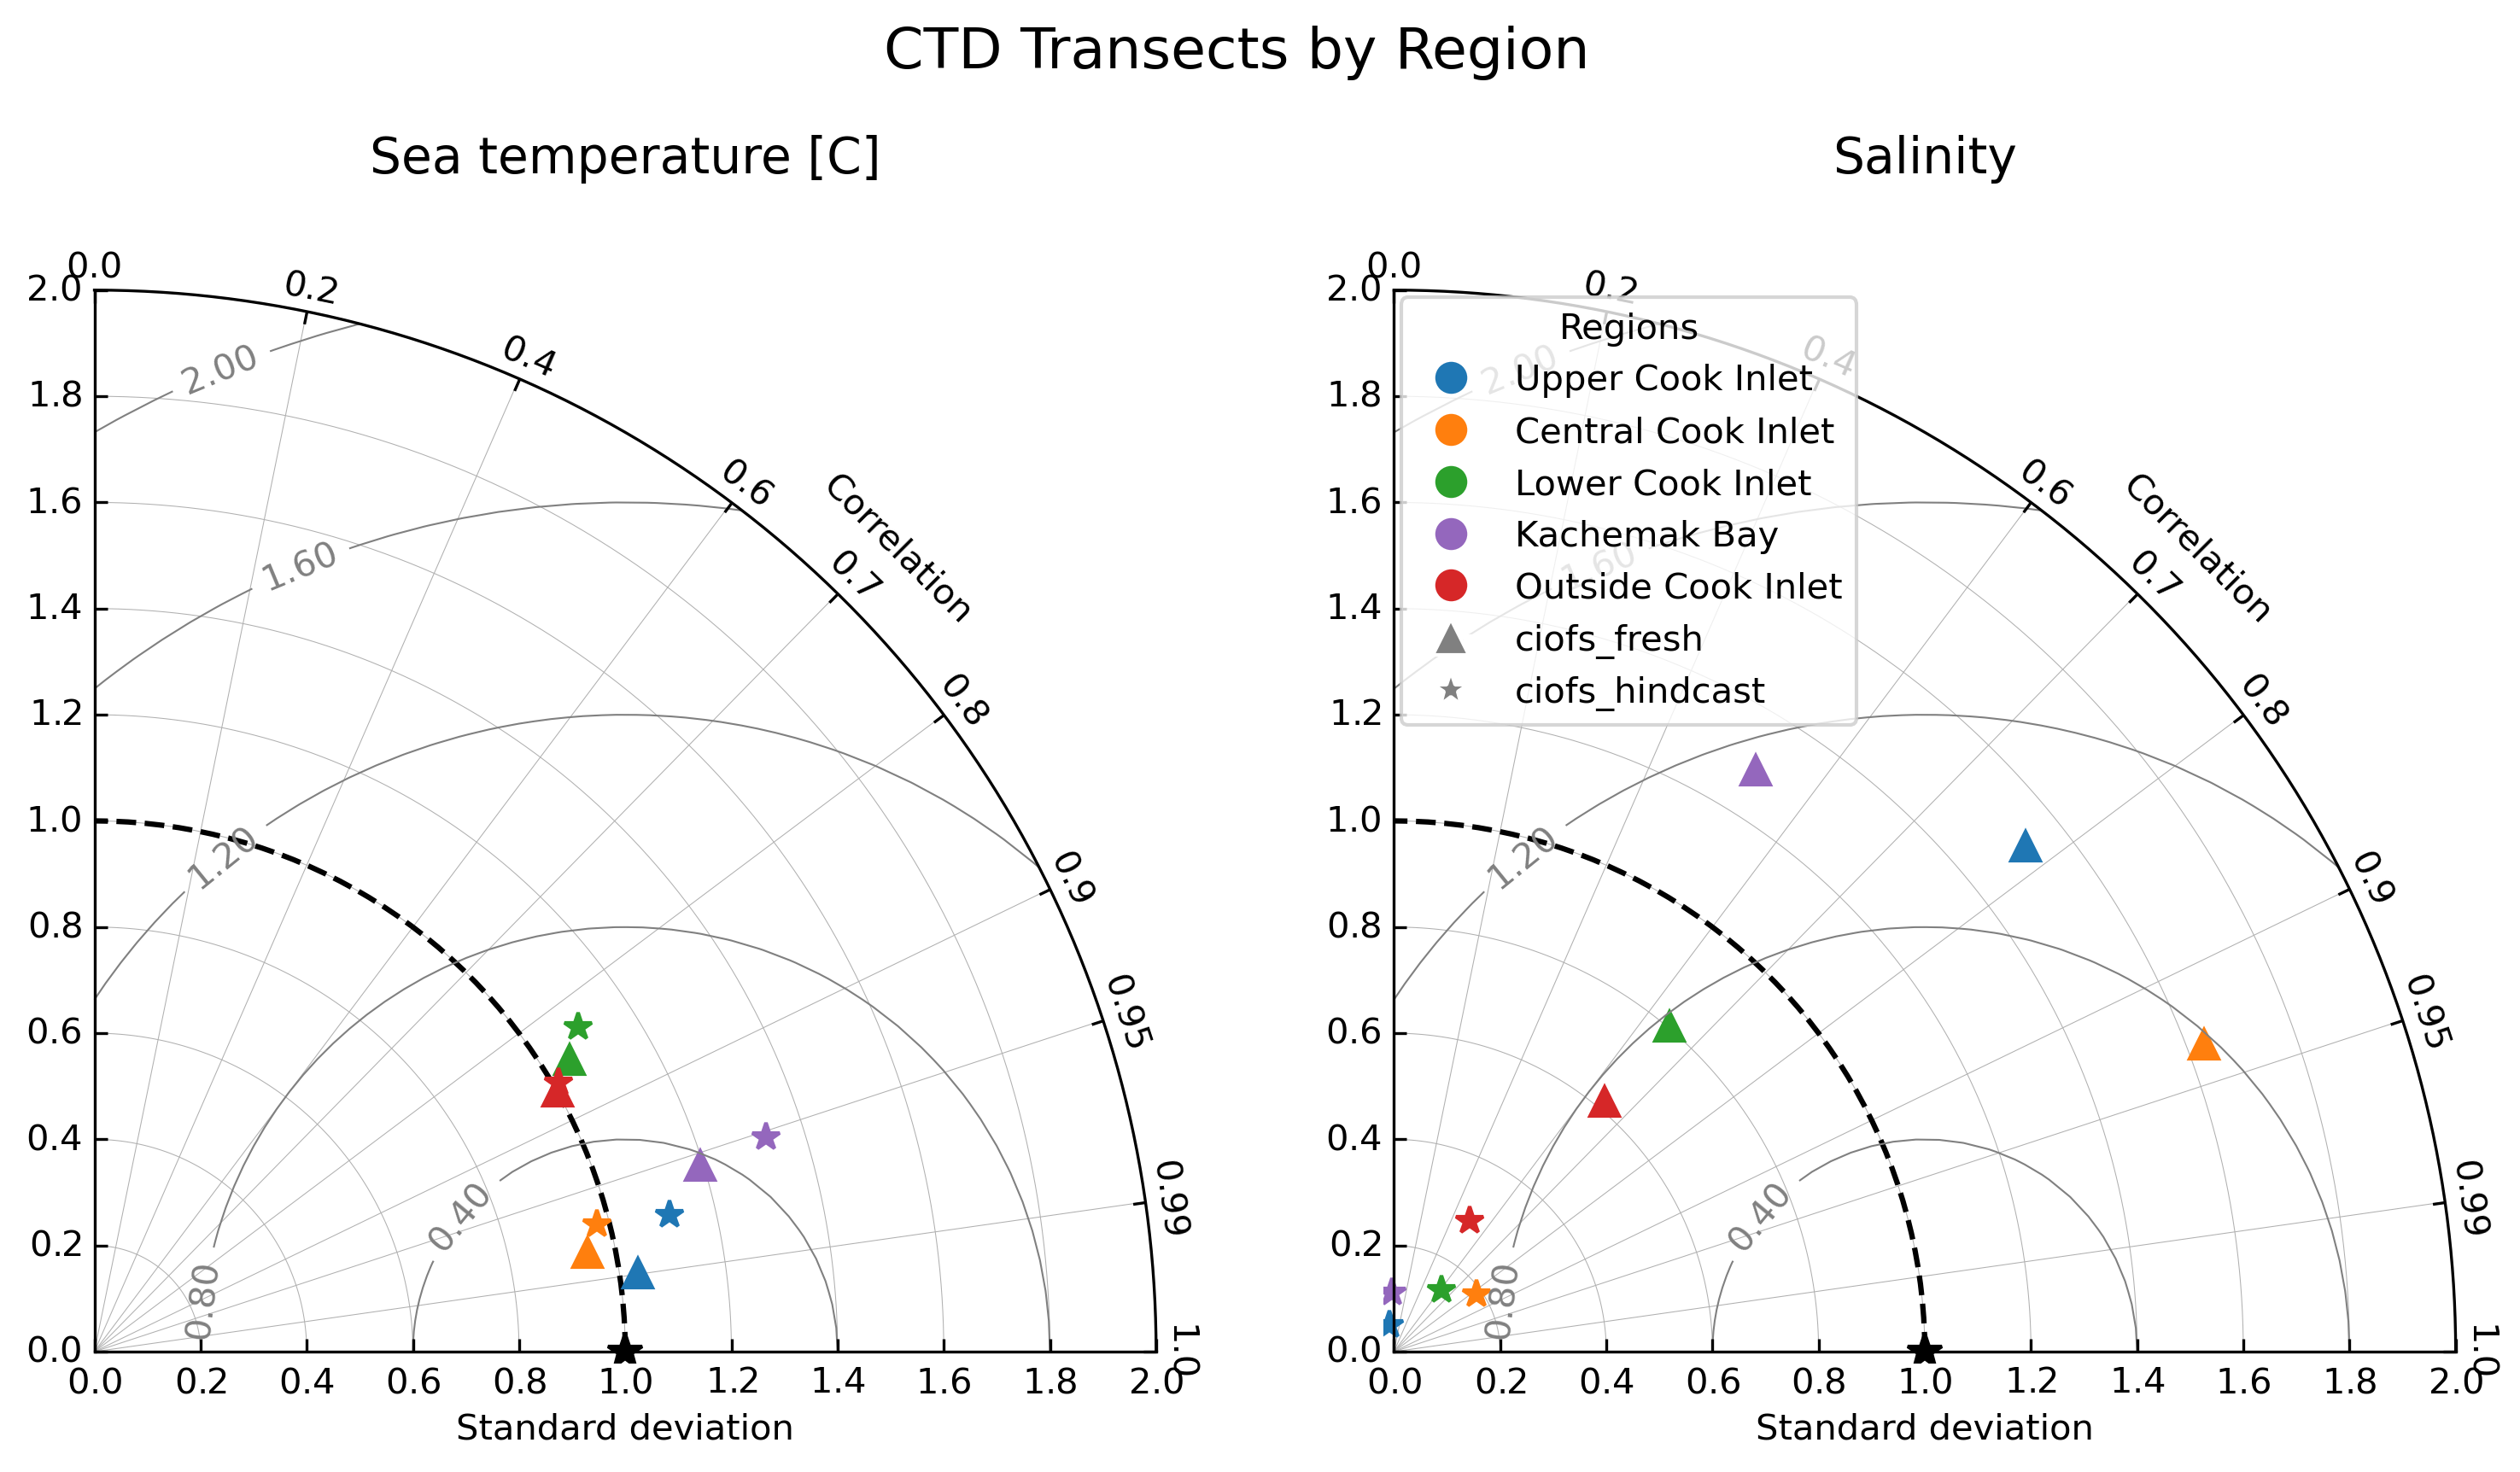
Fig. 76 Taylor Diagram summarizing skill of CIOFS Hindcast (stars) and CIOFS Fresh (triangles) for temperature (left) and salinity (right), grouped by region of Cook Inlet, for CTD transects datasets.#
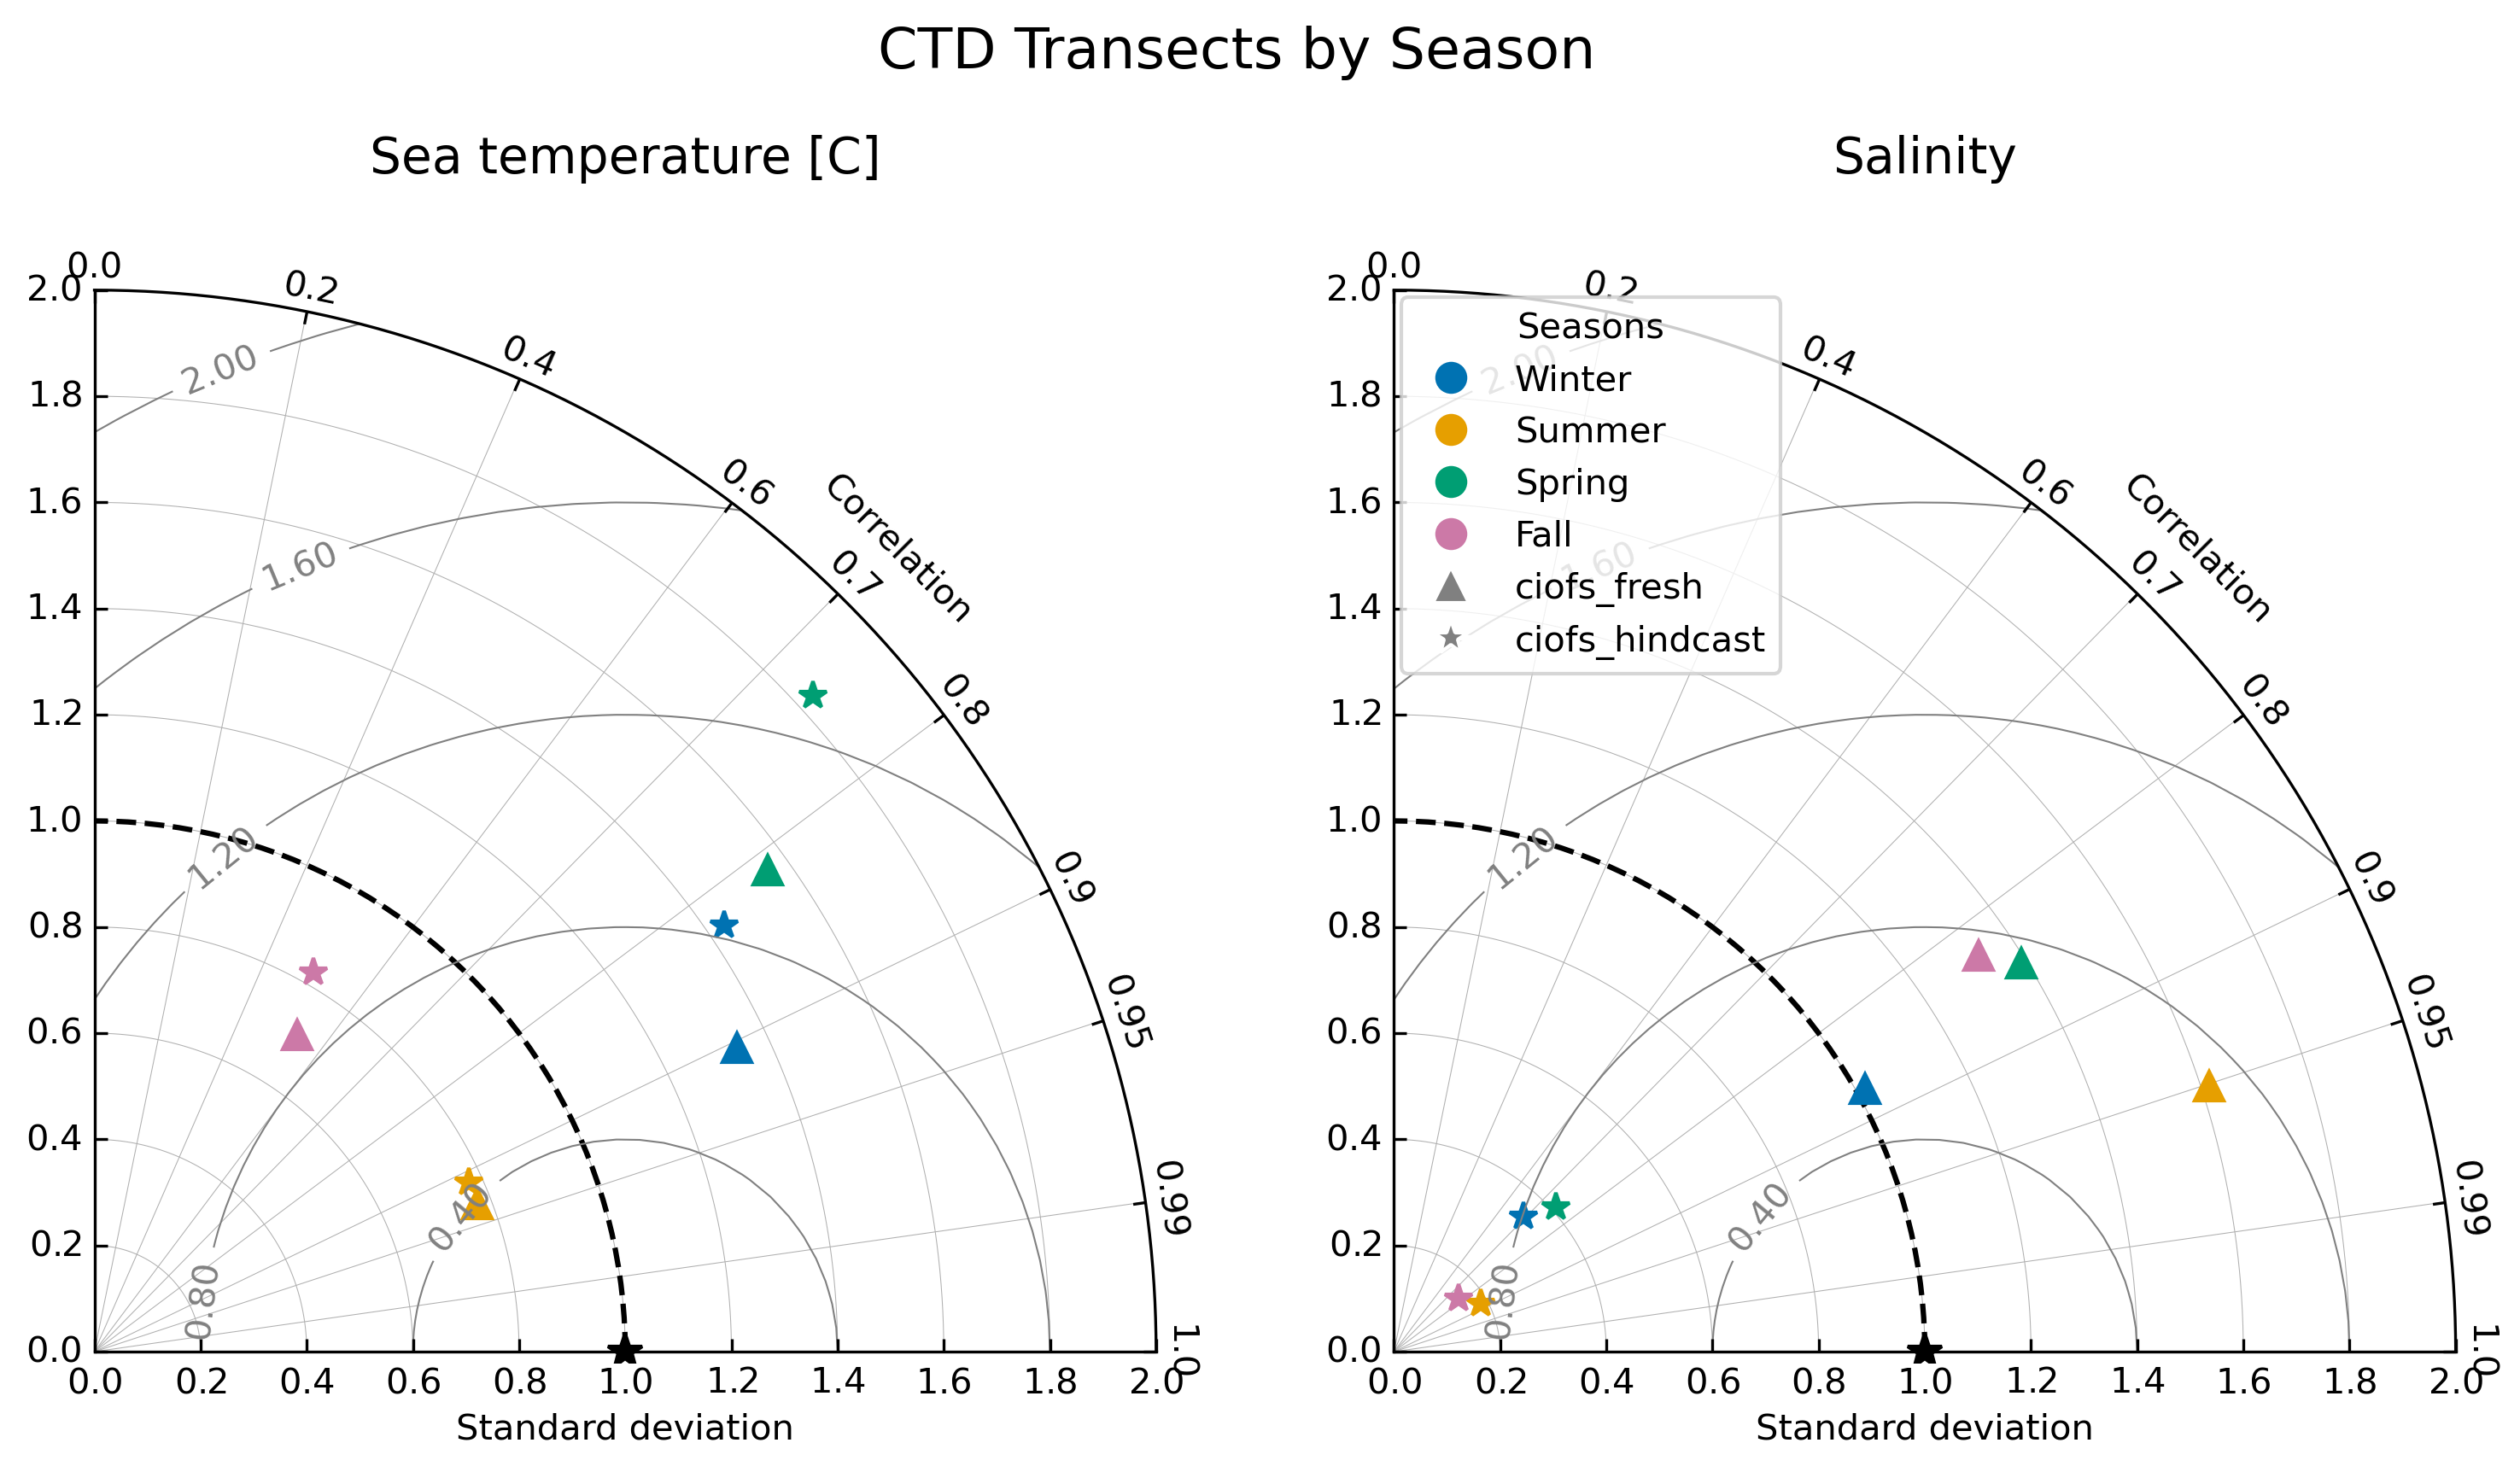
Fig. 77 Taylor Diagram summarizing skill of CIOFS Hindcast (stars) and CIOFS Fresh (triangles) for temperature (left) and salinity (right), grouped by season, for CTD transects datasets.#
Sea Temperature#
Fig. 78 Skill scores for CIOFS Hindcast (left) and CIOFS Freshwater (right) with CTD transects for sea temperature, by project. Click on a legend entry to toggle the transparency. (HTML plot, won’t show up correctly in PDF.)#
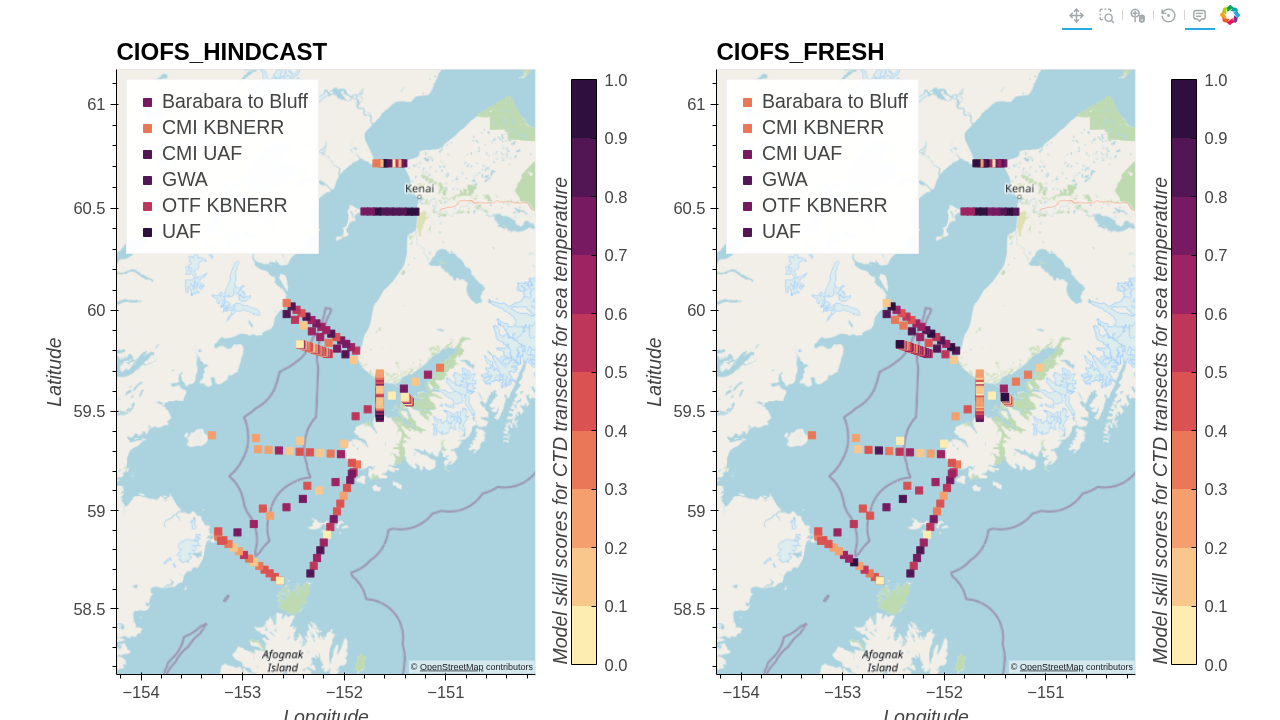
Fig. 79 Skill scores for CIOFS Hindcast (left) and CIOFS Freshwater (right) with CTD transects for sea temperature, by project. (PNG screenshot, available for PDF and for saving image.)#
Salinity#
Fig. 80 Skill scores for CIOFS Hindcast (left) and CIOFS Freshwater (right) with CTD transects for salinity, by project. Click on a legend entry to toggle the transparency. (HTML plot, won’t show up correctly in PDF.)#
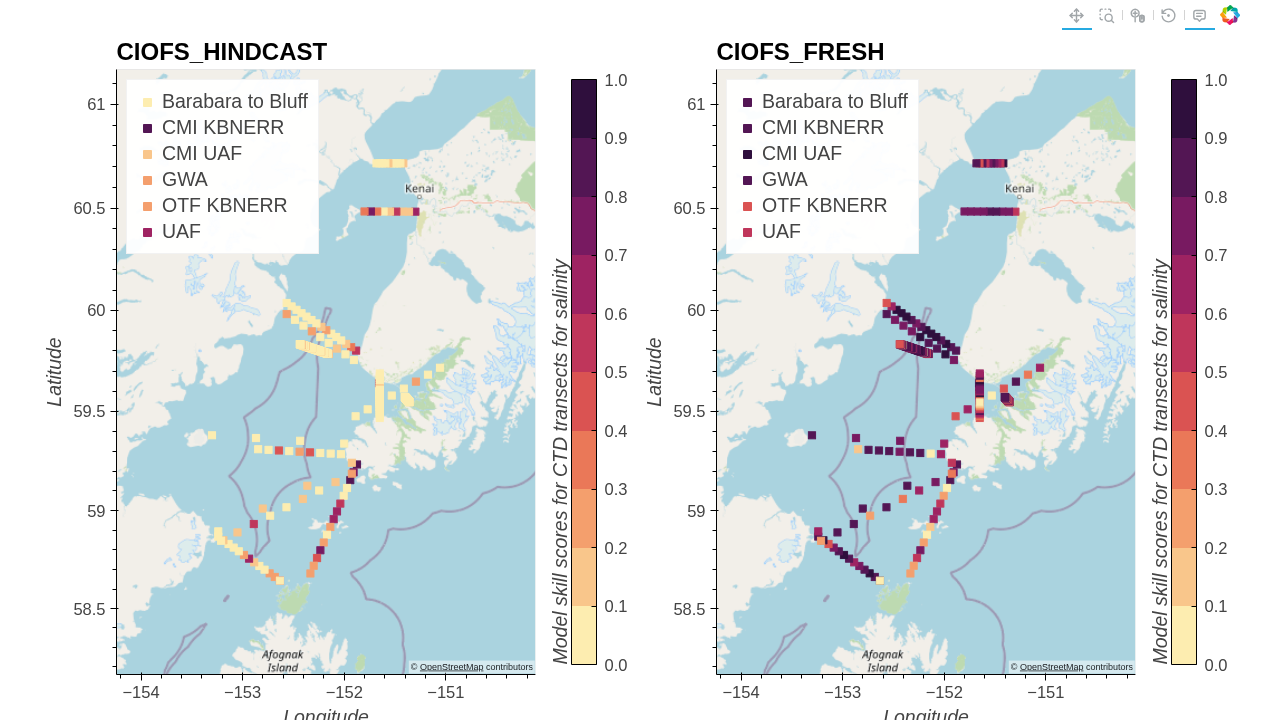
Fig. 81 Skill scores for CIOFS Hindcast (left) and CIOFS Freshwater (right) with CTD transects for salinity, by project. (PNG screenshot, available for PDF and for saving image.)#