Model Assessment Summary#
A summary of the model comparisons with the data variables is given in this section. The “Overview” pages have Taylor diagrams and plots that show the skill score as a summary metric from each model-data comparison shown in the subpages (see Methodology).
The previous report [TLFD23] demonstrated that the CIOFS Hindcast model does not having enough freshwater input into the system to have realistic salinity variability, nor accurate salinity. The CIOFS Hindcast model performs better for other variables. The major seasonal sea water temperature signal is well-captured, though temperature anomaly is not. CIOFS Hindcast captures the tidal sea surface height well, and mostly does well at subtidal sea surface height as well. It also captures horizontal speed reasonably well.
Next we will summarize how the CIOFS Hindcast and CIOFS Freshwater models perform when compared with the data across these variables. See Methodology for how to read in the individual model-data comparison figures.
Salinity#
The CIOFS Freshwater model is forced with freshwater accounting for the whole watershed, and the amount of freshwater input into the model is much higher than is input into the CIOFS Hindcast model (see details in Model Descriptions). Given this, we can expect there to be much fresher water in the salinity field compared to the CIOFS Hindcast.
The salinity field is captured much better by CIOFS Freshwater than CIOFS Hindcast when looking at CTD transects (see Fig. 76). For example, whereas a CIOFS Hindcast CTD transect (Fig. 6) is nearly uniformly salty, the equivalent CIOFS Freshwater transect (Fig. 7) has good horizontal variability and some vertical variability.
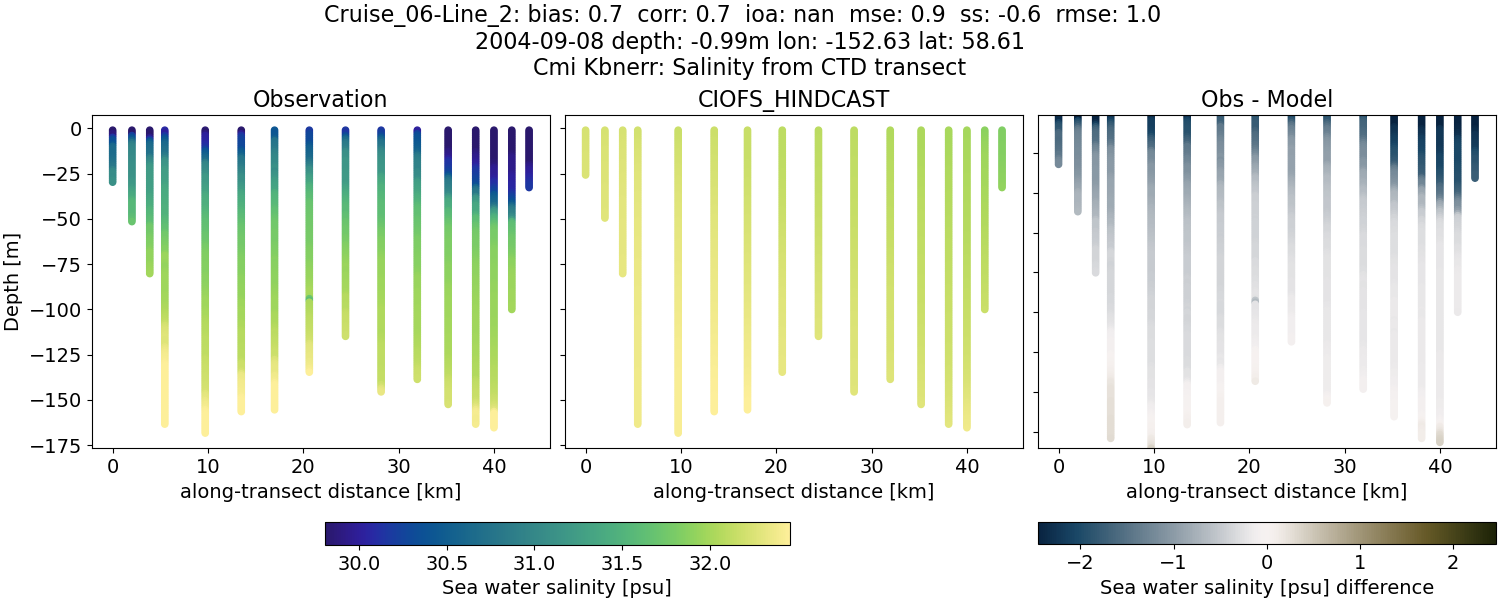
Fig. 6 Example of CIOFS Hindcast CTD transect comparison with salinity data (from the CMI KBNERR project of repeated transects across Cook Inlet).#
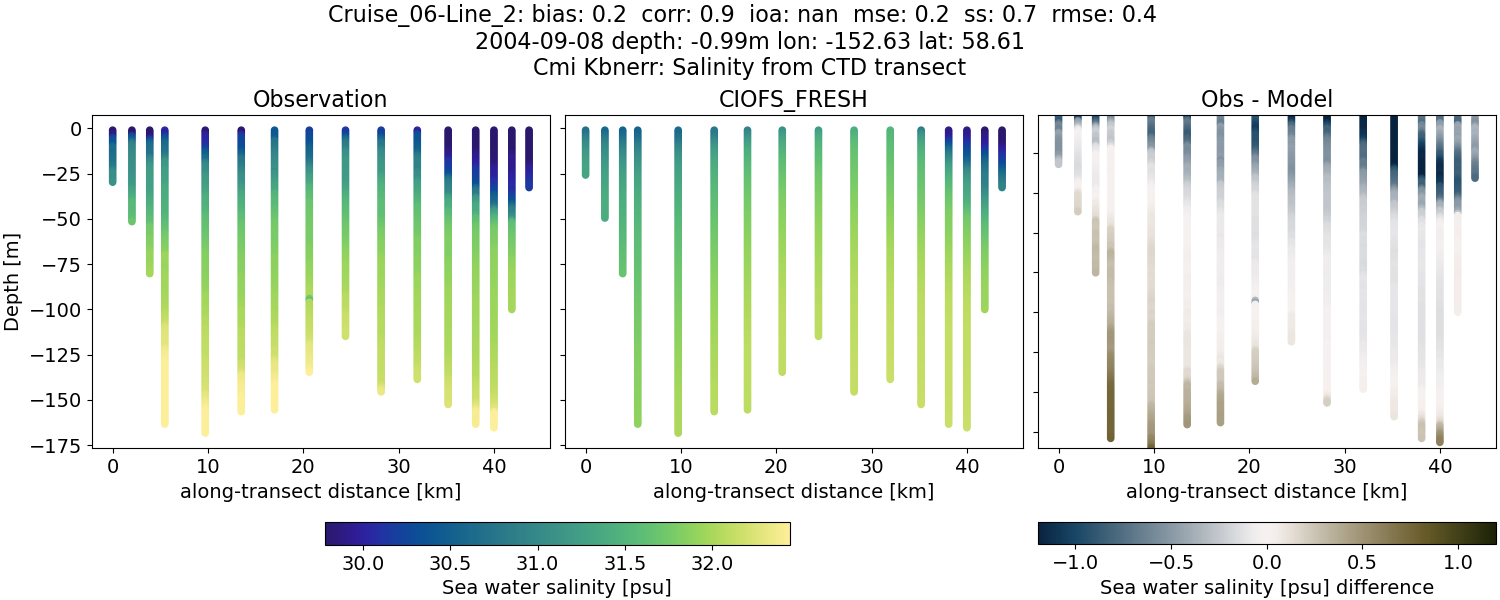
Fig. 7 Example of CIOFS Freshwater CTD transect comparison with salinity data (from the CMI KBNERR project of repeated transects across Cook Inlet).#
Similarly, a CIOFS Hindcast along-bay CTD transect (Fig. 8) is nearly uniformly salty, while the equivalent CIOFS Freshwater transect (Fig. 9) has good horizontal variability and vertical variability, though the water is still too salty.
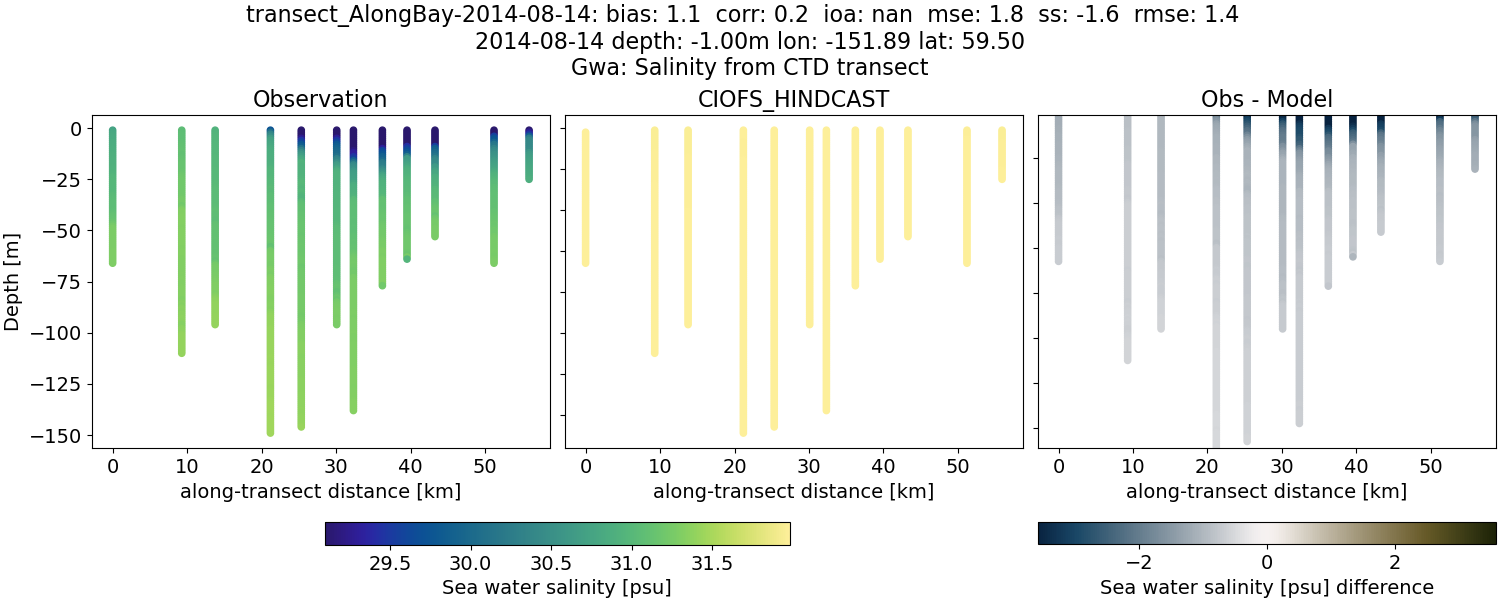
Fig. 8 Example of CIOFS Hindcast CTD transect comparison with salinity data (from the GWA project of repeated transects across Cook Inlet).#
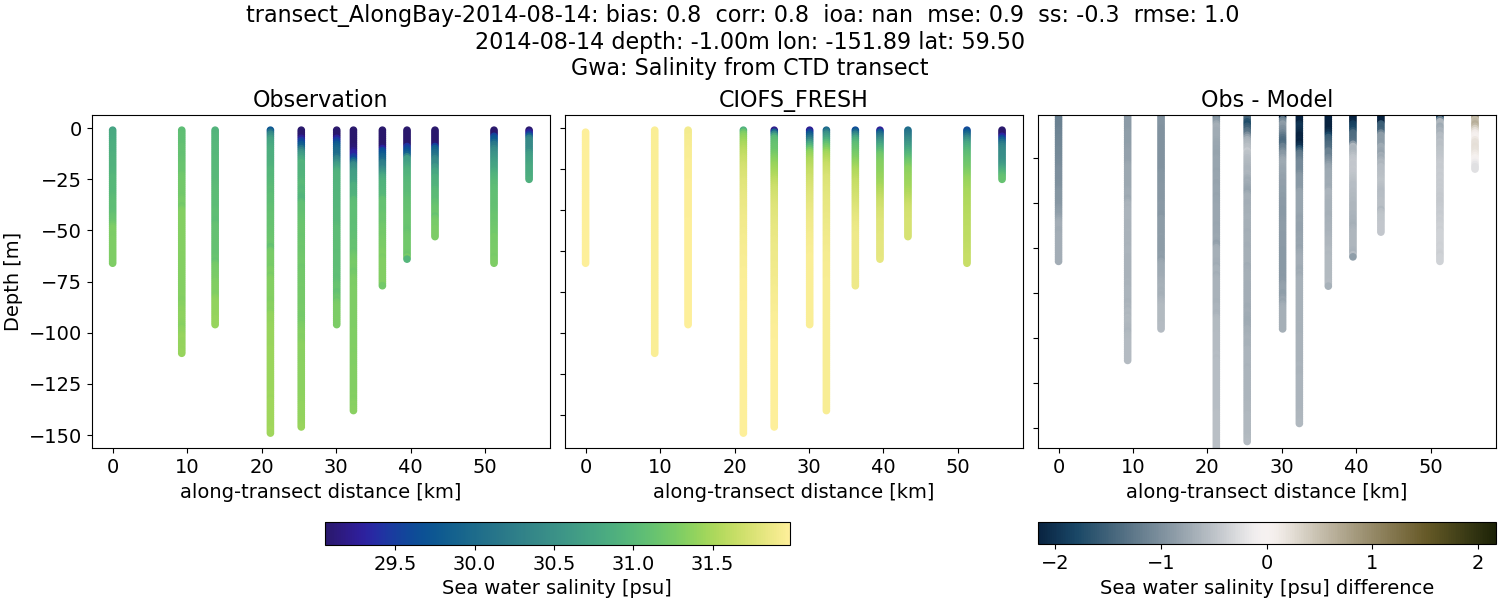
Fig. 9 Example of CIOFS Freshwater CTD transect comparison with salinity data (from the GWA project of repeated transects across Cook Inlet).#
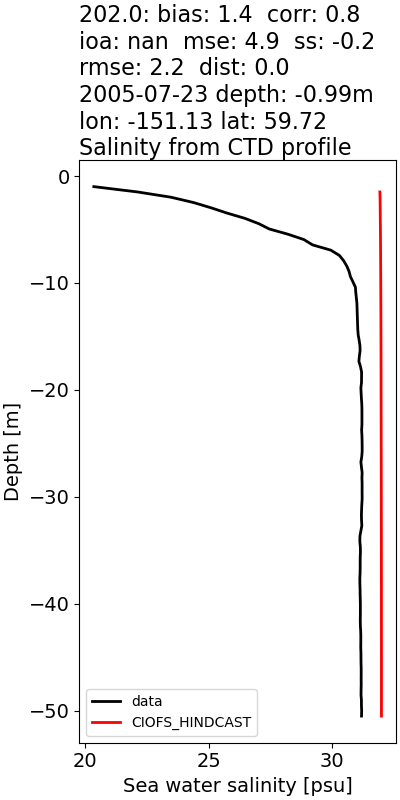
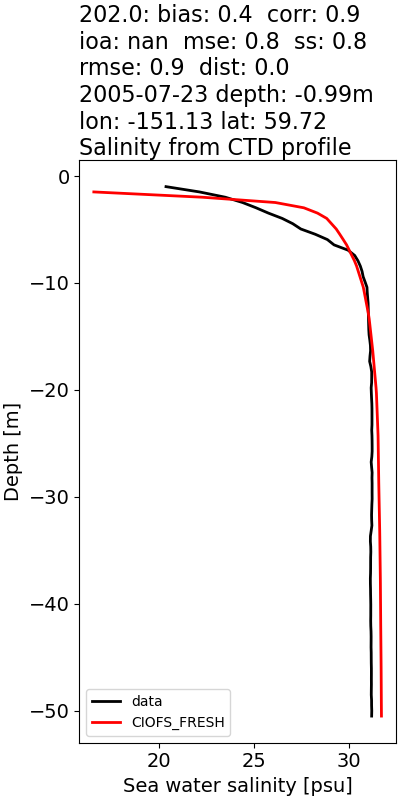
Looking at CTD profiles, CIOFS Freshwater has both better correlation and improved variance over CIOFS Hindcast (see Fig. 84). Salinity profiles in Kachemak Bay are better in CIOFS Freshwater. In the example profiles below, CIOFS Hindcast has a well-mixed profile that is salty whereas CIOFS Freshwater has a more realistic, fresh surface layer.
Salinity time series are not well-represented by either model (see Fig. 57). While we find some improved skill score for CIOFS Freshwater, primarily we find substantially more variability as compared with CIOFS Hindcast. For example, this is noticeable at a deep mooring where the subtidal salinity time series from CIOFS Hindcast across a year is relatively constant (Fig. 10) but the additional freshwater leads to increased variability in the CIOFS Freshwater model (Fig. 11), though not much improved skill score (0.3 vs 0.1).
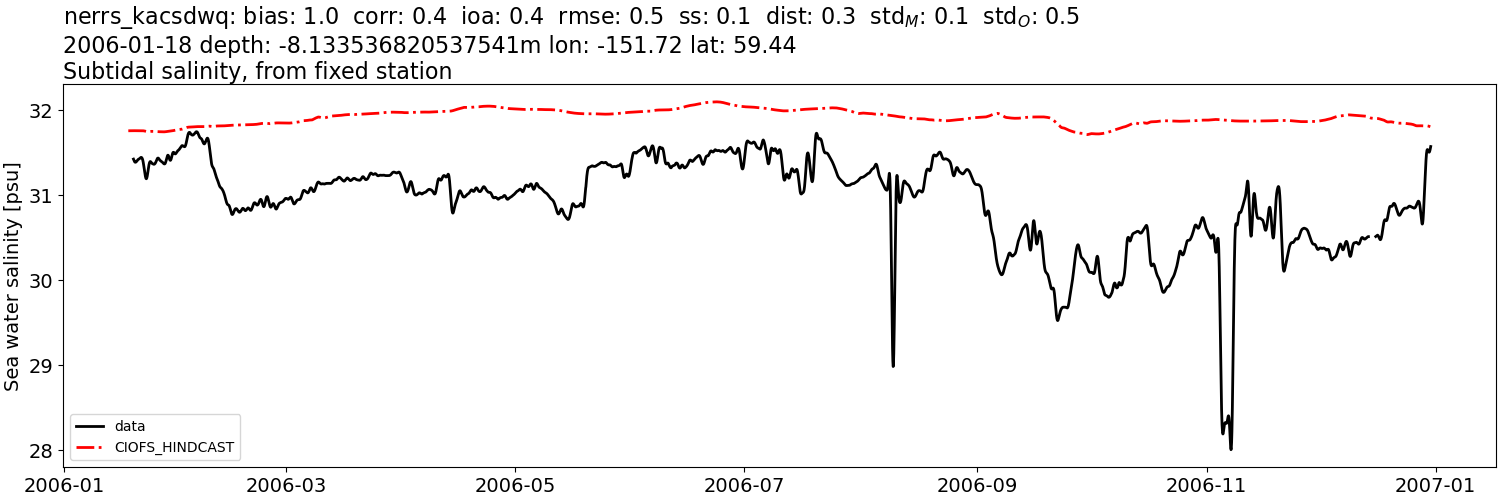
Fig. 10 Example of CIOFS Hindcast deep water subtidal time series comparison with salinity data (Station nerrs-kacsdwq).#
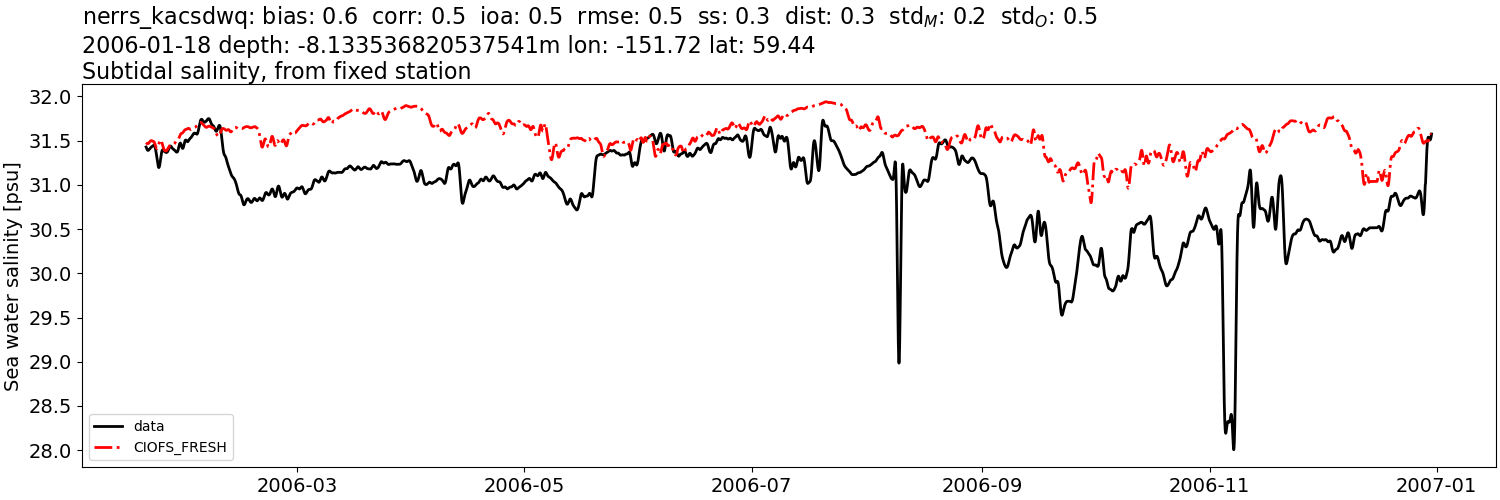
Fig. 11 Example of CIOFS Freshwater deep water subtidal time series comparison with salinity data (Station nerrs-kacsdwq).#
Currents#
The currents are mostly captured similarly for the two models for HF Radar and ADCP data, though generally the subtidal time series from CIOFS Fresh have improved variance.
However, comparisons between in situ drifters and numerical particle simulations show differences between the models depending on the area and depth of the domain in which the drifter was traveling. The EcoFOCI drifters mostly traveled outside of Cook Inlet in the Gulf of Alaska where differences in freshwater due to the improved freshwater forcing in CIOFS Freshwater are minimal. Accordingly, the particle simulations and skill scores there are similar between the two models. These and deeper UAF drifter results can particularly be seen in the overview plots at 15m and 40m depth (see salinity profile above for variability with depth for example).
The UAF drifters are in Cook Inlet where freshwater is potentially an important feature, and they were run at multiple depths. The rest of the UAF drifters besides those run at 15m depth were run at 7.5, 5, and 1m depth, and with shallower depth there is increasing difference between the CIOFS Hindcast and CIOFS Freshwater particle simulations as the freshwater takes on a more important role. For example, the CIOFS Hindcast 1m particles (Fig. 12) are limited in transport compared to the CIOFS Freshwater particles (Fig. 13), which travel much farther through the Inlet with the freshwater present in the system. The CIOFS Freshwater particles are much more accurate than the CIOFS Hindcast particles.
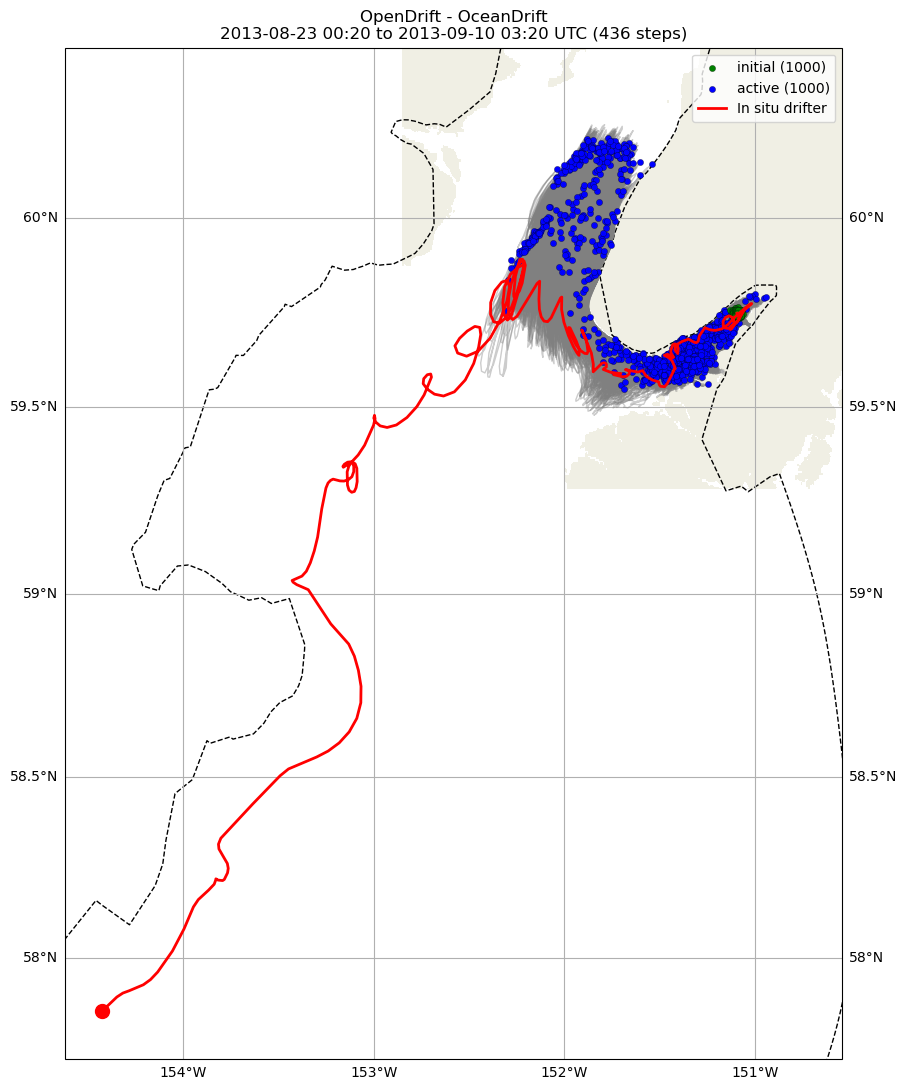
Fig. 12 Example of CIOFS Hindcast 1m drifter and particle simulations (drifter CIDrifter0008Y2013_MicrostarSurfaceAt1M_deployment4).#
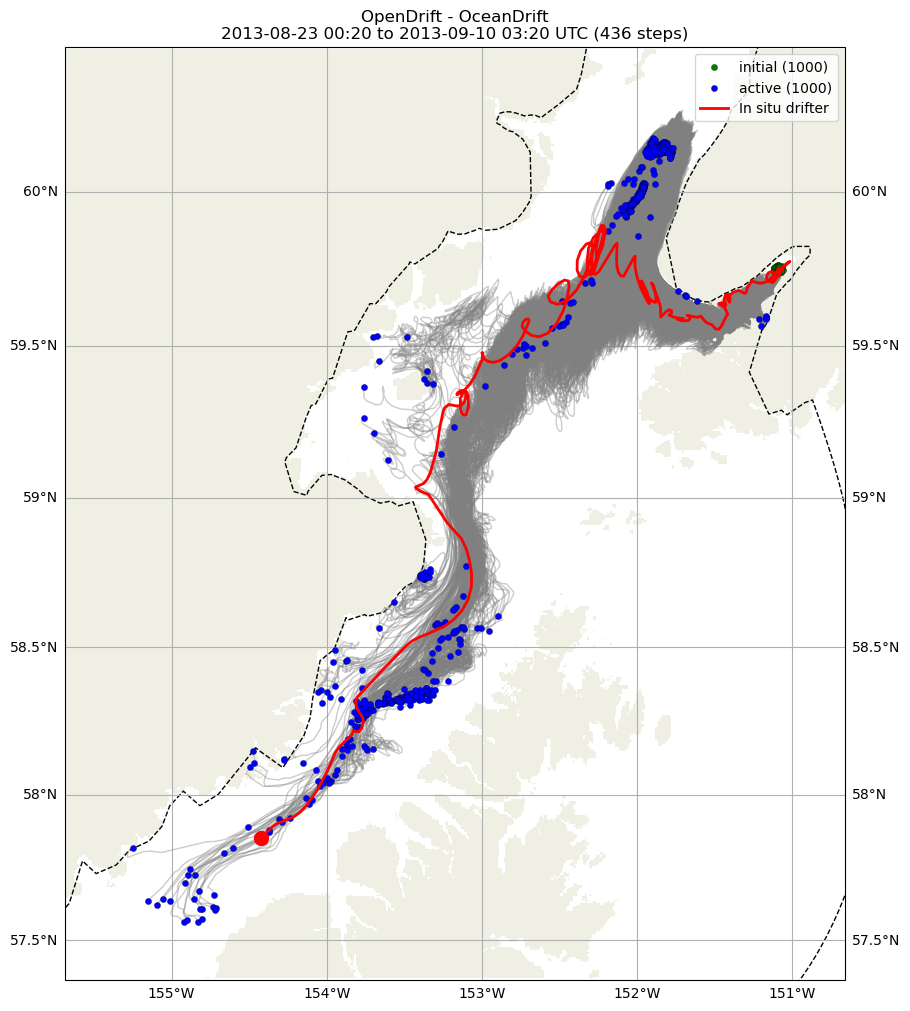
Fig. 13 Example of CIOFS Freshwater 1m drifter and particle simulations (drifter CIDrifter0008Y2013_MicrostarSurfaceAt1M_deployment4).#
Temperature#
The seasonal temperature range is relatively easy to capture by a numerical model, and both the CIOFS Hindcast and Freshwater models often capture the full tidal or subtidal temperature time series shown in the moorings data. However, they do have differences. While the CIOFS Hindcast model has the full seasonal temperature range at the head of the Inlet (NOAA 9455920, Fig. 14) and the south end of Kodiak Island (NOAA 9457804), it is a bit too cool relative to the data in the summer west of Kodiak Island (WMO 46077) and in the spring and summer east of Kodiak Island (NOAA 9457292). In Kachemak Bay, the CIOFS Hindcast model is more likely to be somewhat cold relative to the data throughout the year at the surface (Fig. 15) and at depth (Fig. 16), except in the summer.
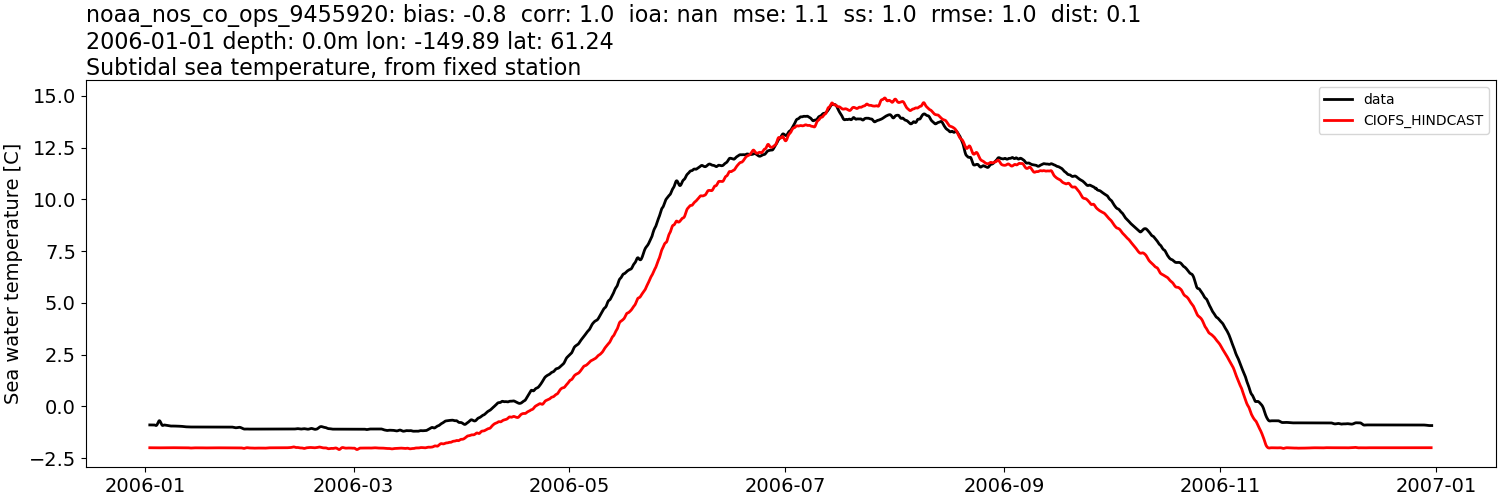
Fig. 14 Example of CIOFS Hindcast surface water subtidal time series comparison at the head of the Inlet with temperature data (Station noaa_nos_co_ops_9455920).#
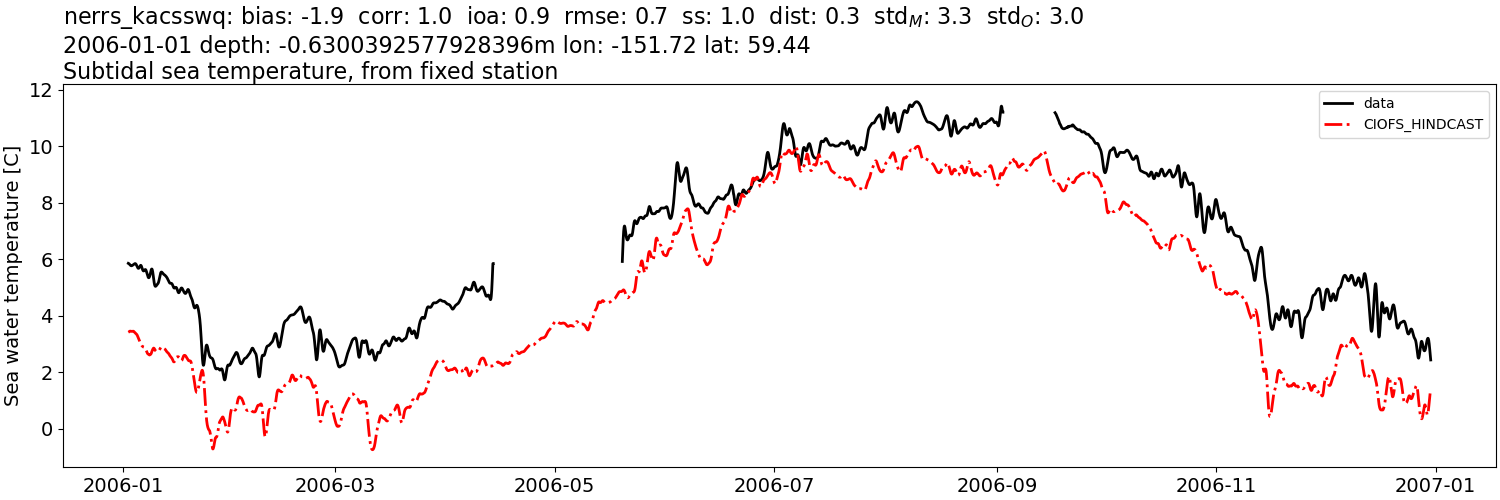
Fig. 15 Example of CIOFS Hindcast surface water subtidal time series comparison in Kachemak Bay with temperature data (Station nerrs_kacsswq).#
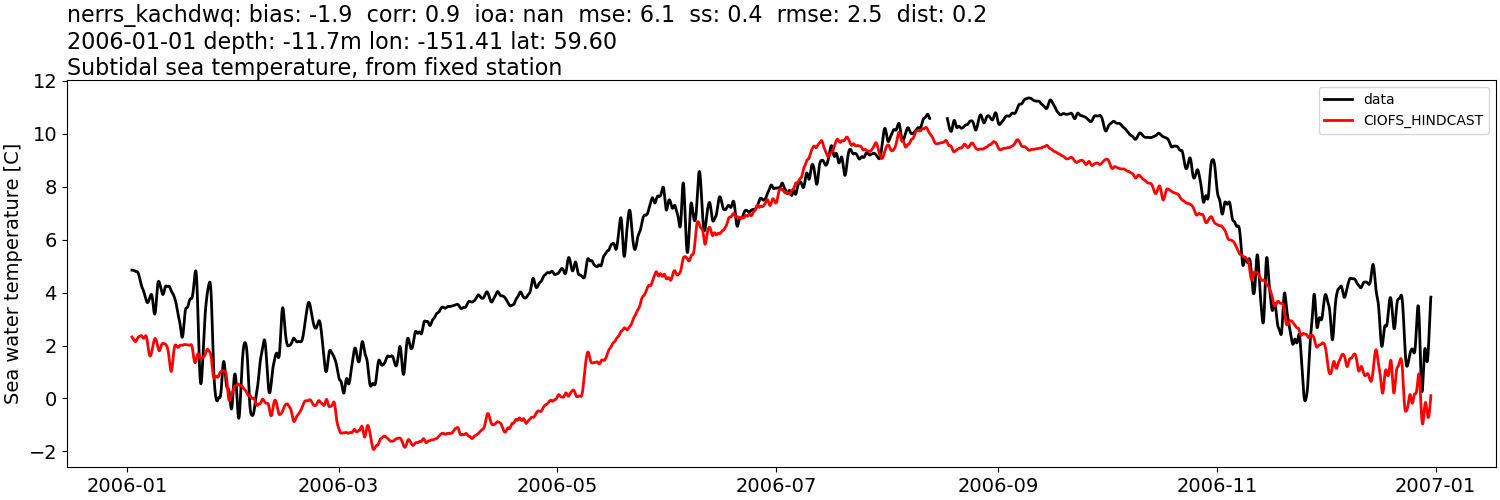
Fig. 16 Example of CIOFS Hindcast deep water subtidal time series comparison in Kachemak Bay with temperature data (Station nerrs_kachdwq).#
CIOFS Freshwater shows consistently low temperatures in the subtidal temperature signal across the year in the same locations shown for CIOFS Hindcast: NOAA 9455920 (Fig. 17), Kachemak Bay surface (Fig. 18), and Kachemak Bay deep (Fig. 19).
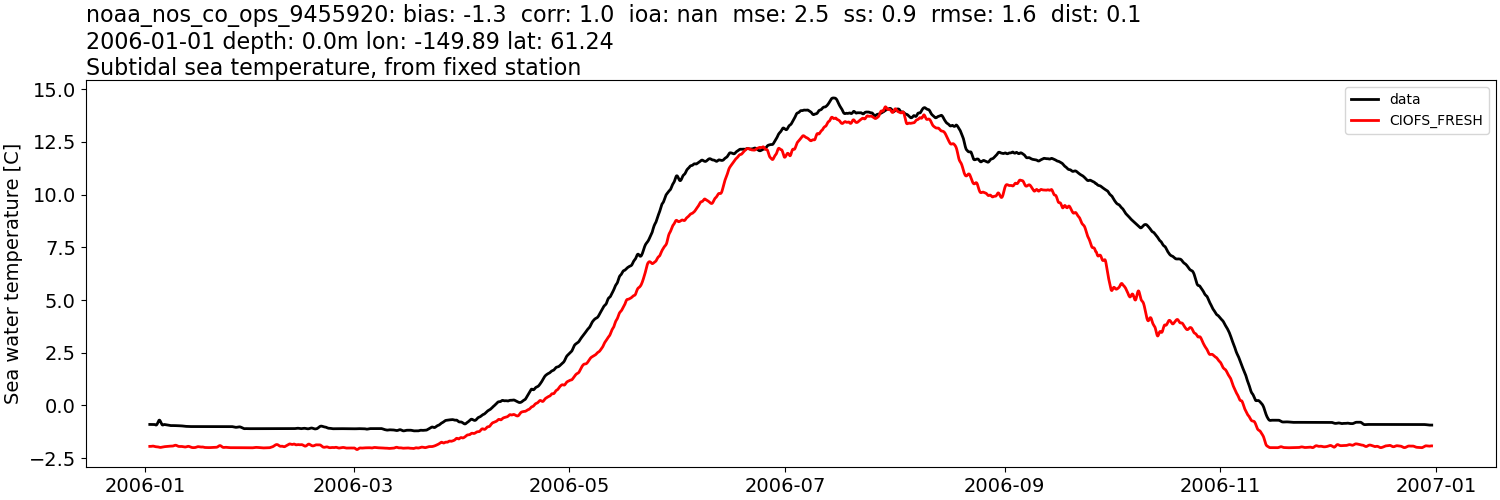
Fig. 17 Example of CIOFS Freshwater surface water subtidal time series comparison at the head of the Inlet with temperature data (Station noaa_nos_co_ops_9455920).#
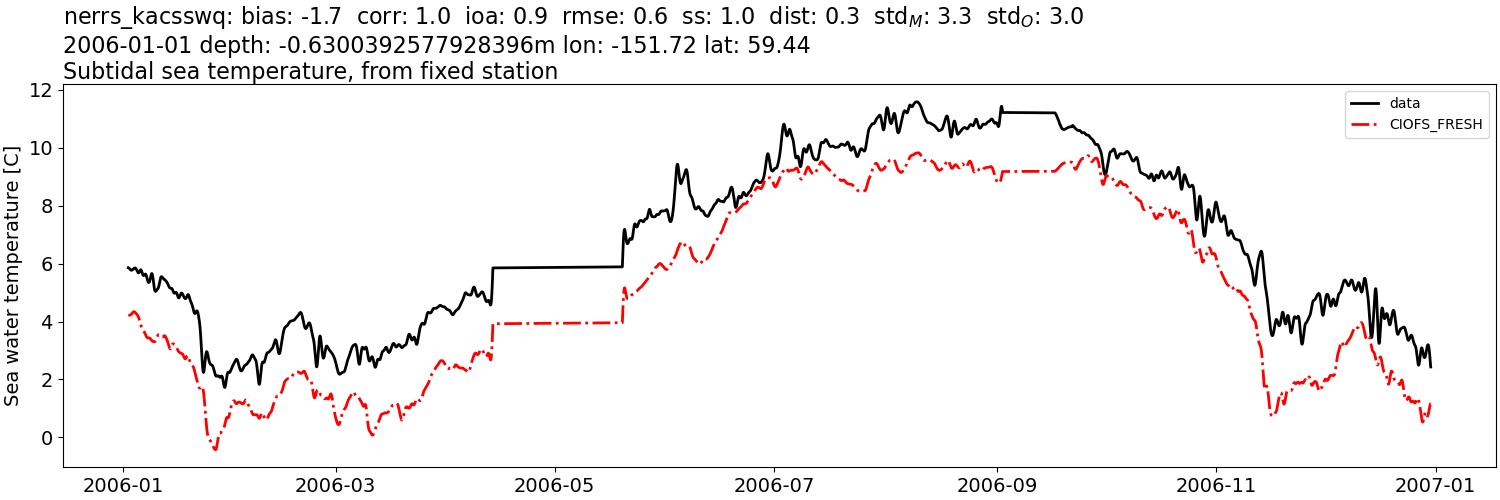
Fig. 18 Example of CIOFS Freshwater surface water subtidal time series comparison in Kachemak Bay with temperature data (Station nerrs_kacsswq).#
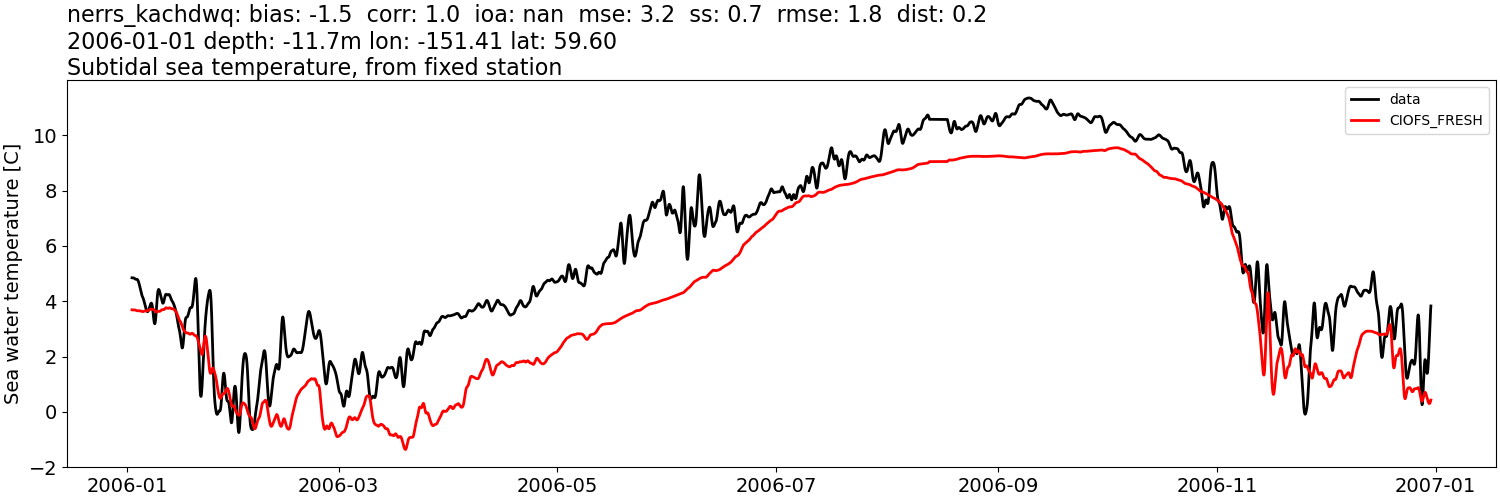
Fig. 19 Example of CIOFS Freshwater deep water subtidal time series comparison in Kachemak Bay with temperature data (Station nerrs_kachdwq).#
CIOFS Freshwater saw some small improvement in the difficult measure of temperature anomaly. For example, showing the same year as the other examples, whereas CIOFS Hindcast demonstrates only moderate skill in this measure with a skill score of 0.6, CIOFS Freshwater has 0.9 and visually follows the trend of the data through the year.
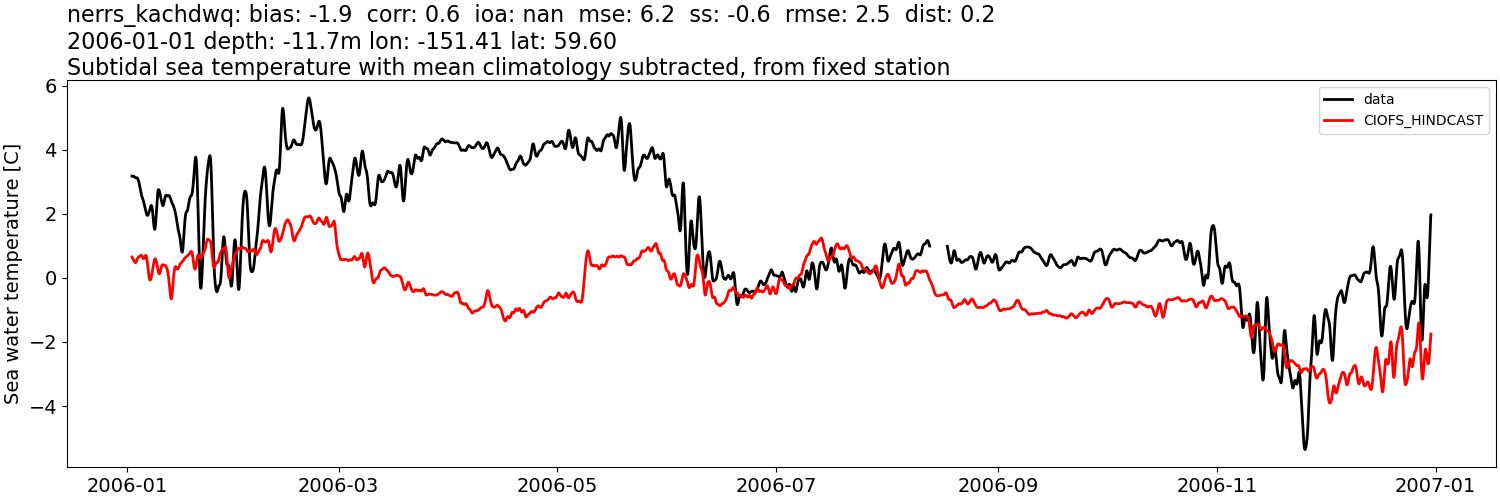
Fig. 20 Example of CIOFS Freshwater deep water subtidal temperature anomaly time series comparison in Kachemak Bay with temperature data (Station nerrs_kachdwq).#
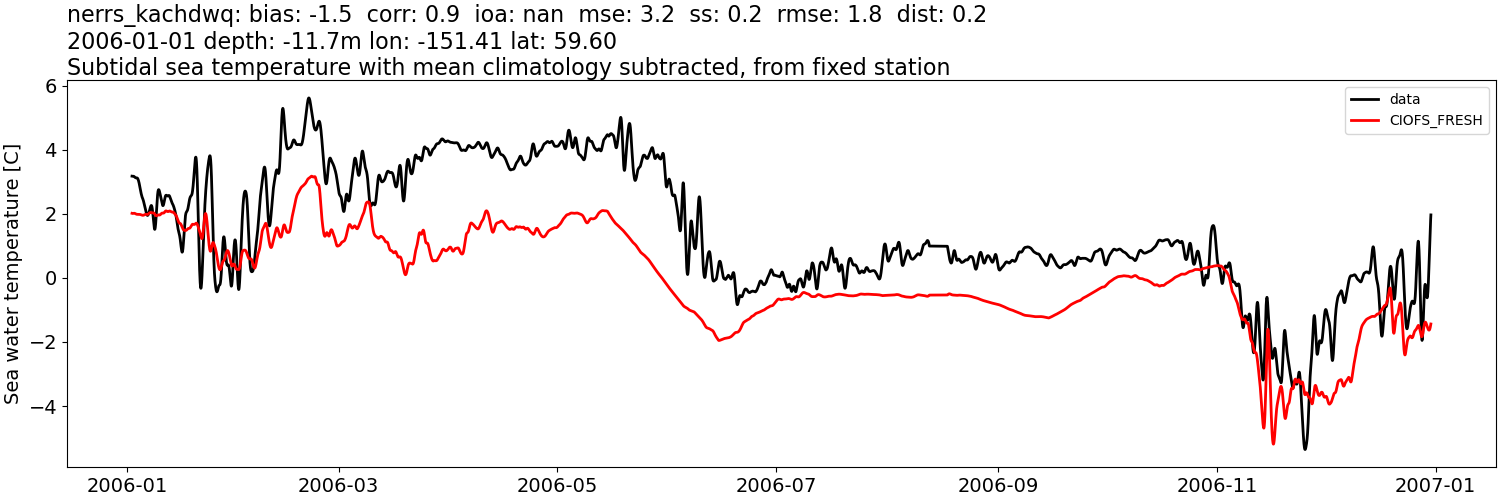
Fig. 21 Example of CIOFS Freshwater deep water subtidal temperature anomaly time series comparison in Kachemak Bay with temperature data (Station nerrs_kachdwq).#
CTD transects for temperature are similar between CIOFS Hindcast and CIOFS Freshwater, but CIOFS Freshwater does perform better, as seen in Figs. 76 and 77.
Sea Surface Height#
Both models capture the tidal sea surface height well. CIOFS Freshwater represents the subtidal sea surface height more accurately than CIOFS Hindcast (Fig. 55), and the highest skill scores are at station 9455920 near Anchorage. However, note an important difference in how the CIOFS Freshwater model is able to capture peaks in a way that the CIOFS Hindcast model is not. CIOFS Hindcast for an example year at this station (Fig. 22) shows subtidal variability, but it misses most unique peaks and troughs. CIOFS Freshwater (Fig. 23) captures many of these, implying that these peaks and troughs are due to freshwater input.
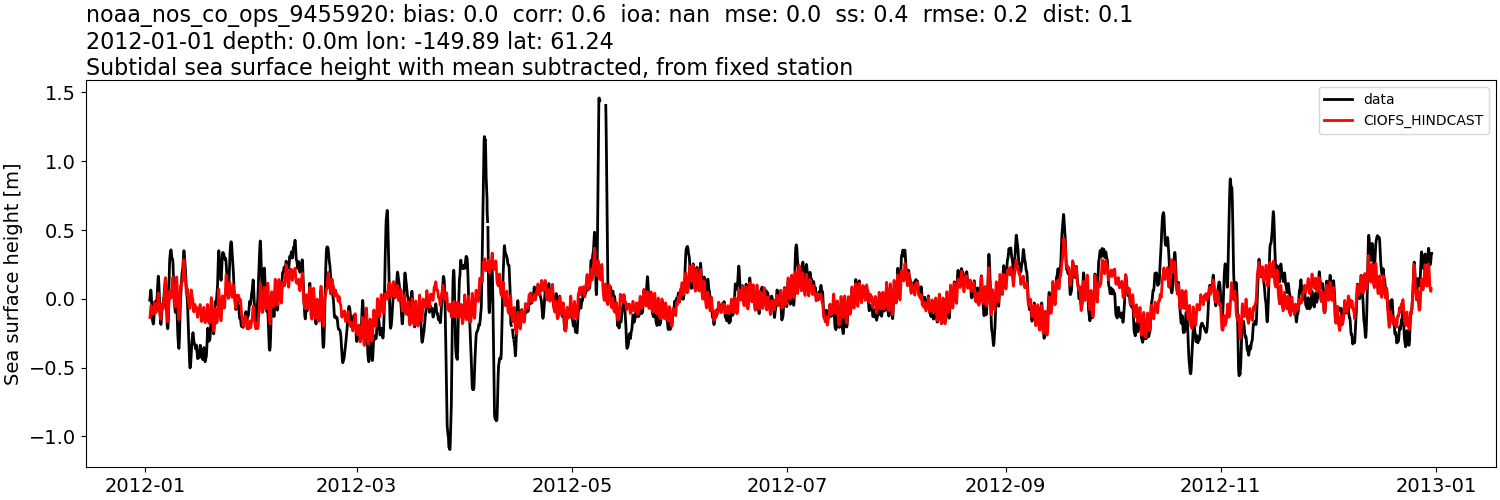
Fig. 22 Example of CIOFS Hindcast subtidal time series comparison with sea surface height data (Station noaa_nos_co_ops_9455920).#
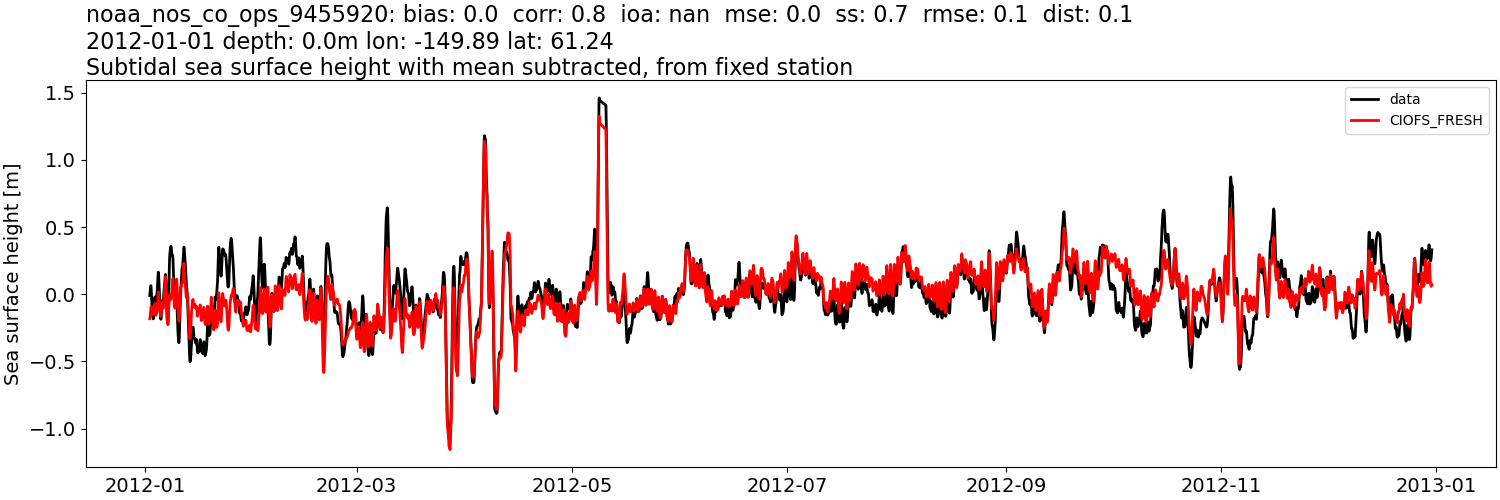
Fig. 23 Example of CIOFS Freshwater subtidal time series comparison with sea surface height data (Station noaa_nos_co_ops_9455920).#