Overview CTD Profiles#
CTD profiles are compared between data and each model and summarized on plots below by variable using the skill score. A higher skill score is better with 1 giving perfect skill.
Results show that CIOFS hindcast and CIOFS fresh have similar skill for temperature, but CIOFS fresh has better skill than CIOFS hindcast for salinity.
122MB zipfile of plots and stats files
Map of Stations#
Fig. 82 All CTD profiles, by project. Click on a legend entry to toggle the transparency. (HTML plot, won’t show up correctly in PDF.)#
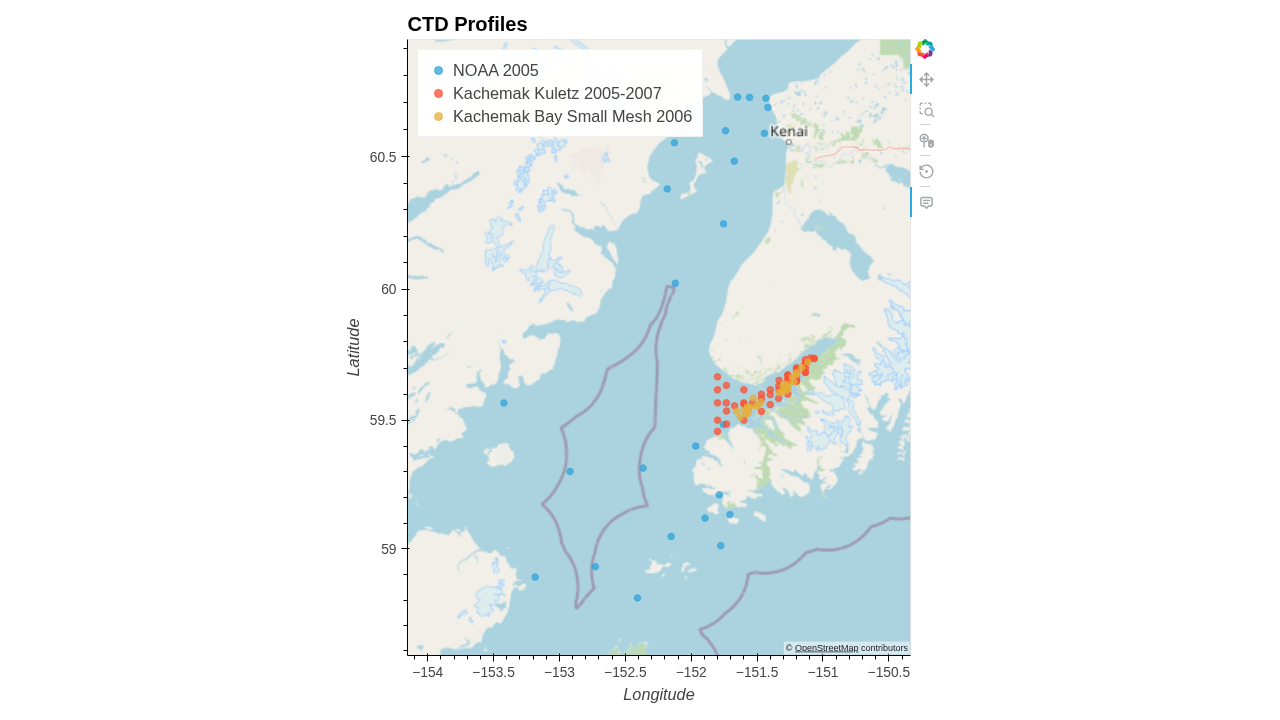
Fig. 83 All CTD profiles, by project. (PNG screenshot, available for PDF and for saving image.)#
Taylor Diagrams#
Taylor diagrams summarize the skill of the two models in capturing the CTD profile datasets. The data has been grouped by region (Fig. 84) and season (Fig. 85). By region for temperature, CIOFS Fresh has higher skill than CIOFS Hindcast, either by a little or a lot, except CIOFS Hindcast performs much better for Upper Cook Inlet. By region for salinity, CIOFS Fresh has much too high of variability in Kachemak Bay and Upper Cook Inlet while CIOFS Hindcast has much too low variability. For other regions, CIOFS Fresh performs clearly better than CIOFS Hindcast except for outside of Cook Inlet, for which CIOFS Fresh actually performs similarly to CIOFS Hindcast and neither are good. By season, data is only available in spring and summer. CIOFS Fresh is better for temperature in spring but similar for summer. For salinity, CIOFS Fresh again has much too high variability and CIOFS Hindcast much too low.
Skill scores are shown in the next plots for each dataset.
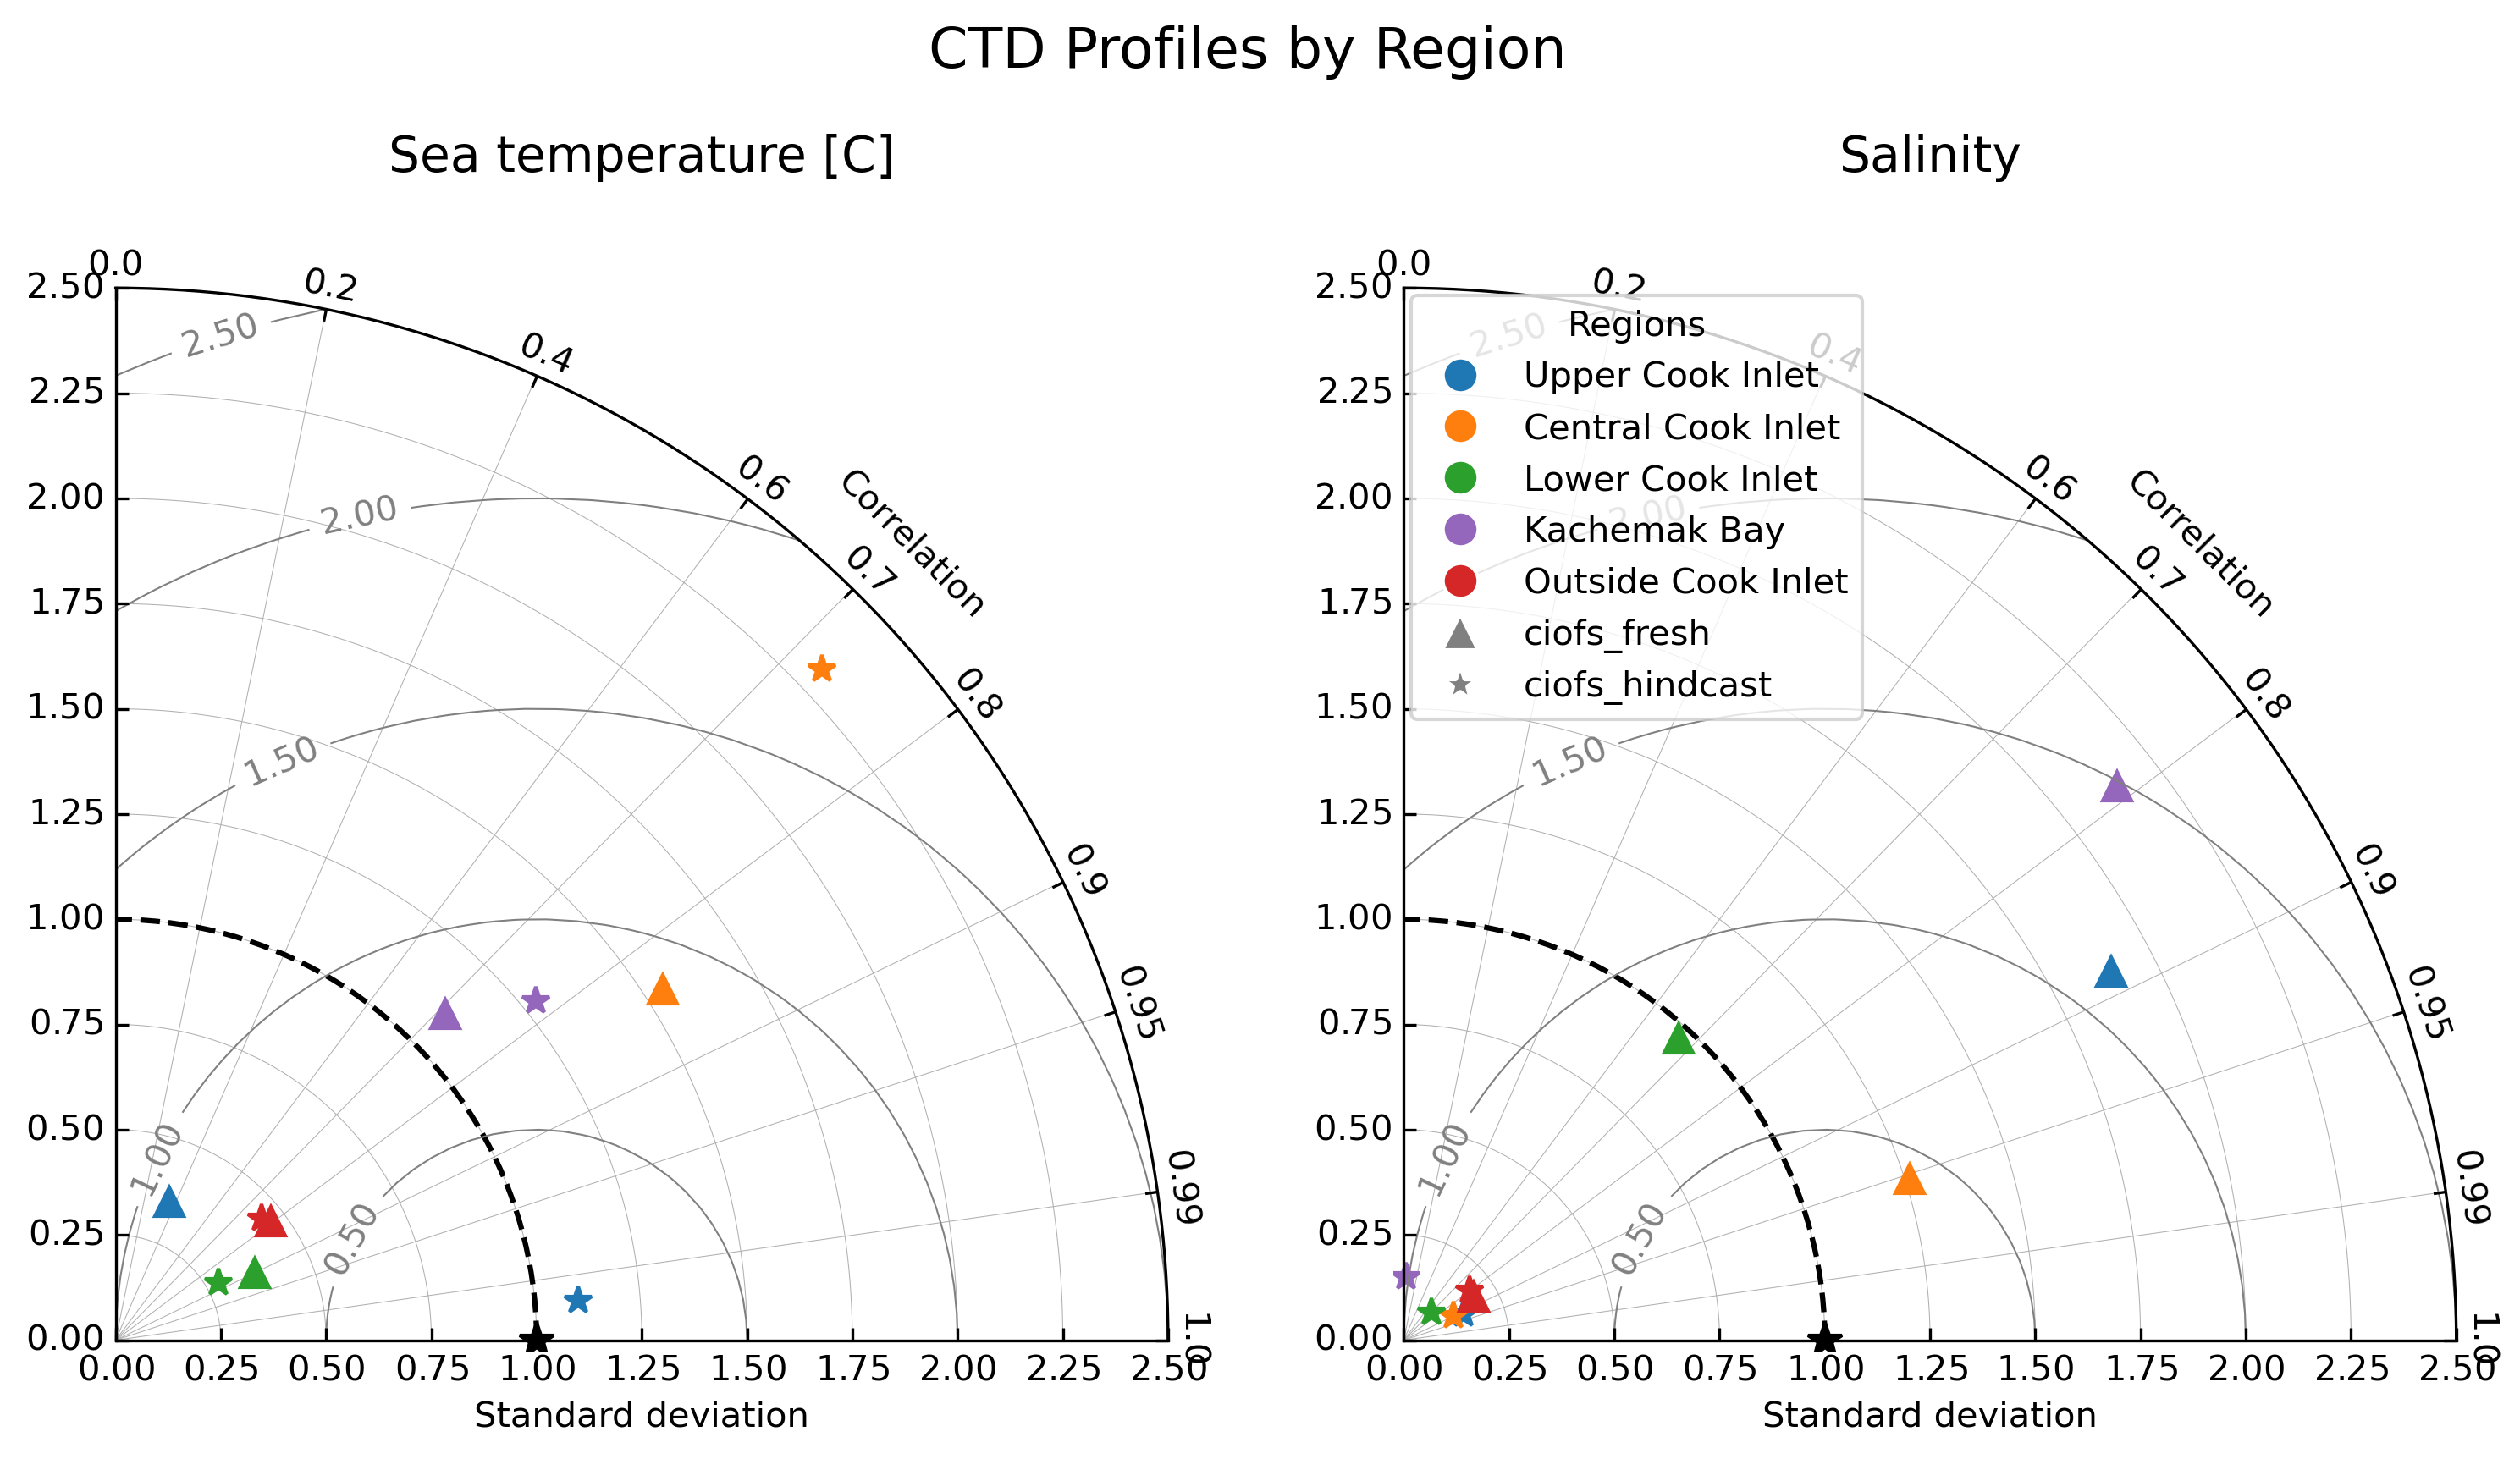
Fig. 84 Taylor Diagram summarizing skill of CIOFS Hindcast (stars) and CIOFS Fresh (triangles) for temperature (left) and salinity (right), grouped by region of Cook Inlet, for CTD profiles datasets.#
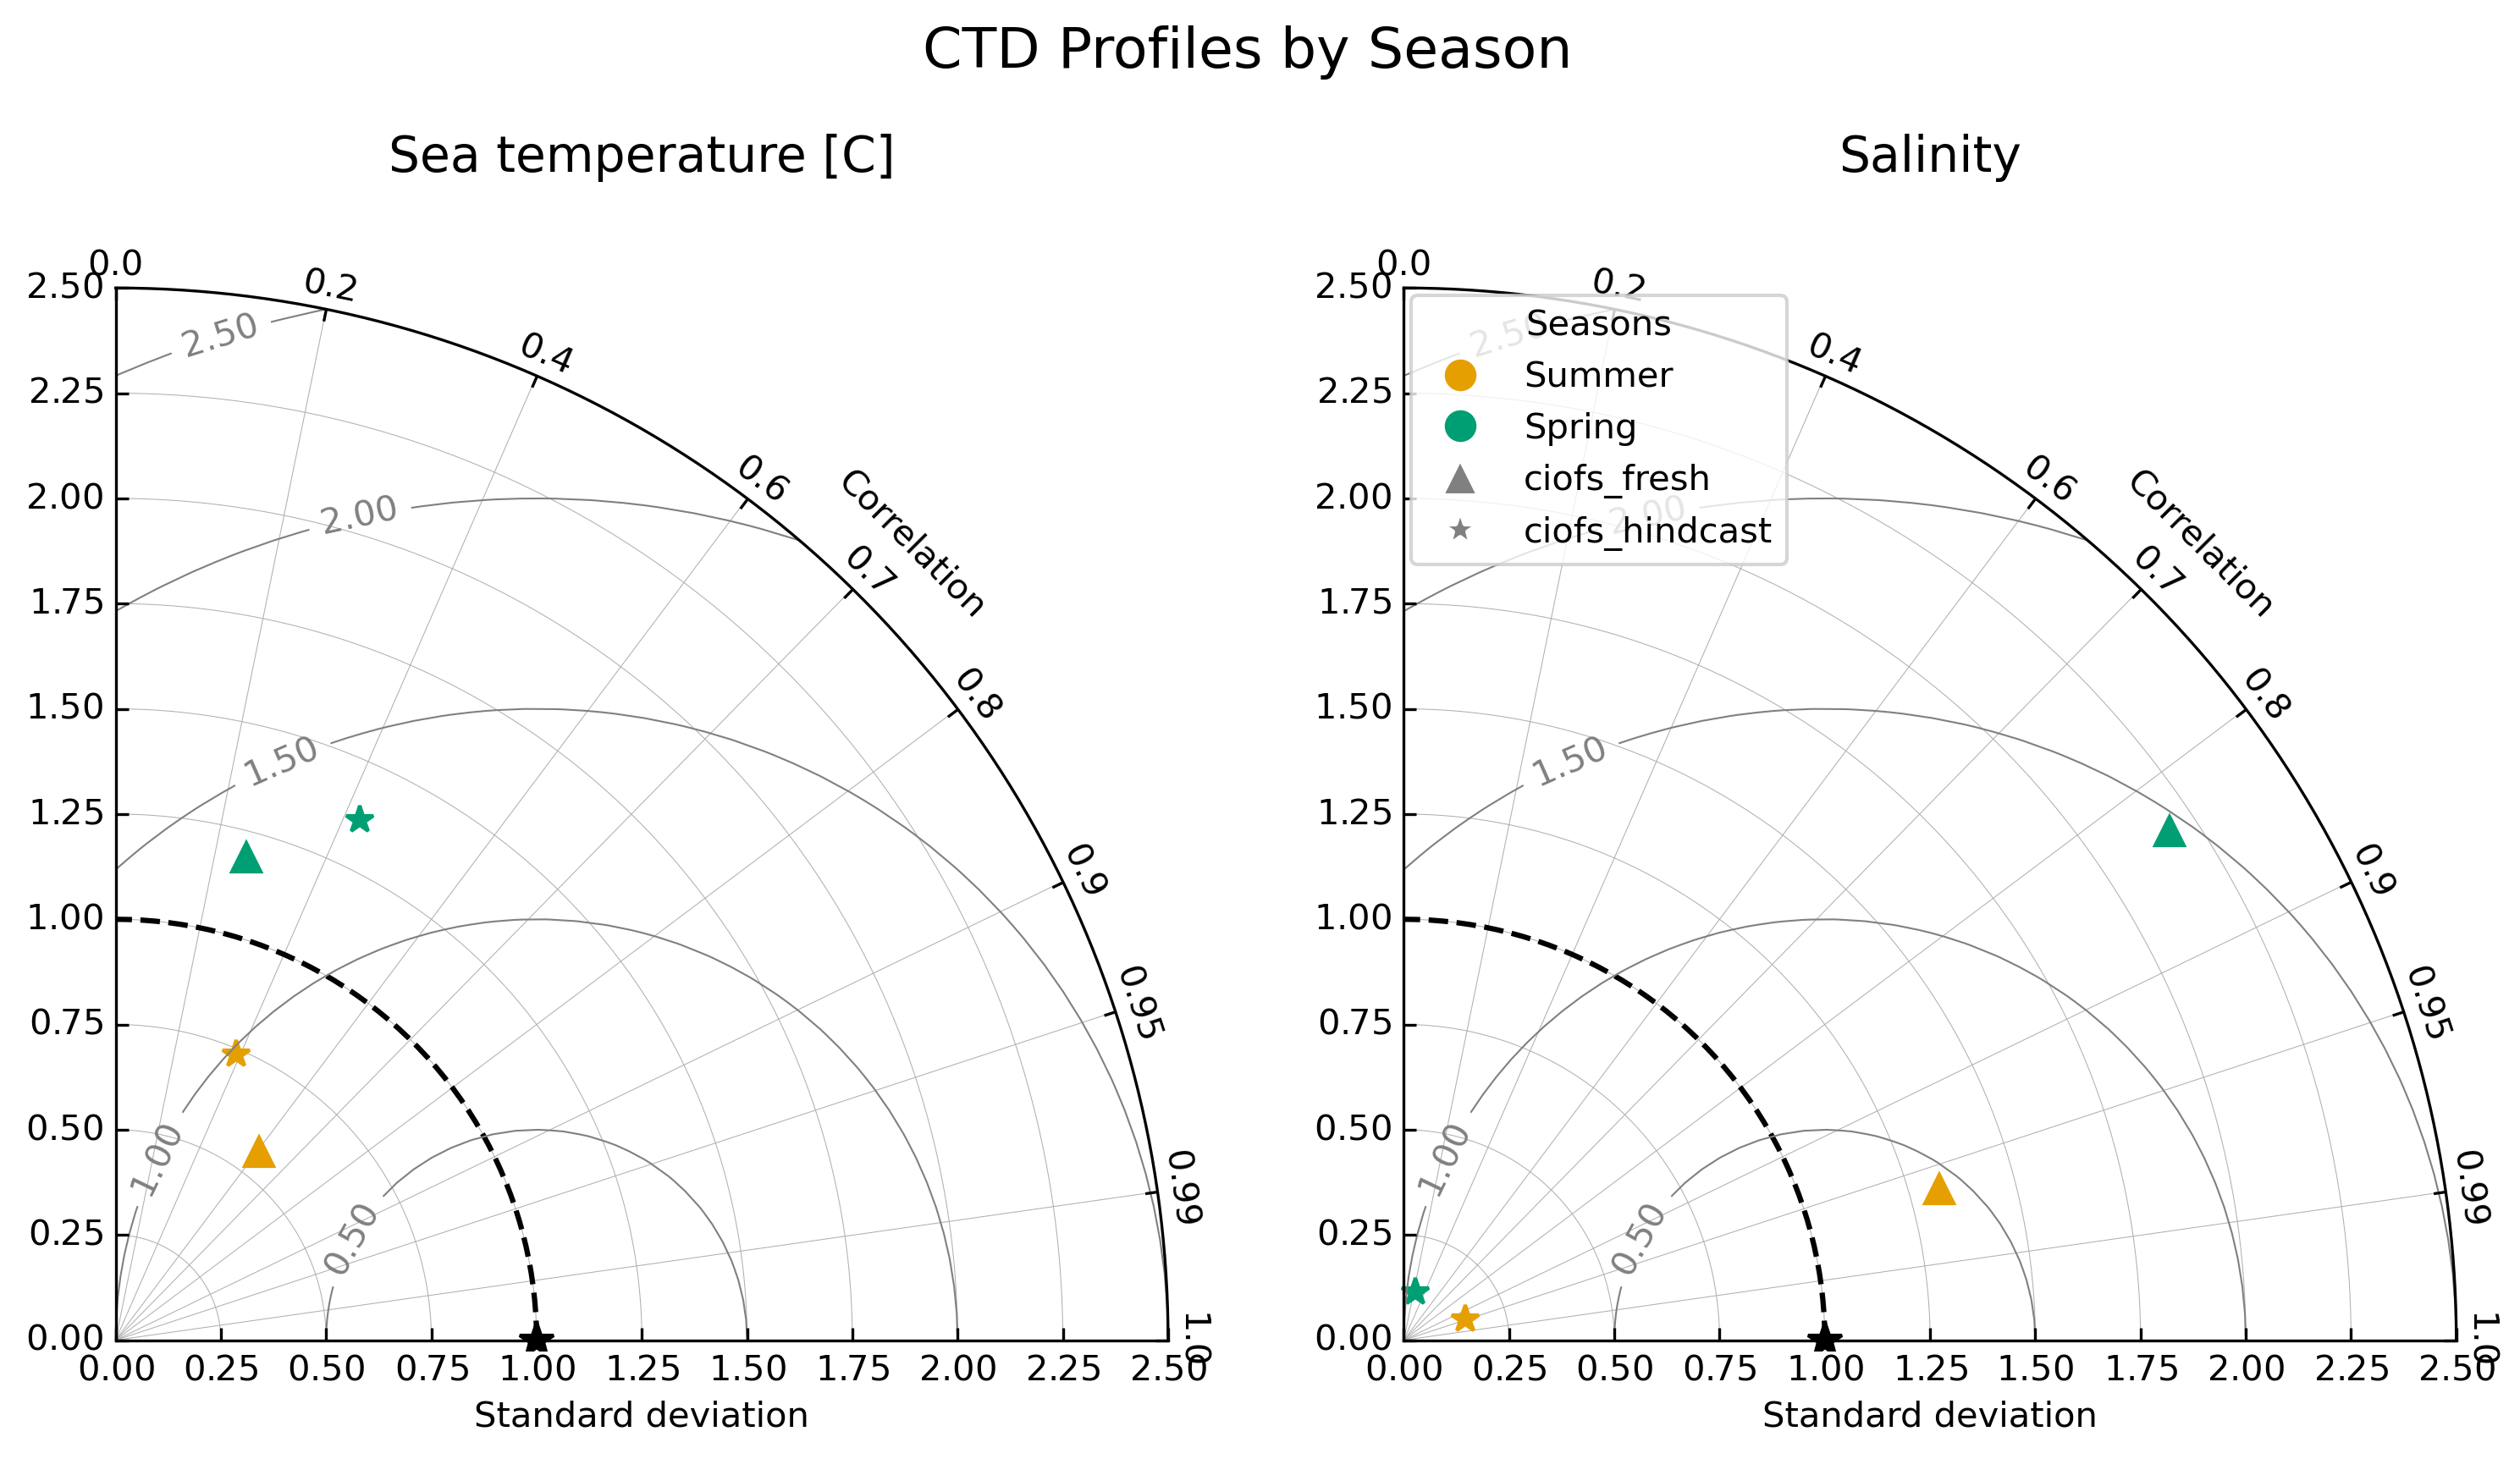
Fig. 85 Taylor Diagram summarizing skill of CIOFS Hindcast (stars) and CIOFS Fresh (triangles) for temperature (left) and salinity (right), grouped by season, for CTD profiles datasets.#
Sea Temperature#
Fig. 86 Skill scores for CIOFS Hindcast (left) and CIOFS Freshwater (right) with CTD profiles for sea temperature, by project. Click on a legend entry to toggle the transparency. (HTML plot, won’t show up correctly in PDF.)#
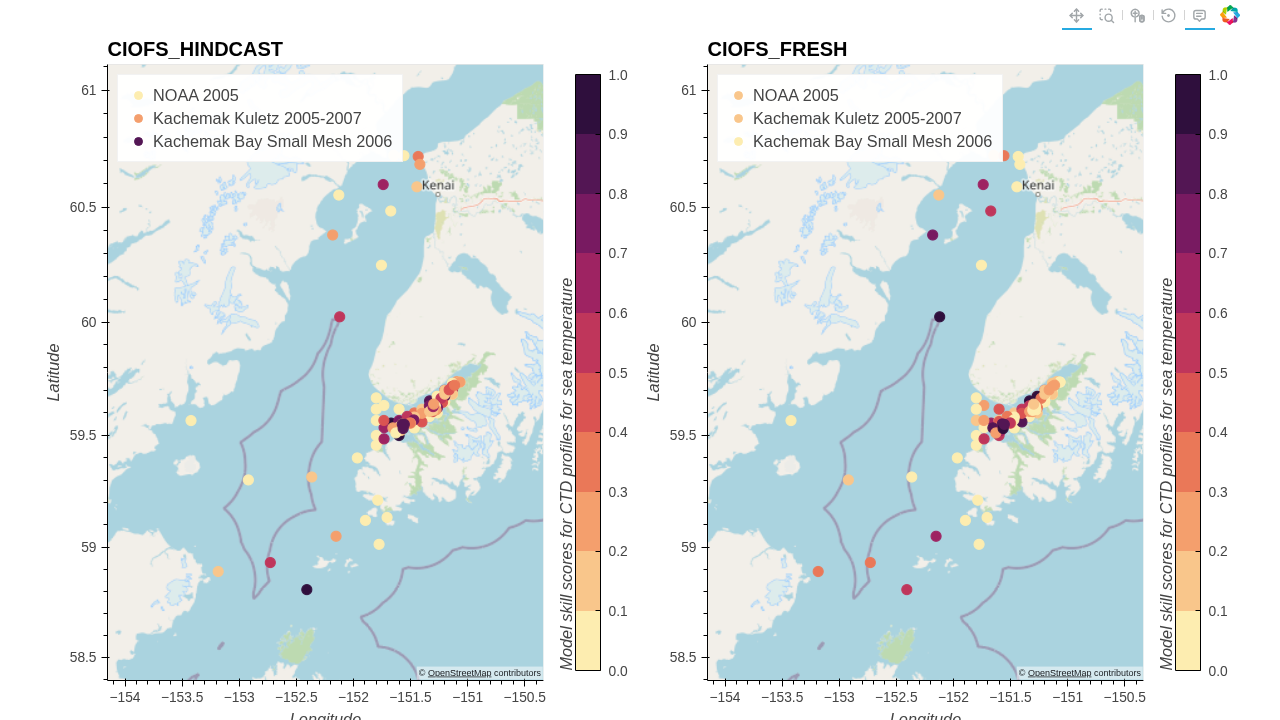
Fig. 87 Skill scores for CIOFS Hindcast (left) and CIOFS Freshwater (right) with CTD profiles for sea temperature, by project. (PNG screenshot, available for PDF and for saving image.)#
Salinity#
Fig. 88 Skill scores for CIOFS Hindcast (left) and CIOFS Freshwater (right) with CTD profiles for salinity, by project. Click on a legend entry to toggle the transparency. (HTML plot, won’t show up correctly in PDF.)#
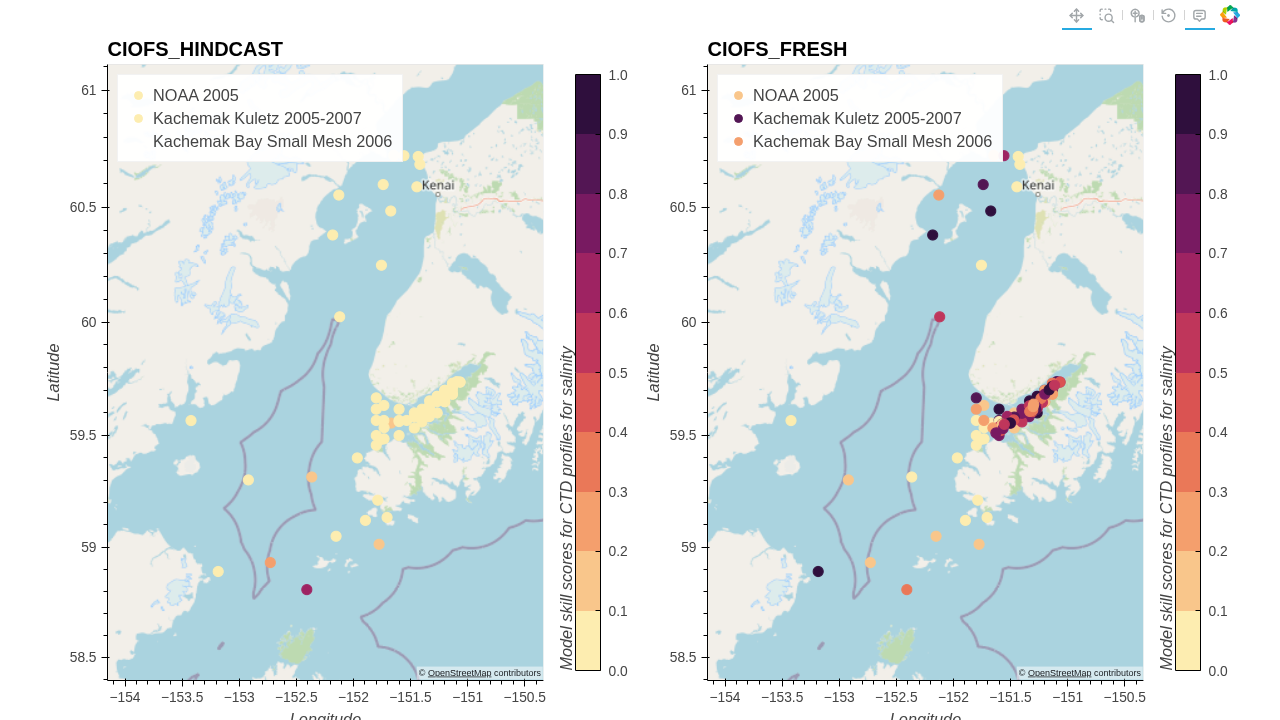
Fig. 89 Skill scores for CIOFS Hindcast (left) and CIOFS Freshwater (right) with CTD profiles for salinity, by project. (PNG screenshot, available for PDF and for saving image.)#